Int. J. Electrochem. Sci., 13 (2018) 11150 – 11163, doi: 10.20964/2018.11.88
International Journal of
ELECTROCHEMICAL
SCIENCE
www.electrochemsci.org
Influence of Lanthanum and Barium on the
Electrochemical
Properties
of Grid Alloys in Lead-Acid Energy Storage Batteries
Shaoqiang Yang1
, Xianyu Cai2, Ruhong Li1, Baofeng Yang1,2, Xinguo Hu1, Changsong Dai1,*
1
MIIT Key Laboratory of Critical Materials Technology for New Energy Conversion and Storage, School of Chemistry and Chemical Engineering, Harbin Institute of Technology, Harbin, Heilongjiang, 150001, PR China, E-mail: changsd@hit.edu.cn;
2
Key Laboratory of Electrochemical Energy Storage Technology Enterprises of Jiangsu, Shoto Group Co. Ltd. Taizhou, Jiangsu, 225300, PR China
*
E-mail: changsd@hit.edu.cn
Received: 20 July 2018 / Accepted: 5 September 2018 / Published: 1 October 2018
Lead acid battery is the most preferential option for energy storage application because of its mature manufacturing technology, reliability and high safety. Nonetheless, a negative trait is that the lead– calcium (Pb–Ca) alloy may suffer severe corrosion as a result of long-term depth discharge. Herein, corrosion resistance property has been implemented by cyclic voltammetry (CV) approach and the concentration of Pb2+ in the mixture solution (acetic acid, nitric acid and hydrogen peroxide) are measured for the first time by inductively coupled plasma atomic emission spectrometry (ICP-AES) after corrosion test. The addition of the lanthanum (La) and barium (Ba) can improve the corrosion resistance of Pb-Ca-Sn-Al alloy in sulfuric acid electrolyte. Furthermore, the outstandingly high conductivity of the oxidation film on aforementioned alloy electrode is achieved because the growth of PbO in the oxidation film is inhibited by the La or Ba in Pb-Ca-Sn-Al alloy. Meanwhile, the addition of La or Ba can improve oxygen evolution performance of alloy electrodes in sulfuric acid electrolyte.
Keywords: Lead alloys; Anodic films; Lead acid battery; Energy storage application
1. INTRODUCTION
especially useful for the maintenance-free type lead acid battery, because it enables the small self-discharge and lower water consumption to be realized [7-9]. However, an undesirable characteristic is that the Pb–Ca alloy may suffer deterioration due to long-term depth discharge: 1) rapid corrosion of the positive grids in energy storage systems; 2) passive film with high impedance characteristics easily formed between the positive grid and the positive active material (PAM).
To address the issues of rapid corrosion of the positive grids, numerous studies have been conducted to excogitate advanced grid alloys with elaborate structure and property. The most effective strategy is to involve additives, such as Ag [10, 11], Ba [12, 13], C [14], into lead–calcium alloys and improve mechanical properties, corrosion characteristic in sulfuric acid solution. The addition of Ag in Pb–Sb alloy inhibits the growth of high impedance passivation films. [10]. Pb alloys adding Ba show a better performance in mechanical and corrosion resistance properties [11]. Both graphene and graphite as carbon materials have the properties of improving the corrosion and electrochemical properties of metal composites and are not involved in the electrochemical process [13]. However, in those researches, there are two principal issues have not yet attracted sufficient attention. Firstly, the corrosion behavior of lead alloys was studied by galvanostatic or potentiostatic polarization in those work. But the potential and current density of lead alloys is constantly changing in charge and discharge process of factual operation condition. This means that the corrosion and electrochemical characteristics are not analyzed accurately by galvanostatic or potentiostatic polarization. Secondly, the corrosion resistance is evaluated by mass loss rate or by analysis of lead ions (Pb2+) in sulfuric acid electrolyte after corrosion test. For gravimetric tests, however, a high error in the measurement of the weights of grid alloys would imply a great error in the calculation of corrosion products. Additionally, the corrosion resistance cannot be expressed by the concentration of Pb2+ in the sulfuric acid solution because only a small amount of Pb2+ gets into the electrolyte in the process of corrosion testing. So it is necessary to research the corrosion characteristics of the grid accurately during the operation of the lead acid batteries.
To address the challenges further, cyclic voltammetry (CV), a type of potentiodynamic electrochemical measurement, has been used to reveal the formation of corrosion film in the factual operation through the certain potential cycle of grid alloys. The influences of La and Ba on the corrosion behaviors at potential cycle and conductivity of corrosion film have been investigated in this paper.
2. EXPERIMENTAL
2.1 Sample preparation
The alloys was prepared by fused heavy mixtures of pure lead (99.99 wt.%), pure calcium (99.99 wt.%), pure tin (99.99 wt.%), aluminum(99.90%), (1.00 wt.%) lanthanum alloy and lead-(1.00 wt.%) barium alloy in an electric furnace equipped with high temperature alumina crucible at 800 ℃ for 20 min, an argon gas atmosphere covers on the surface of molten metals to prevent the oxidation of alloys. The molten lead was made into the bulk (20 mm × 20 mm× 400 mm) sample. The content of La and Ba in the Pb–(0.10 wt.%)Ca–(1.10 wt.%)Sn–(0.02 wt.%)Al–La/Ba alloys is listed in Table 1. The samples were manufactured into a form of bulk (1 mm × 1 mm× 0.5 mm). As the working surface, a 1 mm2 end surface was abraded with 2000 grit SiC paper, polished with 0.5 µm Al2O3 powder successively, and then cleaned using double-distilled water, while others were sealed
with epoxy resin. Fig.1 shows the schematic diagram of working electrodes.
2.2 Corrosion tests
The corrosion test was carried out by cyclic voltammetry (CV) from 0.85 V to 1.25 V (vs. Hg/Hg2SO4) with a scanning rate of 0.02 mV s−1 in 1.28g cm-3 H2SO4 solution. After 100 cycles, the
[image:3.596.106.493.622.763.2]corrosion products of working electrode for each alloy was dissolved using 100ml acetic acid solution (20%) and 100ml mixture of nitric acid (20%) and hydrogen peroxide (20%) subsequently, was added to the acetic acid solution. and diluted to a final volume of 1000 ml. The concentration of Pb2+ was analyzed using inductively coupled plasma atomic emission spectrometry (ICP-AES).
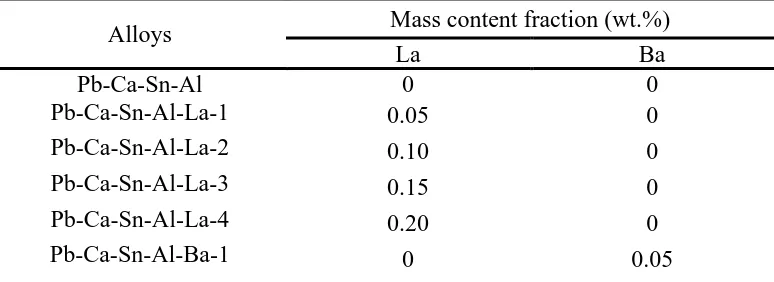
Table 1. Composition of the cast alloys
Alloys Mass content fraction (wt.%)
La Ba
Pb-Ca-Sn-Al 0 0
Pb-Ca-Sn-Al-La-1 0.05 0
Pb-Ca-Sn-Al-La-2 0.10 0
Pb-Ca-Sn-Al-La-3 0.15 0
Pb-Ca-Sn-Al-La-4 0.20 0
Pb-Ca-Sn-Al-Ba-2 0 0.10
Pb-Ca-Sn-Al-Ba-3 0 0.15
Pb-Ca-Sn-Al-Ba-4 0 0.20
Figure 1. The schematic diagram of working electrodes
2.3 Electrochemical experiments[20]
A conventional three-electrode electrochemical cell was used, the counter electrode was a carbon plate, and all potentials were measured against an Hg/Hg2SO4 reference electrode. All the
electrochemical experiments were performed at CHI660e electrochemical working station. Before experiment, a cathodic polarization at a potential of −1.2 V (vs. Hg/Hg2SO4) for 20 min was carried
out in order to remove any oxidation products formed by aerial.
For Mott–Schottky(M-S) plot, the scanning potential range was from 0.6 V to 1.8 V (vs. Hg/Hg2SO4) with a scanning rate of 50 mV/s, the measured frequency was 1000 Hz. For
electrochemical impedance spectroscopy (EIS), the sweeping frequency was from 1000 kHz to 10 mHz, and the measured potential was 0.9 V (vs. Hg/Hg2SO4). The photocurrent measurement was
made of a conventional three electrode cell of 1-multi neck flash with a quartz window as a photon inlet, a 300 W Xenon arc lamp was used as a light source, a monochromatic light with a wavelength from 200 nm to 800 nm was provided by a scanning digital monochromator controlled by a stepping motor at a scan rate of 5 nm/s, the applied potential was +0.3V, auxiliary focusing lenses were used to raise the intensity of photons toward the monochromator. Linear sweeping voltammetry (LSV) measurement was from 0.8 V to 1.8 V (vs. Hg/Hg2SO4) with a scanning rate of 10 mV/s.
2.4 Scanning electron microscopy (SEM) measurements
Morphology and elemental analysis of the surface and section of polarized electrodes were determined using SEM (Hitachi S-3400N) techniques equipped with an energy dispersive spectrometer (EDS).
[image:4.596.102.493.69.249.2]
For lead acid energy storage battery, the performance of deep cycle mode is a serious problem. This is due to the formation of corrosion products on the surface of the grid alloy. For the sake of evaluation of deep cycling performance for Pb-Ca-Sn-Al-La/Ba alloys, the corrosion test is carried out by CV method. The potential of positive electrode (battery type: HEL500, Shoto Group Co. Ltd.) at 100% state of charge and 100% state of discharge are measured, the results are shown in Table 2. The potential of positive electrode at 100% state of charge (1.25V) and 100% state of discharge (0.85V) are used as the high potential and low potential in CV test, respectively. Fig. 2 shows the CV of Pb-Ca-Sn-Al-La/Ba alloy electrodes performed between 0.85V and 1.25 V with a sweep rate of 0.02 mV s−1 in 1.28 g cm-3 H2SO4 solution. It can be seen that the CV of nine electrodes display similar features. In
[image:5.596.80.518.318.764.2]the scanning process, two peaks can be observed at about 1.25 V and 1.03V, respectively. The peak at about 1.25 V is associated with the generation of PbO2 and oxygen release. In the process of cathodic polarization scan, the peak at about 1.03 V indicates the convertion of PbO2 into PbSO4.
Table 2. The potential of positive electrode at 100% state of charge and 100% state of discharge
Battery type: HEL500 No.1 No.2 No.3 No.4 No.5
Potential of positive electrode
(V/vs. Hg/Hg2SO4)
100% state of
charge 1.268 1.244 1.265 1.242 1.244
Average 1.253
100% state of
discharge 0.845 0.846 0.864 0.849 0.864
Figure 2. CV for the Pb-Ca-Sn-Al-La/Ba alloy electrodes in 1.28 g cm−3 H2SO4 solution: a.0wt.%La;
b. 0.05wt.%La; c. 0.10wt.%La;d. 0.15wt.%La;e. 0.20wt.%La; f. 0.05wt.%Ba; g. 0.10wt.%Ba; h. 0.15wt.%Ba; i. 0.20wt.%Ba.
The current densities of peaks at about 1.25 V decrease with the increment of La and Ba content in Pb-Ca-Sn-Al alloy, indicating the increased corrosion resistance of Pb-Ca-Sn-Al alloy [7, 9].
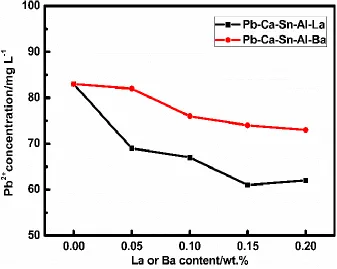
The concentration of Pb2+ in the mixture solution (acetic acid, nitric acid and hydrogen peroxide) are measured by ICP-AES, after the corrosion test is completed, and the results are illustrated in Fig.3. The specimens of La-added alloys show substantially lower Pb2+ concentration compared to the aforementioned traditional Pb-Ca-Sn-Al alloy, as well as the Ba-added counterparts. In particular, the Pb-Ca-Sn-Al-La-3 alloy shows lowest Pb2+ concentration of 61.07 mg L-1, therefore, this alloy demonstrate excellent corrosion resistance property.
In order to specify the impact of La on the corrosion property of Pb-Ca-Sn-Al alloy in H2SO4
solution, surface morphology of alloys after corrosion test are shown in Fig.4a-e. Evidently, the morphology of the corrosion products on those electrodes are different, the surface of Pb-Ca-Sn-Al alloy after corrosion test appears some corrosion holes and cracks. The holes and cracks can make the ions (including H+, H2O and SO42−) easily pass through the anodic film on Pb-Ca-Sn-Al alloy [9], and
then the corrosion rate of the alloy increases. However, this phenomenon has been greatly improved with the addition of La. In addition, it can be seen that the anodic film on alloy electrodes are consisted of amorphous and crystalline products, Fig.4f and g are the EDS analysis for the amorphous and crystalline particles in the Ca-Sn-Al-La-1 alloys, respectively. Table 3 listed the EDS results of Pb-Ca-Sn-Al-La-1 alloys. From the data of Table 3, the results indicated that the anodic film on alloy electrodes are consisted of PbSO4 and PbO1+x (0≤x≤1), that is to say, for the corrosion films on
[image:7.596.131.468.74.343.2]
Figure 4. The SEM images of alloys after corrosion test (a.0wt.%La; b.0.05wt.%La; c.0.10wt.%La; d.0.15wt.%La; e.0.20 wt.%La); EDS analysis of amorphous(f) and crystalline products(g). Table 3. The EDS results of Pb-Ca-Sn-Al-1 alloys
Elements Atomic percentage/% Figure 4f Figure 4g
Pb 43.87 16.41
O 58.72 67.23
S -2.58 16.36
To analyse the impact of Ba on the corrosion resistance of Pb-Ca-Sn-Al alloy in H2SO4
solution, the SEM images of corrosion products after corrosion test are shown in Fig.5. It shows that anodic films display the rough and inhomogeneous character similarly. Some corrosion holes and cracks appears on the Pb-Ca-Sn-Al-Ba-1 alloy. As Ba content continues to increase, the cracks on the corrosion film vanished. Compare with Fig.4b-e, PbSO4 particles significantly decreases on the anodic
film.
Figure 5. The SEM images of alloys after corrosion test (a. 0.05wt.%Ba; b.0.10wt.%Ba; c.0.15wt.%Ba; d.0.20wt.%Ba) contents after corrosion test.
[image:8.596.144.456.368.618.2]
(1)
ɛ—the dielectric constant of the passive film; ɛ0—the vacuum permitivity (8.854 ×10⁻¹⁴ F cm
-1
); e—the electron charge; ND—the donor density; EFB—the flat-band potential; K—the Boltzmann constant; T—the absolute temperature. ND can be estimated from the slope of linear fitted M-S plots, while EFB comes from the extrapolation for Csc-2 =0 [9, 20, 30].
[image:9.596.87.505.182.337.2]Figure 6. M–S plots of anodic films formed on Pb-Ca-Sn-Al-La/Ba alloys with different La (a) and Ba (b).
Table 4. The slopes of M–S plots of the anodic films on Pb-Ca-Sn-Al-La/Ba alloys
Alloys slopes
Pb-Ca-Sn-Al 13.10
Pb-Ca-Sn-Al-0.05wt.%La
9.83
Pb-Ca-Sn-Al-0.10wt.%La
7.16
Pb-Ca-Sn-Al-0.15wt.%La
6.56
Pb-Ca-Sn-Al-0.20wt.%La
6.28
Pb-Ca-Sn-Al-0.05wt.%Ba
11.74
Pb-Ca-Sn-Al-0.10wt.%Ba
8.34
Pb-Ca-Sn-Al-0.15wt.%Ba
7.59
Pb-Ca-Sn-Al-0.20wt.%Ba
6.70
The M-S plots of the corrosion products on Pb-Ca-Sn-Al-La/Ba alloys after corrosion test in 1.28g cm-3 H2SO4 solution are depicted in Fig.6. Results indicate that there is a significant linear
correlation between potential and C-2 from 0.6 V to 1.5 V(vs. Hg/Hg2SO4), meanwhile, the slopes of
[image:9.596.165.430.410.667.2]
tendency to decline obviously with the increment of La or Ba-doping content. According to Eq. (1), the donor density of the corrosion film increases gradually with the increment of La or Ba content, which indicating the increased number of point defect in the corrosion film [9, 30]. The increased point defects density will benefit the conductivity of corrosion films and so much so that the long-term depth discharge performance of the lead acid energy storage battery improved because the point defect in the anodic films can act as the charge carrier.
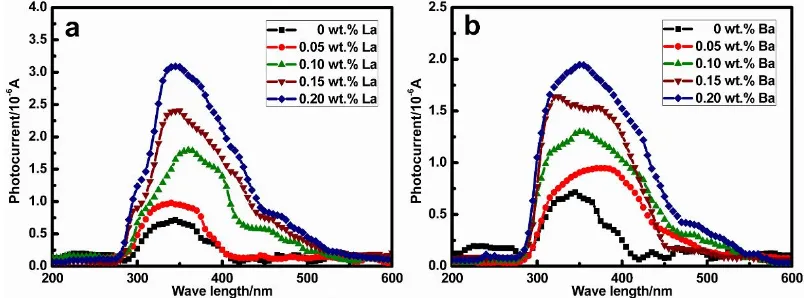
For the in situ anodic films formed the surface of metals and alloys, photo-electrochemical analysis is an effective analysis often used to investigate their semi-conductive properties. Fig.7 shows the variation of photocurrent and the wavelength of incident light with +300 mV applied potential [9, 30]. It can be seen that the photocurrent has a tendency to increase obviously with increasing the wavelength, when the wavelength of incident light is less than 350nm. The maximum of the photocurrent appears when the incident wavelength arrives at about 350 nm, then the photocurrent decreases with continuing to increase wavelength. Meanwhile, the results indicate that the photocurrent intensity increases with the addition of La or Ba. The point defect within the anodic film can serve as the charge carrier, the electron jumps over the bandgap and passes into the conduction band of the corrosion film, and then the photocurrent occurs. The increasing photocurrent demonstrates the increment of point defect density in the anodic film, it is in agreement with the result of M-S plot [9, 30].
Figure 7. The photocurrent verse wave length plot of the anodic films on Pb-Ca-Sn-Al alloys with different La (a) and Ba (b).
EIS is employed to further studies on the electrochemical properties of corrosion products formed on the Pb-Ca-Sn-Al-La/Ba alloys. Fig.8 showed that the Nyquist plots of the corrosion products formed in the corrosion test on the Pb-Ca-Sn-Al-La/Ba alloys. In the Nyquist plots, the diameter of the depressed semicircle in the high-to-medium-frequency region corresponds to charge transfer resistance, while the sloping line in the low frequency region is assigned to Warburg impedance [20, 31]. The equivalent electron circuit showed in Fig.9 is used to fit the impedance spectra. As showed in Fig.9, R1 is the solution resistance, R2 is related to the transfer resistance, Q1
represents the capacitance of the double layer, R3 and Q2 are the resistance and capacitance of the
[image:10.596.96.498.378.527.2]
decreased. As the potential of 0.9V is in the growth potential region of PbO, the increment of R2 value
indicates the inhibited growth of PbO in the anodic film [30]. The decrement of R3 imply that the
conductivity of the anodic film enhances. The decrement of capacitance Q2 indicates a more compact
anodic film, then it can be concluded that the micro-channel within PbO1+x/PbSO4 film decreases with
increasing La or Ba content [9]. That means the compact anodic film of Pb-Ca-Sn-Al-La/Ba alloys can protect the substrate lead of the alloys from corrosion by the H2SO4 electrolyte [6].
Figure 8. The Nyquist plots of the passive films on the Pb-Ca-Sn-Al alloy electrodes with different amounts of La (a) and Ba (b).
Figure 9. The equivalent electron circuit used to fit the impedance spectra showed in Figure 8.
Table 5. The fitted results of the impedance spectra of the passive films on the Pb-Ca-Sn-Al-La/Ba alloys
Alloys R1/Ω
cm2
R2/Ω
cm2
C1/F
cm2
R3/Ω
cm2
C2/F
cm2
W/Ω s -1/2
0wt.%La 4.276 4.63
2.19E-06
14.16 5.71E-05
93.11 0.05wt.%La 4.406 8.50 2.04
E-06
13.06 1.15 E-05
93.38 0.10wt.%La 4.335 8.78 1.97
E-06
12.9 9.38 E-06
100.1 0.15wt.%La 4.053 8.96 1.96
E-06
12.83 8.99 E-06
100.5 0.20wt.%La 3.903 20.83 7.42
E-06
12.04 1.67 E-06
141.2 0.05wt.%Ba 4.798 7.84 1.93
E-06
13.75 1.08 E-05
18.09 0.10wt.%Ba 6.440 9.08 1.41
E-06
13.16 4.25 E-05
82.25 0.15wt.%Ba 5.159 9.89 1.00
E-06
13.01 6.92 E-05
[image:11.596.103.493.191.345.2] [image:11.596.219.374.390.440.2] [image:11.596.99.498.514.769.2]
0.20wt.%Ba 5.889 10.23 7.44 E-07
12.36 1.14 E-05
[image:12.596.98.499.68.285.2]73.60
[image:12.596.96.498.344.495.2]Figure 10. LSV of Pb-Ca-Sn-Al alloy electrodes with different amounts of La (a) and Ba (b) in1.28 g cm−3 H2SO4.
Figure 11. Tafel plots of oxygen evolution on Pb-Ca-Sn-Al alloy electrodes with different amounts of La (a) and Ba (b).
Table 6. Kinetic parameters of the oxygen evolution reaction on Pb-Ca-Sn-Al alloy electrodes with different amounts of La/Ba.
Alloys a/V b R
[image:12.596.175.423.592.751.2]
For the sake of research on the behavior of oxygen evolution of the alloys, the anodic polarization curves were recorded by linear sweep voltammetry (LSV) after corrosion test in 1.28 g cm−3 sulfuric acid solution [22]. The LSV results and corresponding Tafel plots are shown in Fig. 10 and Fig. 11, separately. The kinetic parameters of Tafel plots are listed in Table 6. It can be seen that the over potential of oxygen evolution on the Ca-Sn-Al-La/Ba electrodes is higher than that on Pb-Ca-Sn-Al electrode. It can be seen that the a value of Pb-Ca-Sn-Al-0.10 wt.% Ba alloy is greater than other alloy electrodes. This indicates that the Ba in the alloys effectually relieves the oxygen evolution reaction.
4. CONCLUSIONS
We have demonstrated the deep recycle property of Pb-Ca-Sn-Al-La/Ba alloys that simultaneously addresses the corrosion resistance, conductivity of anodic film, and oxygen evolution issues to promote the properties of the positive grids in lead acid energy storage batteries. Corrosion resistance property has been implemented by CV approach and the concentration of Pb2+ in the mixture solution (acetic acid, nitric acid and hydrogen peroxide) are measured by ICP-AES after corrosion test for the first time. The addition of the La and Ba can improve the corrosion resistance of Pb-Ca-Sn-Al alloy and electrochemical property of the anodic films in sulfuric acid solution. Additionally, the addition of La or Ba can decrease the oxygen evolution of alloy electrodes in sulfuric acid. This discovery opens a path for employing multicomponent positive grid materials with rationally designed structures and functions to improve lead acid energy storage batteries.
ACKNOWLEDGEMENTS
This work was supported by the Key Laboratory of Electrochemical Energy Storage Technology of Jiangsu Province Project (No. BM2016027).
References
1. A. Moncada, M.C. Mistretta, S. Randazzo, S. Piazza, C. Sunseri and R. Inguanta, J. Power Sources, 256 (2014) 72.
2. D. Pavlov, Lead-acid batteries: science and technology, Elsevier, (2011) Amsterdam, Netherlands. 3. S. Yang, R. Li, X. Cai, K. Xue, B. Yang, X. Hu and C. Dai, J. Electrochem. Soc., 164 (2017) A1. 4. K. Ji, C. Xu, H. Zhao and Z. Dai, J. Power Sources, 248 (2014) 307.
5. J. Furukawa, Y. Nehyo and S. Shiga, J. Power Sources, 133 (2004) 25.
6. W. Guo, D. Shu, H. Chen, A. Li, H. Wang, G. Xiao, C. Dou, S. Peng, W. Wei, W. Zhang, H. Zhou and S. Chen, J. Alloys Compd., 475 (2009) 102.
7. W. Zhang, A. Li, H. Chen, B. Lan, K. Pan, T. Zhang, M. Fang, S. Liu and W. Zhang, J. Power Sources, 203 (2012) 145.
8. H. Li, W. Guo, H. Chen, D. Finlow, H. Zhou, C. Dou, G. Xiao, S. Peng, W. Wei and H. Wang, J. Power Sources, 191 (2009) 111.
9. D.G. Li, J.D. Wang and D.R. Chen, J. Power Sources, 210 (2012) 163. 10.A. Tizpar and Z. Ghasemi, Appl. Surf. Sci., 252 (2006) 7801.
12.E. Jullian, L. Albert and J.L. Caillerie, J. Power Sources, 116 (2003) 185. 13.L. Albert, A. Goguelin and E. Jullian, J. Power Sources, 78 (1999) 23.
14.L.A. Yolshina , V.A. Yolshina , A.N. Yolshin and S.V. Plaksin, J. Power Sources, 278 (2015) 87. 15.D. Pavlov, B. Monakhov, M. Maja and N. Penazzi, J. Electrochem. Soc., 136 (1989) 27.
16.J.L. Caillerie and L. Albert, J. Power Sources, 67 (1997) 279.
17.C. Brissaud, G. Reumont, J.P. Smaha and J. Foct, J. Power Sources, 64 (1997) 117. 18.A.F. Hollenkamp, J. Power Sources, 59 (1996) 87.
19.D.G. Li, G.S. Zhou, J. Zhang and M.S. Zheng, Electrochim. Acta, 52 (2007) 2146. 20.M.L. Yan and Z.W. Zhou, J. Power Sources, 195 (2010) 631.
21.H.T. Liu, J. Yang, H.H. Liang, J.H. Zhuang and W.F. Zhou, J. Power Sources, 93(2001) 230. 22.A. Li, Y. Cheni, H. Chen, D. Shu, W. Li, H. Wang, C. Dou, W. Zhang and S. Chen, J. Power
Sources, 189 (2009) 1204.
23.W. Zhang, A. Li, H. Chen, B. Lan, K. Pan, T. Zhang, M. Fang, S. Liu and W. Zhang, J. Power Sources, 203 (2012) 145.
24.H.Y. Chen, S. Li, A.J. Li, D. Shu, W.S. Li, C.L. Dou, Q. Wang, G.M. Xiao, S.G. Peng, S. Chen, W. Zhang and H. Wang, J. Power Sources, 168 (2007) 79.
25.S. P. Ali, M. M. Aghili and A. Davoodi, J. Alloys Compd., 652 (2015) 172.
26.R.K. Shervedani, A.Z. Isfahani, R. Khodavisy and A.H. Mehrjardi, J. Power Sources, 164 (2007) 890.
27.W.X. Guo, D. Shu, H.Y. Chen, A.J. Li, H. Wang, G.M. Xiao,C.L. Dou, S.G. Peng, W.W. Wei, W. Zhang, H.W. Zhou and S. Chen, J. Alloys Compd., 475 (2009) 102.
28.R.H. Wilson, J. Appl. Phys., 48 (1977) 4292. 29.J.F. Dewald, J. Phys. Chem. Solids, 14 (1960) 155.
30. D.G. Li, J.D. Wang and D.R. Chen, J. Power Sources, 235 (2013) 202.
31. P. Xiao, F. Bu, G. Yang, Y. Zhang and Y. Xu, Adv. Mater., 29 (2017) 1703324.