Evaluation of PV technology implementation in the building sector
J.J. Bloem and A. Colli
EC DG Joint Research Centre, Renewable Energies, Ispra, Italy
P. Strachan
ESRU, University of Strathclyde, Glasgow, UK
ABSTRACT
This paper presents a simulation case that shows the impact on energy consumption of a building applying photovoltaic shading systems. In order to make photovoltaic application more eco-nomical, the effect of a photovoltaic facade as a passive cooling system can result in a consider-able energy cost reduction, with positive influ-ence on the payback time of the photovoltaic installation. Photovoltaic shading systems can be applied to both refurbishment of old build-ings and to new-build, offering attractive and environmentally integrated architectural solu-tions.
The economic situation has allowed people to improve the comfort level in their buildings. Increased numbers of air conditioning systems are being sold, leading to increased energy con-sumption, in particular during a few summer months. Power plants have difficulty with deliv-ering the electricity during high peak power demand in summer, which has resulted, for ex-ample, in more than one blackout in Italy.
An energy cost evaluation applying different electricity tariffs for the building sector shows a consistent difference in the annual bill when photovoltaic devices are deployed. In particular, for the summer period a significant reduction in the air-conditioning energy consumption can be achieved (Bloem and Colli, 2003) and in some cases, dependent on the architecture of the building, a reduction of the lighting load is pos-sible too.
Photovoltaic technology could be an interest-ing option for buildinterest-ing and urban designers to cope with the problem of reducing peak de-mand. Renewable energy technology in general has political importance, being a clean form of
energy (EC, 2001). The application of photo-voltaic technology allows energy-conscious construction of energy-efficient and sustainable buildings provided that it is supported by poli-tics through national regulations. Photovoltaic technology can produce the energy where and how it is needed and its orientation can be opti-mised in such a way that it can reduce summer peak demand of electricity.
1. INTRODUCTION
1.1 Renewable energies, passive and low energy buildings
Considering renewable energy technologies for integration in the built environment, solar en-ergy technologies are the most likely to be ap-plied at a much larger scale than presently is the case. Market sales expectation figures from in-dustrial network organisations EPIA and ESTIF indicate a growth from 0.5 GWp (2002) to 3.6
GWp (2010) for grid connected installed PV and
a growth from 10 Mm2 (2002) to 100 Mm2 (2010) for solar thermal systems. Solar thermal is quite a success in countries such as Greece, Austria and Germany, whereas photovoltaic technology is well on its way in Germany, Swit-zerland, the Netherlands and Spain. National and regional incentive schemes have been the basis for this growth and the evidence suggests that governmental direction rather than climate is the main driving force.
The building should be considered as one entity that consumes energy to provide the required comfort to work and live in. A reduction of en-ergy consumption therefore should take into ac-count the passive as well as the active aspects of energy consumption, saving and production. However, most of the present regulations deal with components of the building by minimizing the energy needs to maintain a level of comfort, such as by limiting the maximum thermal heat loss through the building envelope (insulation, ventilation, etc.). The building envelope could also be designed to provide useful energy for daily use. The integrated approach has demon-strated in the past that energy reduction should not be the only objective. Other aspects such as safety, comfort and health are important aspects.
2. PV BUILDING INTEGRATION
2.1 Solar energy integration in the built envi-ronment
Renewable energy technology in general has political importance, being a clean form of en-ergy. A number of advantages can be noted when building integrated photovoltaic (BIPV) technology is considered. The design of the products allows their treatment as building con-struction products, which can be integrated as façade or roof installations in the building con-struction (Fig. 1). The photovoltaic system can produce the energy where and how it is required and its orientation can be optimised in such a way that it can reduce the typical summer peak demand of electricity. PV becomes more eco-nomically interesting as an integrated option in the built environment when its multi-functionality is considered. Moreover, financial savings in shading devices, roofing materials, etc. should be taken into account as well.
Several examples of architectural PV integra-tion have been reported. In (Bear, 2002), 2 buildings of ECN in Petten, the Netherlands are presented. Overheating and inefficient lighting were the problem in the buildings. The situation has been improved by applying PV integrated elements in the envelope. The conclusion of that paper is the achievement of a better quality/cost ratio. Another good example is the Scientific Pole building in Sesto Fiorentino (Italy) in which case the architectural integrated PV
sys-tem offers shading and allows the air and light to pass into the building.
2.2 Integral energy performance assessment
The recommended approach starts from the in-tegral energy performance assessment concept. A given building has typical energy consump-tion expressed in kWh/(m2.year). Any change in the energy consuming components of the build-ing for the improvement of the buildbuild-ing comfort should not increase but lower this typical energy consumption and improve the overall energy performance of the building.
An integrated approach should be applied to an economic analysis too. This process is quite complicated (the unit to express cost perform-ance should not be in € only) but an attempt is made focussing on the integration of PV in the built environment. For the presented case the functionality of PV has been considered also as a building construction element, being a shading device. In general a shading device protects the building from overheating and glare. When a PV shading device is installed it will produce electricity as well. The economic analysis should provide not only electricity data that will contribute to a reduction in energy consumption of the building but also the contribution to the comfort level (in particular temperature and light). Overheating is currently handled by huge electricity consuming air-conditioners.
[image:2.595.251.441.82.233.2]Figure 2 shows the distribution of room air-conditioner units in Europe and the expectation for 2020, which is not so promising when it concerns reduction of energy demand in the building sector (Ecole des Mines).
2.3 Three Mediterranean countries
This paper will focus on Greece, Italy and Spain considering the integration of photovoltaic tech-nologies with respect to their climate, present incentive schemes and electricity prices. A comparison is made to the situation in Germany, the best-practice example when it concerns the market stimulation of photovoltaic technologies. The main parameters for an economic analysis are the solar irradiation, the present electricity price, the installation costs and the financial support mechanism.
2.4 Solar irradiation
Daily, monthly and yearly (Fig. 3, Table 1) val-ues of solar global irradiance for a 45 degree tilted surface facing south (JRC, 2004) have been applied in the calculation for all cases.
2.5 National electricity prices
Electricity prices with taxes for household ref-erence consumers class Dc and Dd, are 3.5 MWh and 7.5 MWh maximum annual con-sumption (Eurostat, 2004) respectively (see Ta-ble 2). The feed-in tariffs are applicaTa-ble for PV-façade installations (See section 2.6 also).
Note that Greece has the lowest electricity price in Europe and that Italy is one of the most expensive and furthermore has a price structure that depends on the yearly consumption level.
2.6 National incentive schemes
From the Status Report 2004 (Jäger, 2004) the support mechanisms for photovoltaics leads to the conclusion that feed-in tariff based incentive schemes are the most likely to be in place in all European Member States in the near future. Some countries apply a capital incentive scheme for private domestic applications.
- Greece: feed-in tariff of 0.07 €/kWh; Law 2364/95 sets a reduction of 75% of the costs for purchase and installation of renewable energy systems in private buildings on tax-able income of final users.
- Italy: proposed feed-in tariff of 0.63 €/kWh for systems <20kWp (an additional 0.05 for façade integration); At present this is still an investment subsidy, but the feed-in law was passed in February ‘04 and probably will be in place in the course of 2005.
- Spain: feed-in tariff of 0.396 €/kWh for sys-tems <100kWp. Duration of payment 20 years.
- Germany: feed-in tariff of 0.574 €/kWh (an additional 0.05 for façade integration) for systems <30kWp. Duration of payment 20 years.
3. SIMULATION
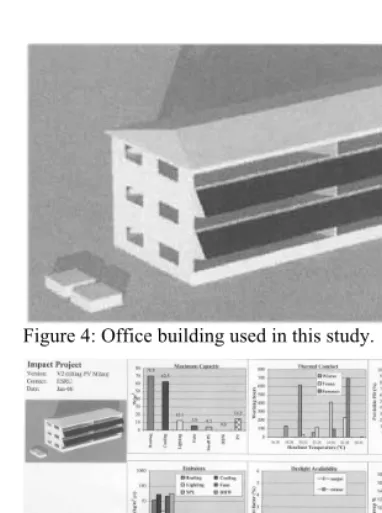
[image:3.595.49.231.87.200.2]A base case building (Fig. 4) was modeled in Figure 2: Evolution of the total cooled area in Europe
between 2000 and 2020.
Figure 3. Yearly global horizontal irradiation. See also http://re.jrc.cec.eu.int/pvgis
Table 1: The locations considered.
45° Global irradiance July [kWh/m2/day]
[image:3.595.249.438.98.254.2]Germany (Münich) 5.0 Greece (Athens) 6.0 Italy (Milan) 5.6 Spain (Barcelona) 5.9 Table 2: National electricity prices and feed-in tariff.
Dc, [€/kWh]
Dd, [€/kWh]
[image:3.595.43.235.230.311.2]ESP-r (ESRU), an integrated modelling tool for the simulation of the thermal, visual and acous-tic performance of buildings and the assessment of the energy use and gaseous emissions associ-ated with the environmental control systems and constructional materials. In undertaking its as-sessments, the system is equipped to model heat, air, moisture and electrical power flows at user-determined resolution.
To be consistent with the integrated design approach, results of modelling for performance evaluation also need to be placed in context. In-stead of evaluating the performance of PV mod-ules in isolation, their overall impact on the thermal, ventilation, day lighting and electrical performance aspects of the building needs to be considered.
One way of achieving this is through the use of an "Integrated Performance View" (IPV, see Fig. 5), which displays many performance met-rics in a concise way. Design options can then be compared across all aspects of performance.
The applied model is for a speculative office development (Bloem et al., 2004). Note that constructions and occupancy levels etc. have not been changed from one country to another,
al-though lighting loads will change because lights are switched on the basis of 300 lux on the working plane. The base case model was simu-lated using climate datasets for Athens (Greece), Barcelona (Spain) and Milan (Italy). Several options for adding PV modules were studied. The base case model was modified by adding 99 PV modules mounted in a horizontal spandrel enclosure on the south façade. Natural ventila-tion was assumed in the module enclosure via grills in the upper and lower surfaces. Simula-tions were repeated for the three climates.
The model results are for 4 other cases, the horizontal and vertical PV facades, and the ver-tical facades with mechanical ventilation at 2 ac/h and 10 ac/h. The mechanical ventilation options involve pre-heating the air (and cooling the modules), which is supplied to the building. In practice, this would not be done for Mediter-ranean summer days because of the resulting increased cooling loads. Better control should be applied in the simulations to switch the venti-lation air according to the relative internal and external temperatures. For the annual energy consumption of the building the results of Ta-ble 3 are derived.
It was concluded from the simulation study that the results for the cases with the horizontal PV spandrel and vertical facades with natural or mechanical ventilation at 2 ac/h, are within 5%. The power produced by the PV can be a useful contributor to the building’s energy demands. A manually adjustable shading device, to optimise the PV elements seasonal inclination, would give further improvements to the PV electricity contribution of 50 – 60% (Bloem et al., 2004).
4. ECONOMIC ANALYSIS RESULTS
[image:4.595.43.234.84.341.2]The economics of photovoltaic installations are crucial in influencing the market penetration of solar energy on a large scale. To improve the Figure 4: Office building used in this study.
[image:4.595.250.438.95.175.2]Figure 5: Example of an IPV.
Table 3: Main results from simulation
Climate
PV spandrel, naturally ventilated
(kWh/m2 /yr)
Building total energy use (kWh/m2 /yr)
Milan 13.21 145.5
Athens 14.76 130.6
diffusion of solar energy in general and BIPV systems in particular, incentives are the only way to reduce PV system installation price. In-centives can be in “energy account” or in “capi-tal account”. Note that 16 out of 25 Member States have already introduced feed-in tariffs. The price for installed peak power is different in the countries that were studied, ranging from 7500 to 5500 €/kWp (2004). It is expected that
with increasing production capacity the price will decrease drastically (Jäger, 2004).
4.1 Net-metering
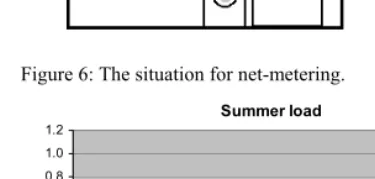
Two strategies are studied and presented in this paper. The first strategy is based on the reduc-tion of the daily energy consumption and is in particular interesting for private house owners, because of low investments. It requires a small PV installation that produces not more than the minimum electricity consumption during a sunny day. This ‘net-metering’ situation does not require a second metering system. It is illus-trated in Figure 6.
The load curve is taken from the EURECO
project (Eureco, 2002) and includes: lighting, audiovisual and computer apparatus, cold appli-ances, washing machines and dishwashers, elec-tric water heaters and room air-conditioners. Note that Greece, Italy and Spain have by far the highest cooled areas in Europe (Fig. 2).
From this report the average annual con-sumption for a household in the Mediterranean countries is calculated as 3.1 MWh/year and when air-conditioning is included, 4.8 MWh/year. The total daily load is 15.5 kWh/day and the average electricity consumption is about 600Wh during the average day (2001 situation). In the economic analysis calculation therefore, a 600Wp PV installation is considered.
4.2 PV-metering
The second strategy is based on the annual elec-tricity consumption and a PV installation that produces not more than 90% of this annual con-sumption (it is derived from the present capital incentive in Italy). This situation requires a sec-ond metering system because the owner is con-sidered an electricity producer and eligible to receive a feed-in tariff for every kWh delivered into the grid. Figure 8 illustrates this situation.
It is common practice to express the results from economic analysis in payback time, ex-pressed in years, being the investment divided by the earnings per year on the installation. This has been applied to both strategies described above. The present electricity prices have been applied for the 600Wp net-metering case and
installation costs of 5500€/kWp. Tables 4 and 5
[image:5.595.59.217.89.217.2]give a brief overview of the calculation results. A feed-in tariff for facades of 0.624€/kWh Figure 6: The situation for net-metering.
Summer load
0.0 0.2 0.4 0.6 0.8 1.0 1.2
1 3 5 7 9
1
1
1
3
1
5
1
7
1
9
2
1
2
3
Hours
k
W
h
/h
Genaral Water heater Air conditioner
[image:5.595.259.422.90.216.2]Figure 7: Average hourly load curve for Summer (June to September).
[image:5.595.44.232.242.332.2]has been applied for the PV metering case. This is uncertain, in particular for Greece, but the au-thors would like to compare the best practice example of Germany.
Assuming a feed-in tariff of 0.45€/kWh for Greece, the payback time would be similar to the German situation. Analysis results for PV installations of 2.5kWp show similar payback
times. The house owners have become, on a daily basis, true electricity producers.
5. CONCLUSION
Integration of photovoltaic technology in the built environment shows opportunities to reduce the energy consumption of the building. The feed-in tariff is successful for studied cases of private installations above 1 kWp, in particular
when it is linked to cases including air-conditioning systems. A ‘capital incentive’ would be a good solution to bring down peak power demand and low investment cases. To satisfy politicians, building owners (cost effec-tiveness) and occupants (indoor climate condi-tions) a fully integrated approach is considered to be the most sensible approach.
REFERENCES
Bear, 2002. Reijenga T. PV-integration in solar shading (renovation) and PV-integration in atrium glazing (new building) ECN 31 and 42 –Petten (NL).
Bloem, J.J., P.H. Baker and P.A. Strachan, 2004. Energy Performance of Buildings and the Integration of Photovoltaics. EECB Conference, Frankfurt.
Bloem, J.J. and A. Colli, 2003. Effect of incentive schemes on integration of photovoltaic in the residen-tial built environment. EEDAL’03 Conference. Torino EC, 2001. DIRECTIVE 2001/77/EC Promotion of
elec-tricity produced from Renewable Energy Sources in the internal electricity market.
Ecole des Mines, Marchio D., High efficiency and low environmental impact conditioning systems; air-conditioning key figures; Ecole des Mines de Paris. ESRU, ESP-r System, http://www.esru.strath.ac.uk Eureco, 2002. End-use metering campaign in 400
house-holds of the European Union, SAVE Programme Con-tract n° 4 1031/Z/98-267
EUROSTAT Pocketbook, 2004. Energy, Transport and Environment Indicators, Edition 2004, EC, ISBN 92-894-7529-3, Luxembourg.
Jäger-Waldau, A., (ed.), 2004. Status Report 2004; En-ergy End-use Efficiency and Electricity from Biomass, Wind and Photovoltaics in the European Union. EUR 21297 EN.
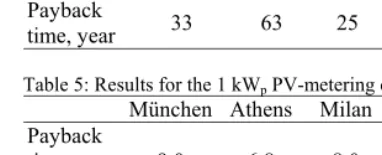
[image:6.595.45.233.94.168.2]JRC, 2004. http://iamest.jrc.it/pvgis/pv/imaps/imaps.htm Table 4: Results for the 600 Wp net-metering case.
München Athens Milan Barcelona
Electricity
Price, € 0.1698 0.0671 0.195 0.1079 Annual
saving, % 12.1 15.9 13.5 16.2
Payback
time, year 33 63 25 39
Table 5: Results for the 1 kWp PV-metering case.
München Athens Milan Barcelona
Payback time, year 5.5 €/Wp
9.0 6.8 8.0 6.2
Payback time, year 7.0 €/Wp
[image:6.595.43.234.182.259.2]