Int. J. Electrochem. Sci., 12 (2017) 7300 – 7311, doi: 10.20964/2017.08.59
International Journal of
ELECTROCHEMICAL
SCIENCE
www.electrochemsci.orgCorrosion Behavior of Al–Mg–Zn-Si Alloy Matrix Composites
Reinforced with Y
₂
O
₃
in 3.5% NaCl Solution
O. R. Perez1, S. Valdez2, A. Molina1, S. Mejia-Sintillo1, C. Garcia-Perez1 V. M. Salinas-Bravo3, J.G. Gonzalez-Rodriguez1,*
1
Universidad Autónoma del Estado de Morelos-CIICAp, Av. Universidad 1001, Col. Chamilpa, 62210, Cuernavaca, Morelos, México.
2
Instituto de Ciencias Físicas-UNAM, Av. Universidad 1001, Col. Chamilpa, 062210, Cuernavaca, Morelos, México.
3
Instituto de Electricidad y Energias Renovables, Av. Reforma 120, Temixco, Mor., Mexico *
E-mail: [email protected]
Received: 5 May 2017 / Accepted: 12 June 2017 / Published: 12 July 2017
The corrosion behavior of the Al-Mg-Zn-Si composite reinforced with Y₂O₃ particles and the unreinforced Al-Mg-Zn-Si alloy was studied through electrochemical and surface analysis techniques. The samples were manufactured by the Mechanical alloying (MA) technique and were heat treated at 350 ˚C, 400 ˚C and 500 ˚C during 60 min followed by water quenching. The corrosion behavior of the samples was investigated in 3.5 wt.% NaCl by using electrochemical methods such as poteniodynamic polarization curves, linear polarization resistance and electrochemical impedance spectroscopy measurements. In the as-received condition the corrosion resistance for base alloy was lower than the composite, however, when composite was heat treated, its corrosion résistance was higher than that for base alloy, but it was susceptible to localized type of corrosion at the matrix/ Y₂O₃ particles interface.
Keywords: Aluminum-based composites, corrosion, electrochemical techniques.
1. INTRODUCTION
aluminum alloys matrix [2]. Particles can be either conventional coarse grained or ceramic nano-particles, although the later have received great attention owing to their property advantages [3]. Aluminum matrix composites (AMCs) reinforced with particulates reinforced have been used in applications in aerospace, military and transportation industries due to their excellent properties [4]. By fabricating AMCs a unique combination of mechanical, physical and chemical properties can be obtained which is very difficult to achieve with the use of monolithic materials [5-7].
Aluminum based metal matrix composites have been regarded as excellent candidates for application as structural materials due to the strength to weight ratio because they represent major improvements and alternatives for the automotive, aerospace, railway, shipbuilding and construction industries [8-10]. Aluminum matrix composites (AMCs) are being used in widespread applications due to their high specific strength, lightweight, good wear and corrosion resistance and other features beneficial to superior performance [11-12]. The main applications include the manufacture of gears, pump rotors, porous materials such as metal filters, in addition to a wide variety of parts in the automotive industry, such as piston rings, connecting rods and hydraulic pistons. Also, the addition of Mg, Zn and Si into Al matrix improves the mechanical properties caused by solid solution and age hardening [13]. The relatively low cost of AMCs processing is another advantages over other matrices types such as Magnesium (Mg), Copper (Cu), Titanium (Ti), Zinc (Zn) [14,15], which, together with excellent combination of material properties, ease processing, reduced cost, and accommodation of waste materials, has made them very attractive.
Carbides, oxides, nitrides and some intermetallic compounds have been extensively applied as reinforcing particulates for composites. Many reinforcement such as TiC, SiC, Al₂O₃, Graphite, Ashes, etc. have been used by different authors [16-19] to fabricate AMCs. These reinforcements are the ceramic material with melting points higher than 2500°C as compared to aluminum alloys. For example yttrium oxide has characteristics that are not found in metallic or organic materials, including chemical resistance, high temperature stability, high hardness and high mechanical strength. However, the addition of the reinforcement particles could significantly alter the corrosion behavior of these materials. The addition of the reinforcement particles could lead to further flaws or discontinuities in the protective film, increasing the sites for corrosion initiation.
2. EXPERIMENTAL PROCEDURE
2.1. Synthesis of the composite
[image:3.596.44.554.464.551.2]Mixture of Al, Mg, Zn, Si and Y₂O₃ powders was applied for the fabrication of Al-base composite reinforced with 3 % wt. Y2O3 by mechanical alloying (MA) technique. The Y₂O₃ particles had a purity of 99.7% and an average particle size of 12 μm. The MA was performed at room temperature in a planetary high-energy two stations ball mill (Fritsch–P7) with the following parameters: ball to powder weight ratio: 3:1; ball diameter 10 mm; ball and vial material: hardened stainless steel; the mixture was then milled for 20 hours at a rotation speed of 280 rpm, under an argon atmosphere to avoid oxidation of the powders. Ethanol (2 ml) was used as a process control agent (PCA). Two materials were tested, Al-base alloy and a composite wtih a chemical composition as given in table 1. The milled powders obtained by MA were biaxial compacted at room temperature by using biaxial cylindrical steel die at a pressure of 15 Ton. The post-compacts were sintered at 400 °C for 18 h. The samples were heat treated in an electric furnace at 350 ˚C, 400 ˚C and 500 ˚C during 60 min followed by water quenching. Microscopic characterization of specimens was carried out by using a low vacuum Scanning electronic microscope (SEM) LEO 145 0 VP. For this, specimens were mounted in a polymeric resin, abraded with emerging paper, and then polished with 3.0 micron Alumina (Al2O3) paste. Materials designation includes a letter, “A” or “C”, for the Al-base alloy or composite respectively, followed by the numbers 350, 400 or 500 indicating the temperature at which they were heat treated.
Table 1.Chemical composition of tested materials (wt. %)
Specimen designation
Al Mg Zn Si Al2O3
Base alloy 87 6.2 3.7 3 ---
Composite 84.4 6.0 3.6 3.0 3.0
2.2. Corrosion tests
and then polarized towards the anodic direction up to +1500 mV. Linear polarization resistance measurements (LPR) were carried out by polarizing specimens from -10 to +10 mV around the value, Ecorr, at a scan rate of 1 mV/s. Tafel extrapolation method was used to obtain corrosion current density values, Icorr. Tests lasted 24 hours. In order to know the corrosion mechanisms, some electrochemical impedance spectroscopy experiments were performed. For this, a signal with an amplitude of 10 mV was applied at Ecorr in the interval of frequencies of 0.1-100KHz. A model PC4 300 Gamry potentiostat was used for this. Corroded surfaces of both the base alloy and composite were established by scanning electron microscopy (SEM) LEO 145 0 VP (15kV).
3. RESULTS AND DISCUSSION
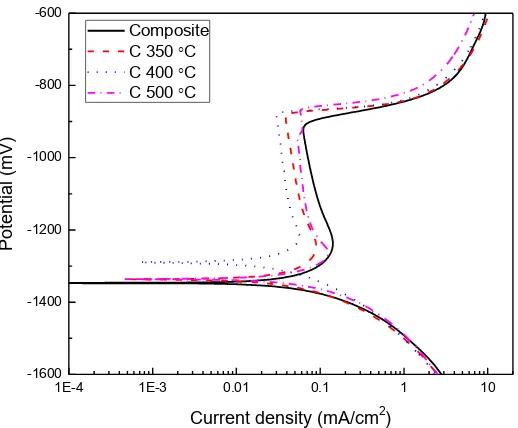
The effect of heat treatment in the polarization curves for Al-base alloy is given in Fig. 1.
Figure 1. Effect of heat treatment on polarization curves for Al- base alloy in 3.5 % NaCl solution.
It can be seen that curves display an active-passive behavior, with a passive zone which starts around -1200 mV and finishes when a pitting potential value, Epit, was reached, around -890 mV. The free corrosion potential value, Ecorr, was shifted towards more active values with the heat treatment, table 2, reaching its lowest value when the specimen was heat treated at 350 0C, indicating a higher susceptibility to be corroded.
The Icorr value increased with the heat treatment, obtaining the highest value for the specimen heat treated at 350 0C. The passive current density value, Ipas, measured at a fixed potential value, i.e. -1000 mV, also increased for the heat treated specimens, reaching its highest value for specimen treated at 350 0C. Finally, the Epit shifted towards slightly nobler values for the heat treated specimens, since the specimen without heat treatment had an Epit value of -895 mV, whereas that for specimen heat treated at 500 0C was -855 mV.
1E-4 1E-3 0.01 0.1 1 10
-1600 -1400 -1200 -1000 -800 -600
P
o
te
n
tial
(mV
)
Current density (mA/cm2)
Table 2. Electrochemical parameters obtained from polarization curves.
Sample designation
Ecorr (mV)
Icorr (A/cm2)
Ipas (A/cm2)
Epit (mV)
Al-base alloy -1,300 65 40 -895
A350 -1,352 80 70 -888
A400 -1,327 90 60 -875
A500 -1,318 80 40 -855
Composite -1,348 75 70 -915
C350 -1,336 55 40 -885
C400 -1,289 35 30 -875
C500 -1,337 70 60 -865
Figure 2. Effect of heat treatment on polarization curves for Al-base composite in 3.5 % NaCl solution
Thus, heat treatment made the alloy slightly more resistant to pitting corrosion. It has been shown [25] that for Al-Mag alloys, the passive layer is formed by both aluminum and magnesium-containing alloys, where magnesium has been observed to be segregated in the surface oxides. At room temperature, this oxide layer is made mainly of aluminum oxide, Al2O3, which is very protective, but with an increment in the temperature, the role of magnesium oxide, MgO, becomes more important due to a faster outwards diffusion of the magnesium cations as that compared with the Al3+ ions leading to the formation of MgO crystals at the surface of the oxide. For temperatures higher than 500 0
C and as time elapses, a spinel such as (MgAl2O4) is formed making the surface rougher, decreasing the protection given by the Al2O3 layer [26, 27].
Polarization curves for Al-base composite at different heat treatments are given in Fig. 2. Polarization curves display still an active-passive behavior. The Ecorr and Epit values for composite were slightly more active than those for the alloy, table 1, with a higher passive current density value. When the composite was heat treated, the Ecorr value shifted towards nobler values and the corrosion
1E-4 1E-3 0.01 0.1 1 10
-1600 -1400 -1200 -1000 -800 -600
P
o
te
n
tial
(mV
)
Current density (mA/cm2)
Composite C 350 C
[image:6.596.144.402.225.431.2]
current density value decreased. The corrosion and passive current density values decreased also with the heat treatment, obtaining lowest values for specimen heat treated at 400 0C, whereas the pitting corrosion resistance increased, since the Epit value increased from -915 for composite without heat treatment, up to -865 mV for composite heat treated at 500 0C. In general terms, it can be seen in table 2, that composites had lower corrosion and passive current density values than the corresponding base alloy unlike the results reported for Al-based alloy reinforced with SiC particles in hydrochloric acid [28] or with rice husk ash (RHA) and silicon carbide particles in 3.% NaCl solution [29].
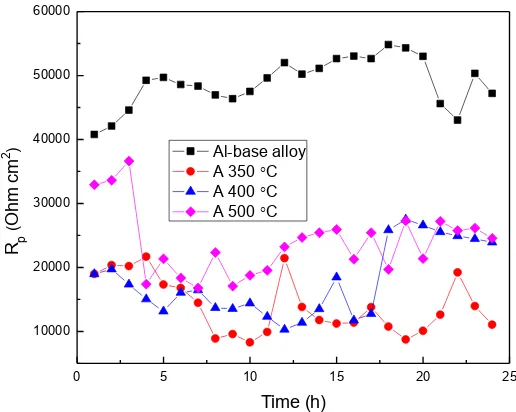
Figure 3. Effect of heat treatment on the change in the Rp value with time for Al-base alloy in 3.5 % NaCl solution.
In order to have a better understanding on the effect of heat treatment on a long time corrosion behavior for both Al-base alloy and composite, some LPR tests were carried out during 24 hours. The effect of heat treatment on the variation of the polarization resistance value, Rp, for Al-base alloy is shown in Fig. 3. It can be seen that the Rp value for alloy without heat treatment increases as time elapses, starting with a value of 40,000 ohm cm2, and finalizing with a value around 50,000 ohm cm2 after 24 hours of exposure to the corrosive solution. This increase in the Rp value is due to an increase in thickness of the film, probably Al2O3 + MgO, layer which protects the alloy. However, when the alloy is heat treated, the Rp value drops rapidly down to values between 10,000 and 25,000 ohm cm2, decreasing the corrosion resistance of the alloy. As explained above, this decrease in the corrosion resistance can be due to the presence of magnesium-containing oxides, such as MgO and the MgAl2O4 spinel, less corrosion resistance than the Al2O3 layer. Thus, these results confirm the results given by the polarization curves above that by heat treating the Al-base alloy its corrosion resistance is lowered. At room temperature, the corrosion resistance of Al-base alloys is based on an Al2O3 layer which covers the surface alloy and protects it again st corrosion. When the alloy is heated, atoms from micro alloying elements diffuse faster. This diffusion can have beneficial or detrimental effects like grain
0 5 10 15 20 25
10000 20000 30000 40000 50000 60000
Rp
(
Oh
m
cm
2 )
Time (h)
coarsening, depletion of some beneficial elements in localized places, formation of new phases, etc… Migration of Mg towards the external surface also increases with the temperature, producing the formation of crystals of MgO at the surface of the Al2O3 layer oxide, which produces the disruption of this protective oxide, decreasing the alloy corrosion resistance. As the temperature increases up to 500 0
C, the formation of a spinel such as MgAl2O4 is enhanced, which is less protective than the Al2O3 oxide, with a further decrease in the alloy corrosion resistance.
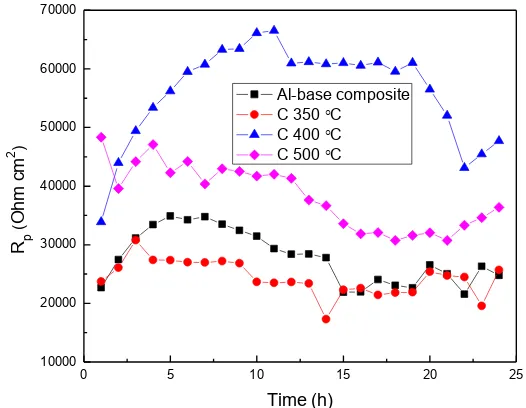
[image:7.596.155.418.472.676.2]On the other hand, the effect of heat treatment on the change of the Rp value with time for the Al-base composite, given in Fig. 4, shows that although during the first hour of testing the heat treated composites had lower Rp values than the composite without heat treatment. After a few hours of testing, the Rp value for composite heat treated at 400 0C increased as time elapsed, but after 10 hours of testing, this value dropped, remaining above all the Rp values for the rest of the composites. It is very well known that localized corrosion can start in heterogeneities such as reinforcement/matrix interface, defect, intermetallic, mechanically damaged region, grain boundary, inclusion, or dislocation AMCs [22, 28-33]. It has been reported that in an Al-Zn-Mg alloy, found phases were of the Mg-Zn type which can act as local cathodes for corrosion of the surrounding matrix to occur. In addition to this, Y2O3 particles can act as sites where the protective Al2O3 oxide can be disrupted and increase the corrosion rate or pits will nucleate. Also, Rare earth elements such as Yttrium improve the oxidation resistance by improving the external oxides adhesion to the underlying alloy. As temperature increases, there are are two processes occurring simultaneously, namely, the diffusion of Mg with the formation of crystals of MgO and MgAl2O4 spinel with their detrimental effects, as well the diffusion of Yttrium, wich is beneficial. The corrosion resistance of the composite will depend upon which of these two effects is the dominant.
Figure 4. Effect of heat treatment on the change in the Rp value with time for Al-base composite in 3.5 % NaCl solution.
0 5 10 15 20 25
10000 20000 30000 40000 50000 60000 70000
R p
(
Oh
m
cm
2 )
Time (h)
Al-base composite C 350 C
[image:8.596.151.399.254.452.2]
By heat treating the Al-base composite either at 350 or 500 0C reduced its corrosion resistance, since its Rp value decreased, obtaining the lowest Rp value for composite heat treated at 350 0C. A comparison of on the effect of heat treatment on the Rp value for both Al-base alloy and Al-base composite is shown in Fig. 5, where it can be seen that in the as-received condition, the Al-base alloy had a higher corrosion resistance than the composite. Similar results have been reported for Al 6063 alloy reinforced with SiC particles in 5% NaCl solution [22]. However, by heat treating the composite this was reverted, since all the heat treated composites had higher Rp values than those corresponding to their alloys, in such a way that the highest corrosion resistance was obtained for the Al-base composite heat treated at 400 0C.
Figure 5. Comparison of the effect of heat treatment on the change in the Rp values with time for Al-base alloy and composite in 3.5 % NaCl solution.
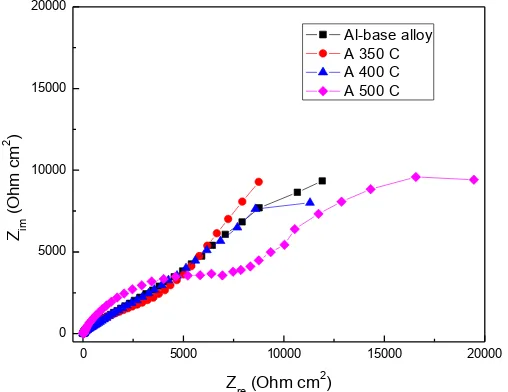
Figure 6. Effect of heat treatment on the Nyquist diagrams for Al-base alloy in 3.5 % NaCl solution.
0 2 4 6 8 10 12 14 16 18 20 22 24
10000 20000 30000 40000 50000 60000 70000
Rp
(
Oh
m c
m
2 )
Time (h)
Al-base alloy
Al-base composite
A-350 0C A-400 0C
A-500 0C C-350 0C
C-400 0C
C-500 0C
0 5000 10000 15000 20000
0 5000 10000 15000 20000
Zim
(
Oh
m c
m
2 )
Zre (Ohm cm2)
[image:8.596.170.424.531.727.2]
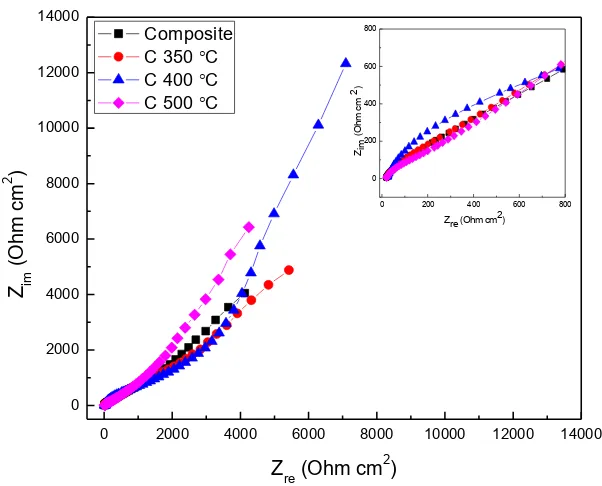
The effect of heat treatment on the Nyquist diagrams for Al-base alloy in 3.5 % NaCl is shown in Fig. 6. It can be seen that data display 2 depressed, capacitive-like semicircle, one at high frequencies, and a second one at intermediate and lower frequency values, indicating a charge transfer controlled corrosion process. The high frequency semicircle is related to the double electrochemical layer, whereas the second, low frequency semicircle is related to the passive layer formed on top of the alloy. The diameter of the high frequency semicircle corresponds to the charge transfer resistance, Rct, whereas the extrapolation of the Nyquist diagram towards the low frequency limit corresponds to the film or passive layer resistance, Rf. It can be seen that in all cases, regardless of the heat treatment, Rf values, i.e. the low frequency semicircle diameter, is higher than the Rct value (the high frequency semicircle) indicating that the alloy corrosion resistance is given by the outer, passive layer resistance, its protectiveness. If the protectiveness of this passive layer decreases, the underlying alloy corrosion resistance decreases. It as been explained above that at room temperature, this oxide layer is made mainly of aluminum oxide, Al2O3, which is very protective, but with an increment in the temperature, the role of magnesium oxide, MgO, or a spinel such as MgAl2O4 becomes more important, decreasing its protectiveness. On the other hand, Nyquist diagrams for and Al-base composite, Fig. 7, display a capacitive semicircle at high frequency values, followed by a straight line at lower and intermediate frequency values, indicating a diffusion-controlled corrosion process. This diffusion is due to the reactants diffusion from the bulk of the electrolyte through the outer passive layer, making more difficult the corrosion process.
Figure 7. Effect of heat treatment on the Nyquist diagrams for Al-base composite in 3.5 % NaCl solution.
0 2000 4000 6000 8000 10000 12000 14000
0 2000 4000 6000 8000 10000 12000 14000
0 200 400 600 800
0 200 400 600 800
Zre (Ohm cm2)
Zim
(
O
hm
c
m
2)
Z im
(
Oh
m c
m
2 )
Zre (Ohm cm2)
[image:9.596.131.432.432.675.2]
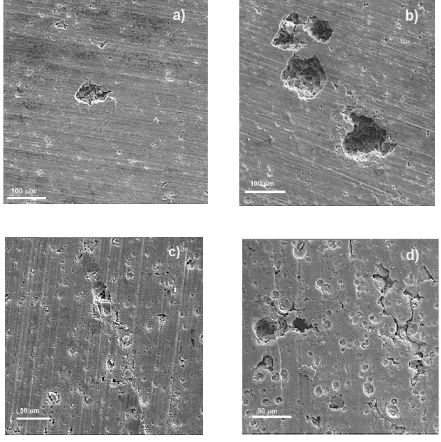
Some SEM micrographs of corroded Al-base alloy specimens are shown in Fig. 8, where it is evident that all samples suffered from a localized pitting type of corrosion, which is commonly found in these alloys [24-27]. On the other hand, for Al-base composites, Fig. 9, preferential anodic dissolution occurred on the matrix around the Y2O3 particles. The number of pits found in the Al-base alloy was lower and shallower than in the composite It is very well known that localized corrosion can start in heterogeneities such as reinforcement/matrix interface, defect, intermetallic, mechanically damaged region, grain boundary, inclusion, or dislocation AMCs [22, 28-33]. Some cracks can also be seen in the composite, which can act as crevices and places wher localized type of corrosion can take place.
[image:10.596.64.505.229.671.2]
There are two sources for the difference in electrochemical potentials within an alloy: i) a difference in the concentration of aggressive species, and ii) a difference in chemical composition between these heterogeneities and the matrix which is often more anodic [32]. For instance, Escalera-Lozano et al. [33] evaluated the corrosion behavior of recycled Al from cans reinforced with rice hull ash, which contains SiO2, in condensed moisture. The matrix had certain chemical composition whereas surrounding reinforcement particles had another chemical composition, causing micro galvanic cells between particles such as Mg2Si intermetallic compound, although other phases such as SiC, Si, MgAl2O4 could also work as micro cathodes with the matrix acting as anode. Pardo et al. [34] evaluated the effect of silicon carbide concentration on the corrosion behavior of different aluminum-base alloys in a humid environment, finding that the main attack regions were the matrix/reinforcements interfaces. Thus, although by reinforcing Al-base alloy with 3% Y2O3 particles and heat treating it at 400 0C increase the base alloy uniform corrosion rate resistance, the presence of interfaces at the matrix/Y2O3 particles and some other heterogeneities induce the susceptibility towards localized corrosion such as pitting.
4. CONCLUSIONS
A study on the effect of heat treatment on the corrosion behavior of Al-base composites in 3.5 % NaCl has been carried out. It was found that both the Al-base base alloy Al-base composites exhibited an active-passive behavior, and in some cases, the passive film properties, such as passive current density and pitting potential value, of composites were better than those for the base alloy. The corrosion process was under charge transfer control for base alloy, but for composite was diffusion controlled. In the as received condition, the base alloy had a higher corrosion resistance than the composite. However, the corrosion resistance for heat treated composite was higher than the base alloy. Base alloy was susceptible to pitting type of corrosion, whereas the corrosion morphology for composite was at the matrix/Y2O3 particles interface, where the matrix acted as an active anode, and the reinforcement Y2O3 particles acted as micro cathode.
ACKNOWLEDGEMENTS
The authors would like to thank the financial support given by CONACYT to carry out this project.
References
1. A. Wagih, Adv. Powder Technol., 26(2015) 253.
2. R. Deaquino-lara, E. Gutiérrez-castañeda, I. Estrada-guel, G. Hinojosa-ruiz, and E. García-sánchez, Mat er. Des., 53(2014) 1104.
3. A. Bist, J. S. Saini, and B. Sharma, Trans. Nonferrous Met. Soc. China, 26 (2016) 2003. 4. K. Kanayo and P. Apata, Integr. Med. Res., 2(2013)188.
5. T. Hu, K. Ma, T.D. Topping, B. Saller, A. Yousefiani, J.M. Schoenung, and E.J. Lavernia, Scr. Mater. 78(2014) 25.
7. A. Singh and N. Mohan, Mater. Today Proc., 2(2015) 2840.
8. S. Valdez, J. Ascencio, and S. R. Casolco, Int. J. Electrochem. Sci., 9(2014) 6225.
9. J.M. Mendoza Duarte, I. Estrada Guel and C. Carreno Gallardo, J. Alloys Compd., 643(2015) S172. 10. S. Valdez, B. Campillo, R. Pérez, L. Martínez, and A. H. García, Mater. Lett. 62(2008) 2623.
11. G. B. V. Kumar, C. S. P. Rao, N. Selvaraj, and M. S. Bhagyashekar, J. of Minerals and Materials Characterization and Engineering, 9(2010) 43.
12. J. Safari, G. H. Akbari, A. Shahbazkhan, and M. Delshad Chermahini, J. Alloys Compd., 509(2011) 9419.
13. R. S. R. R. Purohit and S. Das, International Journal of Scientific and Engineering Research, 3(2012) 1.
14. B. P. P. K. Rohatgi, B. Schultz, and M. Matters, Material Matters 3(2017) 1.
15. S. Mohapatra, A. K. Chaubey, D. K. Mishra, and S. K. Singh, J. Mater. Res. Technol., 5(2015) 117. 16. X. Yao, Y. F. Zheng, J. M. Liang, and D. L. Zhang, Mater. Sci. Eng. A, 648(2015) 225.
17. A. Javdani, V. Pouyafar, A. Ameli, and A. A. Volinsky, Materials and Design, 109(2016) 57. 18. S. D. Saravanan and M. S. Kumar, Procedia Eng., 64(2013)1505.
19. B. Bobic, S. Mitrovic, M. Bobic and I. Bobic, Tribol Ind., 32(2010) 3. 20. K. Kanayo, T. Moyosore, and P. Apata, J. Mater. Res. Technol., 3(2014) 9. 21. K. Alaneme, Leonardo J. Sci. 18(2011) 55.
22. ASTM Standard G1: Practice for Preparing, Cleaning, and Evaluating Corrosion Test Specimens, West Conshohocken, PA: ASTM International (1994).
23. ASTM Standard G31: Practice for Laboratory Immersion Corrosion Testing of Metals, West Conshohocken, PA: ASTM International, (1995).
24. A.V. Krajnikov, M. Gastel, H.M. Ortner and V.V. Likutin, Appl. Surf. Sci. 191 (2002) 26. 25. C.R. Werret, D.R. Pyke and A.K. Bhattachrya, Surf. Interf. Anal. 25 (1997) 809.
26. E. McCafferty and J.P. Wightman, Surf. Interf. Anal. 26 (1998) 549.
27. Geetha Mable Pinto, Jagannath Nayak and A. Nityananda Shetty, Int. J. Electrochem. Sci., 4 (2009) 1452.
28. A.K. Mishra, R. Balasubramaniam and S.Tiwari, Anti-Corros Methods Mater. 54(2007) 37. 29. P.D. Reena Kumari, J. Nayak and A. Nityananda Shetty, Arabian J. Chem. 9(2011) S1144
30. A. Pardo, M.C. Merino, S. Merino, F. Viejo, M. Carboneras and R. Arrabal, Corros. Sci. 47 (2005) 1750.
31. R. Escalera-Lozano, C.A. Gutierrez, M.A. Pech-Canul and M.I. Pech-Canul, Waste Management 28(2008) 389.
32. A. Pardo, M. C. Merino, S. Merino, M. D. Lopez, F. Viejo and M. Carboneras, Materials and Corrosion 54(2003) 311.