European Union foreign direct
investment yearbook 2008
Data 2001-2006
2008 edition
European Union foreign direct
investment yearbook 2008
Data 2001-2006
Foreign direct investment (FDI) plays a key role in the globalisation process and is an important element aff ecting international relations.
An international investment is classifi ed as FDI when at least 10% of the capital of the target enterprise is acquired. The publication provides detailed data on EU - FDI for recent years, for both EU FDI abroad and FDI into the EU. It provides an overview of the position of the EU in World FDI and a comparison with the US. For EU FDI abroad, a particular focus is put on EU FDI in emerging countries. Finally, FDI data with major partners are detailed according to the kind of activity in which the investment takes place. Data focus on the EU as whole and, to a lesser extent, on the Member States.
http://ec.europa.eu/eurostat
Eur
op
ean Union f
or
eign dir
ec
t in
vestmen
t y
ear
bo
ok 2008
Da
ta 2001-2006
2008 edition
-BK
-08-001-EN-C
Pocketbooks
ISBN 978-92-79-08401-0
Our priced publications are available from EU Bookshop (http://bookshop.europa.eu), where you can place an order with the sales agent of your choice.
European Union foreign direct
investment yearbook 2008
2008 edition
Data 2001-2006
Freephone number (*):
00 800 6 7 8 9 10 11
(*) Certain mobile telephone operators do not allow access to 00 800 numbers or these calls may be billed.
More information on the European Union is available on the Internet (http://europa.eu).
Luxembourg: Office for Official Publications of the European Communities, 2008
ISBN 978-92-79-08401-0
DOI 10.2785/14478 Cat. No. KS-BK-08-001-EN-C
Theme: Economy and finance Collection: Pocketbooks
© European Communities, 2008 © Cover photo: European Commission
Printed in Luxembourg
− Foreign direct investment 3
Foreword
Foreign direct investment (FDI) is a category of international investment that indicates an intention to acquire a lasting interest in an enterprise operating in another economy. It covers all financial transactions between the investing enterprise and its subsidiaries abroad. It differs from portfolio investments, because the direct investor acquires at least 10 % of voting power.
Foreign direct investment acquires increasing importance as an indicator of the international economic climate. This publication covers data for the period 2002-06 for FDI stocks and 2001-06 for FDI flows. Data in this yearbook represent EU-27 from 2004 onwards and EU-25 before 2004. This split in the series is denoted with the use of two parallel lines in the charts throughout this publication.
Outward flows from the European Union towards extra-EU partners fell from EUR 306 bn in 2001 to EUR 260 bn in 2006, but increased by 11% from 2005. During the same period, foreign investments into the EU markets increased by 8 % from EUR 146 bn in 2001 to EUR 157 bn in 2006. The data of this publication were extracted in March-May 2008.
FDI plays a key role in the globalisation process as an important element of international relations and their development. Supplementing trade, FDI creates more direct and deeper links between economies. It is a source of extra capital, encourages efficient production, stimulates technology transfer and fosters the exchange of managerial know-how. It is thus believed to improve the productivity of business and to make economies more competitive.
4 Foreign direct investment – Eurostat would like to thank the following national banks and statistical offices, without whom the publication of this pocketbook would not have been possible:
Banque Nationale de Belgique
Българскатанароднабанка
Ceská Národní Banka Danmarks Nationalbank Deutsche Bundesbank Eesti Pank
Central Statistics Office (Ireland) Bank of Greece
Banco de España Banque de France Ufficio Italiano dei Cambi Central Bank of Cyprus Latvijas Banka Lietuvos Bankas
Statec/ Banque Centrale du Luxembourg Magyar Nemzeti Bank
National Statistics Office (MT) De Nederlandsche Bank Österreichisches Nationalbank Narodowy Bank Polski Banco de Portugal Banca Naţională a României Banka Slovenije
Národná Banka Slovenska Suomen Pankki Sveriges Riksbank
Office for National Statistics (UK)
European Union Foreign Direct Investment
Pocketbook 2008
The foreign direct investment pocketbook provides users with analytical aspects of foreign direct investment stocks, flows and income for the European Union. The pocketbook has a simple objective: to provide political and corporate decision-makers with high quality statistical information on direct investment. Eurostat is able to provide internationally comparable figures, through close cooperation with Member States, the European Central Bank and the OECD. The ECB and Eurostat have a shared responsibility for publishing foreign direct investment data. While the ECB produces the Euro-area infra-annual data on an aggregated level, Eurostat produces annual data covering the whole European Union with detailed breakdowns according to partner countries and economic activities. The data processing, statistical analyses, writing of the publication and desktop publishing were carried out by the following
team under the coordination of
Merja Hult
:Corsini Cristina
Demianova Vladimira
Foltête Anne
− Foreign direct investment 5 Due to significant revisions in the FDI data from the Member States, direct comparison of this year’s analysis (regarding the periods until 2005 for both flows and stocks) with the analysis in the previous edition of the pocketbook (yearbook 2007) might not be realistic.
For detailed statistical tables, please see the Eurostat website:
http://ec.europa.eu/eurostat
Direct access to FDI data:
http://epp.eurostat.ec.europa.eu/portal/page?_pageid=1996,45323734&_dad=portal&_ schema=PORTAL&screen=welcomeref&open=/economy/bop&language=en&product =EU_MAIN_TREE&root=EU_MAIN_TREE&scrollto=178
For more information, or if you have any suggestions on how we might improve the publication please contact:
European Commission
Eurostat
Balance of Payments, Unit C4
Head of Unit Ms. Maria-Helena Figueira
Bâtiment Bech E4/816
Table of Contents
TABLE OF CONTENTS
EXECUTIVE SUMMARY
8
Overview 9
What is direct investment?
20
Chapter 1: EU direct investment abroad
23
1.1 FDI in extra-EU countries: trend and main destinations
25
1.2 FDI income from extra-EU countries
35
Chapter 2: Direct investment in the EU
37
2.1 FDI from extra-EU countries: trend and main investors
39
2.2 Income paid on inward EU FDI
48
Chapter 3: The role of emerging markets
51
3.1. Latin America
57
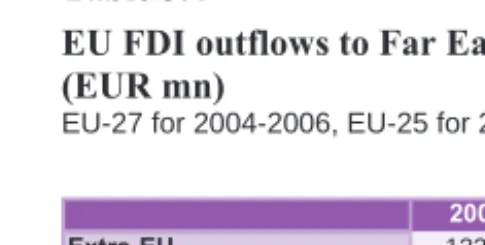
3.2. Far East Asia
60
3.3. Mediterranean partner countries
64
3.4. Central/Eastern European countries and Russia
67
Chapter 4: EU FDI by economic activity
69
4.1. Comparing EU inward and outward FDI: net position by
economic activity
72
4.2. Outward EU FDI by economic activity
73
4.3. Inward FDI by economic activity
78
Annexes 83
Annex 1. Statistical Tables
85
Annex 2. Exchange Rates
102
Annex 3. Nomenclature
104
Annex 4. Economic and geographical zones
107
8 Foreign direct investment –
EXECUTIVE SUMMARY
The EU had 34 % of world FDI outflows in 2006
¾ United States, Canada and Switzerland remain the top three destinations of EU FDI outward flows in 2006
¾ World FDI inward flows increased in 2006 by 56 % from 2005, EU FDI inward flows increased by 24 %
2006: strong year for foreign investment into the EU
¾ The United States was the main investor in total EU inward flows with a share of 48 % in 2006
¾ Sharp increase in FDI inflows to the EU from Japan in 2006
¾ At the end of 2005, the United Kingdom was the main host of direct investments in the EU-27
EU FDI outward flows to extra-EU countries EUR 260.2 bn in 2006, increase of 11 % from 2005
¾ EU FDI outward flows to the United States doubled in 2006, reaching EUR 72.0 bn, 28 % of the total extra-EU FDI
¾ FDI income from extra-EU countries EUR 211.3 bn in 2006
¾ Income from EU FDI abroad yielded 8.7 % in 2006
Increased EU FDI outward flows to emerging markets in 2006
¾ At EUR 12 bn EU FDI outward flows to Latin America remained stable
¾ In 2006 Singapore and China were the top EU FDI destinations in Far East Asia
¾ EU outflows to the Mediterranean partner countries more than doubled in 2006
¾ EU flows to Central/Eastern European countries and Russia remained stable in 2006. Russia continues to be the main host country
Recovery of EU outward FDI in the services sector in 2005
− Foreign direct investment 11
World FDI inflows increased by 56 % in 2006
Compared with 2005, world FDI inflows (excluding intra-EU flows) increased by 56 % to EUR 774 bn in 2006 (EUR 496 bn in 2005).
EU FDI inflows (1) increased by 24 % to EUR 157 bn, resulting in a
share of 20 % of world FDI inflows and surpassing the United States (18% of world FDI inflows). The share of world inflows to developing countries dropped to 46 %, from 58 % in 2005, whereas inflows to developed countries were 54 % of the total flows.
Chart 0.1
World FDI-flows by recipient, 2001-2006, EUR bn
EU-27 for 2004-2006, EU-25 for 2001-2003(EUR bn)
0 250 500 750 1000
2001 2002 2003 2004 2005 2006
0 25 50 75 100
EU (from extra-EU) USA
Other developed countries Other countries EU share (right-hand scale)
EU share (%)
Chart 0.2
Weight of extra- and intra-EU FDI in total EU FDI flows
EU-27 for 2004-2006, EU-25 for 2001-20030 20 40 60 80 100
2001-2003 average 2004-2006 average
%
Intra Extra
While EU FDI inflows increased by 24 % between 2005 and 2006, intra-EU flows decreased slightly by 3 %. However, the percentage
12 Foreign direct investment – of intra-EU flows out of total FDI inflows remains high and has even increased over the past few years. The weight of cumulative intra-EU flows reached 76 % for the period 2004-06.
Chart 0.3
EU FDI stocks: outward, inward and net, 2002-2006
EU-27 for 2004-2006, EU-25 for 2002-20030 500 1000 1500 2000 2500 3000
2002 2003 2004 2005 2006
outward stocks inward stocks net assets
(EUR bn)
EU outward FDI stocks have increased over the period 2002-06 by 42 % and by 11 % between 2005 and 2006. Inward stocks are growing at an even higher pace; an increase of 13 % was recorded between 2005 and 2006 and of 63 % from 2002 to 2006.
In absolute terms the outward stocks increased between 2005 and 2006 by EUR 271 bn resulting to an increase of the net EU FDI assets to EUR 649 bn at the end of 2006. The net asset position increased for the second consecutive year after continued decline since 2001.
North America owned 50 % of EU FDI inward stocks at
the end of 2006
The value of EU FDI inward stocks increased from EUR 1 265 bn at the end of 2002 to EUR 2 057 bn at the end of 2006 (see Chart 0.3). Of these stocks, North America held 50 %, eight percentage points less than at the end of 2002.
The share of Europe (non-EU) increased from 17 % at the end of 2002 to 22 % at the end of 2006, totalling EUR 457 bn.
Inward stocks held by South and Central America increased by 112 %, accounting for a share of 14 % of EU FDI inward stocks.
− Foreign direct investment 13
Chart 0.4
EU-25 FDI inward stocks by extra-EU main investor
(end - 2006)
Europe (non-EU)
17%
North America 58% not allocated
3%
South and Central America
11% Asia
9%
Oceania 1% Africa
1%
(end - 2002)
North America 50% Africa
1%
Oceania 1%
Asia 10%
South and Central America
14%
not allocated 2%
Europe (non-EU) 22%
The EU's share of world FDI outflows 34 % in 2006
In 2006 the world FDI outflows picked up again. World FDI flows – excluding intra-EU FDI flows – totalled EUR 772 bn (EUR 418 bn in
2005, an 85 % increase) (2). EU FDI outflows, at EUR 260 bn,
increased by 11 % from 2005, reaching the highest level since 2001 (EUR 306 bn).
14 Foreign direct investment –
Chart 0.5
World FDI-flows by origin, 2001-2006, EUR bn
EU-27 for 2004-2006, EU-25 for 2001-2003(EUR bn)
-250 0 250 500 750 1000
2001 2002 2003 2004 2005 2006
0 25 50 75 100
EU (to extra-EU) USA
Other developped countries Other countries
EU share (right-hand scale)
EU share (%)
The geographical distribution of world FDI outflows by investor country continued to show the dominance of developed countries (80 %). The share of the EU in world FDI outflows was 34 % in 2006. It decreased considerably due to the remarkably high share in 2005. The EU share in world FDI outflows increased considerably in 2005 (to 56 % from 26 % in 2004) due to a significant decline in outward FDI flows from the United States, dropping from EUR 207 bn in 2004 to a disinvestment of EUR -22 bn in 2005. This was mainly due to an increase in distributed profits of US-owned foreign affiliates, which
led to a large decline in reinvested earnings (3).
United States, Canada and Switzerland remain the top
three destinations of EU FDI outward flows in 2006
In 2006, there was a new upsurge of FDI flows to the United States and Canada. Of the EUR 260 bn total of EU FDI outward flows, EUR 72 bn was invested in the United States ( 130 % increase from
2005). Canada received EUR 30 bn (12 % of total extra-EU
investments), followed by Switzerland (EUR 21 bn and share of 8 %).
The United States and Switzerland also remained the main investors in the EU in 2006, accounting for respective shares of 48 % and 11 % of the total extra-EU investments received (EUR 157 bn).
− Foreign direct investment 15
Table 0.1
Main partners for EU FDI outward and inward flows in 2006*
EUR bn % EUR bn %
Extra EU of which 260.2 100.0% 157.1 100.0%
Europe (non-EU) of which 66.8 25.7% 25.8 16.4%
Switzerland 20.9 8.0% 16.7 10.6%
Norway 5.9 2.3% 1.6 1.0%
Candidate Countries** 12.0 4.6% -0.5 -0.3%
Croatia 1.5 0.6% -0.1 0.0%
Turkey 10.5 4.0% -0.4 -0.3%
Russia 10.4 4.0% -0.5 -0.3%
Ukraine 2.0 0.8% -0.1 0.0%
Africa 11.8 4.5% 1.9 1.2%
North America of which 102.5 39.4% 82.7 52.6%
USA 72.0 27.7% 75.6 48.1%
Canada 30.4 11.7% 7.0 4.5%
Central America of which 30.2 11.6% 17.8 11.3%
Mexico 1.2 0.5% 0.1 0.1%
South America of which: 9.3 3.6% 1.9 1.2%
Brazil 5.1 1.9% 1.1 0.7%
Argentina 1.5 0.6% 0.1 0.0%
Asia of which 30.6 11.8% 29.5 18.8%
Japan 0.5 0.2% 13.6 8.7%
China (incl. Hong Kong) 8.9 3.4% 1.8 1.1%
Indonesia -2.0 -0.8% -0.5 -0.3%
India 2.5 0.9% 0.5 0.3%
South Korea 1.3 0.5% 1.0 0.6%
Oceania of which 7.6 2.9% 4.5 2.9%
Australia 7.2 2.8% 3.7 2.3%
OECD (non-EU) 150.4 57.8% 120.5 76.7%
Offshore financial centres*** 50.8 20.0% 29.2 18.6%
Outward flows Inward flows
*The sum of continents does not always equal total extra-EU because of not allocated flows. Parts may be higher than totals because of disinvestment.
** Candidate countries: Croatia and Turkey.
*** Offshore financial centres is an aggregate used in Eurostat and ECB FDI data which includes 38 countries (for example Hong Kong, Singapore, Jersey, Bahamas, Bermuda, Cayman Islands). For the complete list of countries please refer to Annex 4.
North America hosted 39 % of the EU's outward FDI
stocks at the end of 2006, stocks in Asia remain at 13 %
The value of EU FDI outward stocks increased from EUR 1 905 bn at the end of 2002 to EUR 2 706 bn at the end of 2006 (an increase of 42 %).
16 Foreign direct investment – The stocks held in non-EU Europe accounted for 23 % of EU's
outward stocks in 2006, an increase of EUR 225 bn and 2
percentage points from the situation at the end of 2002.
The combined share of South and Central America increased from 12 % at the end of 2002 to 17 % at the end of 2006. However, FDI stocks held in South America increased by 73 % and by 127 % in Central America over the period in question.
Whereas Africa increased its share by two percentage points to 5 % at the end of 2006, the shares of the rest of the continents remained at same level as in 2002.
Chart 0.6
EU-25 FDI outward stocks by main destination
(end - 2006)
North America 39%
Europe (non-EU) 22%
not allocated 0%
South and Central America
17% Asia 14%
Oceania 2% Africa
5%
(end - 2002)
North America 44%
Europe (non-EU) 22%
not allocated 4%
South and Central America
12% Asia 13%
Oceania 3%
− Foreign direct investment 17
North American FDI assets in the EU higher than
EU FDI assets in North America at the end of 2006
Total EU FDI net assets (outward minus inward stocks) amounted to EUR 649 bn at the end of 2006 returning to a similar level than at the end of 2002 (EUR 640 bn) after some decline in the previous years (Chart 0.3). At the end of 2006, net assets with North America were EUR 59 bn dropping from a net position of EUR 103 bn in 2002.
Whereas net assets in Europe (non-EU) and in Oceania decreased between 2002 and 2006, net assets in South and Central America, Asia and Africa increased by 93 %, 19 % and 84 % respectively.
Chart 0.7
EU FDI net
*assets, 2002 and 2006
0 20 40 60 80 100 120 140 160 180 200
North America
Europe (non-EU)
South and Central America
Asia Africa Oceania
2002 2006
*Net= Outward - inward (EUR bn)
Most FDI still going to services
Extra-EU outward stocks were marked by continued gradual
increase in the dominance of services activities (4) (from 65 % at the
end of 2002 to 68 % at the end of 2005), accompanied by a decline
in the share of manufacturing (from 25 % at the end of 2002 to 21 %
at the end of 2005). The share of other activities (5) remained stable.
Detailed information on the breakdown by activity is given in Chapter 4 for FDI with the main EU partners.
(4) Services activities consist of: trade, hotels and restaurants, transport, telecommunication, financial intermediation, business services (includes business and management consulting, advertising, computer activities and research and development), real estate services, other services not elsewhere classified.
18 Foreign direct investment –
The relative importance of services activities was even more
pronounced for inward stocks: at EUR 1 359 bn they accounted for 75 % of total EU FDI inward stocks at the end of 2005.
Chart 0.8
Extra-EU FDI outward stocks by main activity 2002 and 2005
0 20 40 60 80 100
2002 2005 2002 2005
Outward Outward Inward Inward
%
Services Manufacturing Others
Net FDI income record high at EUR 87 bn in 2006
At EUR 211 bn in 2006, EU income earned from FDI abroad reached its highest level over the period under consideration, making for a 10 % rise from 2005. This can be compared with the 11 % increase in the EU FDI outward stocks from 2005 to end-2006.
Income paid to foreign owners in 2006 recorded a 13 % increase to EUR 124 bn. The resulting net FDI income amounted to a record EUR 87 bn in 2006 (EUR 18 bn in 2002) representing 0.75 % of EU's GDP in 2006.
The rate of return (6) gained on the EU outward stocks remained
stable between 2005 and 2006 at 8.7 %. The rate of return earned by foreign owners continued to increase peaking at 6.8 % in 2006. As shown in Chart 0.9 (right-hand scale), in the last four years, the rate of return on EU outward FDI was higher than on EU inward FDI.
− Foreign direct investment 19
Chart 0.9
EU FDI income and rates of return 2002-2006, EUR bn
EU-27 for 2004-2006, EU-25 for 2002-20030 50 100 150 200 250
2002 2003 2004 2005 2006
0 3 6 9 12
EU Income from extra-EU FDI EU FDI income paid to extra-EU
Rate of return on outward FDI stocks Rate of return on inward FDI stocks
income (EUR bn)
What is direct investment?
• Foreign direct investment is the category of international
investment in which an enterprise resident in one country (the direct investor) acquires an interest of at least 10 % in an enterprise resident in another country (the direct investment enterprise). Subsequent transactions between affiliated enterprises are also direct investment transactions.
• As it gives the investor an effective voice in the management of
the enterprise and a substantial interest in its business, FDI implies a long-term relationship between the direct investor and the direct investment enterprise.
• Investment may take place through the establishment of an
entirely new firm, so-called ‘greenfield’ investment, or through the complete or partial purchase of an existing firm via a merger or an acquisition.
Why FDI takes place
Two main reasons are given for why investors engage in foreign direct investment: vertical and horizontal FDI. A mixture of both is possible and is often the case.
• Vertical FDI
In this case, a company ‘slices’ its production chain by allocating different parts to those countries in which production costs are lower. Progress achieved in recent years in telecommunications and data management has enabled firms to allocate their production processes more easily through so-called supply chain management.
• Horizontal FDI
Here, a company ‘duplicates’ its production chain in order to place its production closer to foreign markets. The investment decision may result from a trade-off between fixed costs (the new plant) and variable costs (high tariffs and transport costs associated with exporting to that country). Large markets tend to be more competitive, making imports less attractive, and it is there that major investors tend to carry out this type of investment. Acting as a substitute to trade, horizontal FDI gives investors strategic market access and reduces delivery time.
• A third possible explanation for FDI are conglomerate M&As which
take place between companies seeking to diversify risk and to deepen economies of scope.
− Foreign direct investment 21
Advantages of FDI
For the investor
• For the investing firm, FDI usually means access to new markets
and better knowledge of those markets. This may, however, come at higher international transaction and organisational costs.
• In some service industries, local market presence (e.g. a banking
outlet or representative office) may be a prerequisite for serving that market.
• Lower labour, raw material and intermediary input costs may
determine where the direct investment enterprise is located.
For the investee
• As it is less liquid and tradable than portfolio investment, FDI flows
are usually less volatile. Especially in the case of developing countries, this type of financing reduces the risk of external speculation and liquidity crises. FDI contributes positively to the recipient’s balance of payments, both through the initial transaction and by adding to export growth.
• FDI contributes to growth in the target country by increasing the
Chapter 1:
− Foreign direct investment 25 Since 2002, EU FDI outflows have been increasing, rising to
EUR260.2bn in 2006
1.1 FDI in extra-EU countries: trend and main
destinations
EU FDI outward flows in 2006 up 11 % on 2005
After the sharp decline in 2002, and the period of moderate growth during 2003-04, foreign direct investment outflows from the EU picked up by 65 % in 2005 and continued to grow in 2006.
In 2006, the American continent was the main destination of EU FDI outflows with a share of 55 %. The outflows to America more than doubled in value compared with 2005, reaching EUR 141.9 bn, the highest level since 2002.
The record outflows of EUR 112.5 bn in 2005 to the European continent (non-EU countries) were explained by the recovery of investment flows to Switzerland. In 2006 non-EU Europe attracted investment flows worth EUR 66.8 bn (26 % of total extra-EU flows).
The United Kingdom, with outflows of EUR 67.2 bn and a share of 26 % of the EU total, was the largest investor in extra-EU in 2006,
followed by France (EUR 41.8 bn or 16 %) and Germany
(EUR 31.1 bn or 12 %).
Chart 1.1
Extra-EU outward FDI flows, by main continents, EUR bn
EU-27 for 2004-2006, EU-25 for 2001-2003-10 15 40 65 90 115 140 165 190 215
2001 2002 2003 2004 2005 2006 0
50 100 150 200 250 300
Total
Europe (non-EU) Africa
America Asia
26 Foreign direct investment –
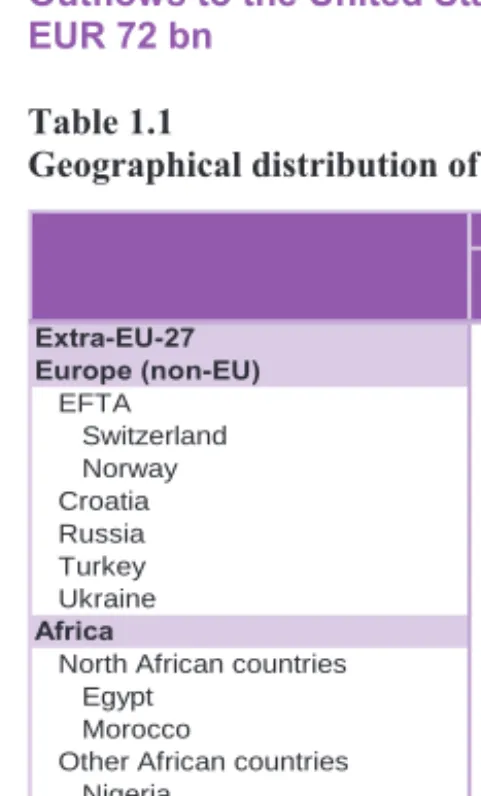
Outflows to the United States doubled in 2006, reaching
EUR 72 bn
Table 1.1
Geographical distribution of EU FDI outflows 2004-2006
*2004 2005 2006
Extra-EU-27 142.3 234.5 260.2 100%
Europe (non-EU) 31.6 112.5 66.8 26%
EFTA -4.3 74.7 26.9 10%
Switzerland -11.9 74.4 20.9 8%
Norway 7.6 0.3 5.9 2%
Croatia 0.6 1.1 1.5 1%
Russia 6.0 9.6 10.4 4%
Turkey 1.2 4.4 10.5 4%
Ukraine 0.3 5.8 2.0 1%
Africa 13.9 16.3 11.8 5%
North African countries 3.4 1.8 5.9 2%
Egypt 1.2 0.8 3.3 1%
Morocco 0.2 1.1 1.2 0%
Other African countries 10.4 14.6 5.9 2%
Nigeria 0.4 3.2 1.9 1%
Republic of South Africa 6.0 7.4 4.5 2%
America 57.4 61.3 141.9 55%
North American countries 13.2 43.3 102.5 39%
Canada -2.3 12.0 30.4 12%
United States 15.5 31.3 72.0 28%
Central American countries 36.1 8.5 30.2 12%
Mexico 10.8 2.8 1.2 0%
South American countries 8.1 9.5 9.3 4%
Argentina -1.3 1.7 1.5 1%
Brazil 5.7 7.4 5.1 2%
Chile 2.0 0.9 0.3 0%
Venezuela 1.1 1.0 1.8 1%
Asia 35.5 42.3 30.6 12%
Near and Middle East countries 2.1 3.4 3.6 1%
Gulf Arabian Countries 1.2 2.4 2.5 1%
Other Asian countries 33.5 38.9 27.0 10%
China 3.9 6.2 6.0 2%
Hong Kong 11.3 3.9 2.9 1%
India 1.6 2.5 2.5 1%
Indonesia 0.2 4.0 -2.0 -1%
Japan 5.8 11.9 0.5 0%
Korea** 2.0 5.0 1.3 0%
Singapore 2.7 -0.2 10.2 4%
Taiwan 1.2 3.0 0.8 0%
Oceania and Polar regions 1.7 -1.2 7.6 3%
Australia 0.9 -1.9 7.2 3%
New Zealand 0.7 0.5 0.4 0%
ACP countries*** 12.5 18.4 20.0 8%
OECD countries (non-EU) 30.1 140.7 150.4 58%
Offshore financial centres**** 65.0 25.4 50.8 20%
Flows (EUR bn) Share (%) in 2006
* The sum of continents does not always equal total extra-EU because of not allocated flows. Parts may be higher than totals because of disinvestment.
** Republic of South Korea.
*** African, Caribbean and Pacific countries (Lomé convention)
− Foreign direct investment 27 The United States strengthened its position as the main destination of EU investment with outflows of EUR 72 bn in 2006, up 130 % on the previous year.
In 2006 FDI outflows from the United Kingdom to the United States went down drastically (decrease of EUR 24 bn from 2005), but this decline was largely offset by considerably higher German outflows (increase of EUR 20 bn from 2005) and growth in outflows from Luxembourg, Ireland, Spain, Hungary and France.
Large growth was also recorded in EU outflows to Canada, as they reached the highest level since 2001 with EUR 30.4 bn (12 % of total extra-EU). Canada was the country attracting most FDI from the United Kingdom in 2006.
Chart 1.2
EU outflows to America 2002-2006, EUR bn
EU-27 for 2004-2006, EU-25 for 2002-2003-5 20 45 70 95 120 145
2002 2003 2004 2005 2006
USA Canada Mexico
Brazil America (total)
European (non-EU) countries: Switzerland main partner,
investments in Turkey and Russia rising
The share of EU FDI outflows directed to European (non-EU) countries has consistently been above 20 % since 2002, reaching 48 % in 2005. In absolute terms, these investments were at their peak in 2005 with EUR 112.5 bn.
Investments in Switzerland have been fluctuating in recent years, from a disinvestment of EUR -11.9 bn in 2004 to a record investment of EUR 74.4 bn in 2005. In 2006, it was still the major European partner with outflows of EUR 20.9 bn.
Investments in Russia and Turkey have been rising steadily since
2002. In 2006, outflows to Turkey jumped to EUR 10.5 bn
(EUR 4.4 bn in 2005), which was mainly due to acquisitions of
companies in the financial and telecommunication sectors (further
28 Foreign direct investment –
Chart 1.3
Extra-EU cumulated FDI outflows towards Europe (non-EU)
in 2004-2006
Ukraine 4%
Norway
7% Turkey
8%
Russia 12%
Serbia and Montenegro
3%
Croatia 2%
Others 25%
Switzerland 39%
Asia: EUR 11 bn drop in investments in Japan
2006 saw a drop in investments in Asia, with outward investment flows down from EUR 42.3 bn in 2005 to EUR 30.6 bn in 2006. The most significant change with an individual partner was recorded with Japan. In 2004 and 2005 the investment flows were EUR 5.8 bn and
EUR 11.9 bn, but in 2006 investments in Japan dropped to
EUR 0.5 bn, mainly explained by a disinvestment of EUR -5.4 bn
recorded in equity capital in 2006. This disinvestment was due to
some large sell-offs of foreign affiliates to Japanese companies, for example Vodafone Group Plc.'s withdrawal from the Japanese
mobile phone markets (7).
Chart 1.4
EU FDI outflows to Asia 2002-2006, EUR bn
EU-27 for 2004-2006, EU-25 for 2002-2003-1 1 3 5 7 9 11 13 15
2002 2003 2004 2005 2006 0
5 10 15 20 25 30 35 40 45 50
China Hong Kong
Japan Korea (Republic of South Korea)
Singapore Asia in total (right-hand scale)
− Foreign direct investment 29
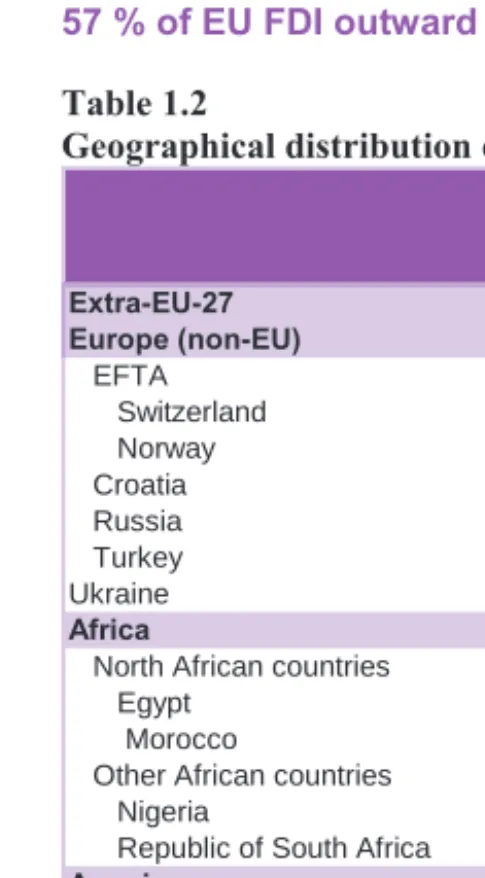
[image:32.595.31.274.78.517.2]57 % of EU FDI outward stocks in America
Table 1.2
Geographical distribution of EU FDI assets 2004-2006
*2004 2005 2006
Extra-EU-27 2 199.9 2 435.2 2 706.2 100%
Europe (non-EU) 406.5 509.5 619.8 23%
EFTA 297.7 352.3 376.8 14%
Switzerland 250.4 310.8 333.2 12%
Norway 45. 39.4 41.5 2%
Croatia 5.8 8.2 11.8 0%
Russia 21.6 33.3 52.2 2%
Turkey 13.7 23.3 33. 1%
Ukraine 1.8 7.7 : :
Africa 110.2 119.2 125.1 5%
North African countries 23. 26.1 32.9 1%
Egypt 7.5 8.9 11.5 0%
Morocco 9.5 11.4 12.9 0%
Other African countries 87.2 93.1 92.1 3%
Nigeria 11.3 14.7 22.5 1%
Republic of South Africa 43.5 47.1 44. 2%
America 1 252.5 1 370.4 1 533.6 57%
North American countries 895.8 947.2 1 078.5 40%
Canada 80.5 97. 119.6 4%
United States 815.8 850.4 934.3 35%
Central American countries 211.6 255.4 287.1 11%
Mexico 40.3 44.8 43.2 2%
South American countries 145.1 167.8 168. 6%
Argentina 31.2 33.7 32.3 1%
Brazil 72.8 84.4 88. 3%
Chile 17.6 17. 13.5 0%
Venezuela 5.6 9.4 11.1 0%
Asia 345.5 368.4 367.7 14%
Near and Middle East countries 22.1 26. 27.3 1%
Gulf Arabian Countries 12. 14.2 14.8 1%
Other Asian countries 323.4 342.4 340.5 13%
China 22.5 28.2 32.7 1%
Hong Kong 97.7 85.4 83.4 3%
India 9.1 11.1 13.4 0%
Indonesia 7.1 10.9 9.5 0%
Japan 79.5 90.2 75.5 3%
Korea** 20.6 28.9 29.2 1%
Singapore 45.8 48.8 54.3 2%
Taiwan 7.1 10.4 9.3 0%
Oceania and Polar regions 67.2 58.7 55.7 2%
Australia 60.3 52.8 50.6 2%
New Zealand 6.5 5.8 5.2 0%
ACP countries*** 96.5 108.3 120.7 4%
OECD (non-EU) 1 413.6 1 544. 1 661.9 61%
Offshore financial centres**** 398.3 443.2 543.6 20%
Stocks at end (EUR bn) Share (%) in 2006
* The sum of continents does not always equal total extra-EU because of not allocated flows. Parts may be higher than totals because of disinvestment.
** Republic of South Korea.
*** African, Caribbean and Pacific countries (Lomé convention).
30 Foreign direct investment –
EU FDI outward stocks: top 20 countries
Chart 1.5
Growth rate of outward FDI stocks held in the EU for top 20
destinations
-35% -5% 25% 55% 85% 115% 145% Chile (13.5 bn)
Australia (50.6 bn) Hong Kong (83.4 bn) Norway (41.5 bn) Japan (75.5 bn) Rep. of South Africa (44 bn) Argentina (32.3 bn) Mexico (43.2 bn) USA (934.3 bn) Singapore (54.3 bn) Brazil (88 bn) Switzerland (333.2 bn) Morocco (12.9 bn) Korea* (29.2 bn) China (32.7 bn) India (13.4 bn) Canada (119.6 bn) Nigeria (22.5 bn) Turkey (33 bn) Russia (52.2 bn)
Outward FDI stocks at
end-2006 (EUR bn)
Growth rate 2004-2006
* Republic of South Korea.
Chart 1.5 shows the recent evolution of extra-EU stocks held in the 20 largest partners, ranked according to the growth rate between 2004 and 2006.
− Foreign direct investment 31
(EUR 118.5 bn for the United States and EUR 82.8 bn for
Switzerland).
The investment stocks held in Japan, Norway, Hong Kong, Australia and Chile fell between 2004 and 2006, leading to negative growth rates.
Main investors among the Member States: the United
Kingdom, France and Germany
Three Member States accounted for the bulk of EU outward FDI stocks at the end of 2004: the United Kingdom, France and Germany. These three Member States made up 45 % of extra-EU outward stocks.
At the end of 2005, the United Kingdom’s share of extra-EU stocks was more than one fifth. 46 % of the United Kingdom’s stocks were held in the United States (EUR 241 bn).
France was the second main investor, with a 12 % share of EU FDI
stocks, followed by Germany with 11 %. With a value of
[image:34.595.34.277.325.540.2]EUR 145 bn, 49 % of French stocks were held in the United States, 9 % in Switzerland and 8 % in Japan. For Germany the United States was the main partner too, with a share of 56 % of German stocks (EUR 155 bn).
Table 1.3
Geographical distribution of EU FDI assets, three main
investors abroad at end-2005, EUR bn
Stocks at end-2005 EU-27 United
Kingdom France Germany Other EU
Member States
Extra-EU-27 2 435 520 295 277 1 343
Europe (non-EU) 509 70 40 36 364
EFTA 352 19 34 17 283
Switzerland 311 12 28 16 256
Russia 33 3 2 7 22
Turkey 23 : 2 3 :
Ukraine 8 5 3
Africa 119 30 18 5 66
Republic of South Africa 47 20 1 4 23
America 1 370 315 186 185 685
North American countries 947 260 167 164 356
Canada 97 19 23 9 47
United States 850 241 145 155 310
Central American countries 255 42 5 10 198
Mexico 45 4 2 4 34
South American countries 168 13 13 11 131
Brazil 84 5 10 8 62
Asia 368 80 45 45 199
Near and Middle East countries 26 5 5 1 14
Other Asian countries 342 75 39 44 184
China 28 4 3 11 11
Hong Kong 85 30 3 4 49
India 11 3 1 3 4
Japan 90 9 24 8 49
Singapore 49 10 3 6 30
Oceania and Polar regions 59 23 7 6 23
Australia 53 21 6 5 20
32 Foreign direct investment –
In 2006 extra-EU outflows from the United Kingdom
EUR 67.2 bn, France second with EUR 41.8 bn
Table 1.4
Geographical distribution of EU FDI outflows, three main
investors abroad in 2006, EUR bn
EU-27 United
Kingdom France Germany Other
EU Member
States
Extra-EU-27 260.2 67.2 41.8 31.1 120.1
Europe (non-EU) 66.8 18.1 15.9 5.7 27.1
EFTA 26.9 : 12.4 1.8 :
Switzerland 20.9 10.2 10.8 0.8 -0.8
Russia 10.4 0.0 1.0 2.3 7.1
Turkey 10.5 0.7 0.6 0.7 8.5
Africa 11.8 0.4 2.9 1.3 7.1
Republic of South Africa 4.5 2.1 0.2 0.5 1.7
America 141.9 29.8 17.1 18.0 77.0
North American countries 102.5 12.5 15.6 16.3 58.1
Canada 30.4 12.0 0.8 0.7 16.8
United States 72.0 0.4 14.8 15.6 41.2
Central American countries 30.2 14.4 0.4 0.0 15.4
Mexico 1.2 0.5 0.0 0.8 0.0
South American countries 9.3 2.9 1.2 1.7 3.5
Brazil 5.1 0.5 0.8 1.0 2.7
Asia 30.6 12.2 5.2 6.2 7.0
Near and Middle East countries 3.6 2.0 1.0 0.7 -0.2
Other Asian countries 27.0 10.2 4.2 5.5 7.1
China 6.0 0.5 0.3 2.4 2.7
Hong Kong 2.9 2.9 0.6 0.5 -1.1
India 2.5 0.4 0.5 0.7 0.9
Japan 0.5 0.6 1.7 -0.5 -1.4
Singapore 10.2 3.8 0.5 1.2 4.7
Oceania and Polar regions 7.6 5.4 0.7 -0.1 1.6
Australia 7.2 4.8 0.7 -0.1 1.9
: Missing or confidential data.
The main partner for the United Kingdom in 2006 was Canada with EUR 12 bn. Investments in the United States were at their lowest level since 2002, dropping from EUR 24.4 bn in 2005 to EUR 0.4 bn in 2006 due to large intercompany flows from subsidiaries in the United States to their parents in the United Kingdom.
In recent years there have been several major cross-border takeovers where French companies have been involved. In 2006 the major partners for France were the United States (with EUR 14.8 bn) and Switzerland (with EUR 10.8 bn). Major takeovers by French companies that were completed in 2006 were the acquisition of
Lucent Technologies Inc. (United States) by Alcatel SA for
EUR 10.8 bn and acquisition of the Swiss company Winterthur by
AXA SA for EUR 8 bn.(8)
Some large takeovers with the United States where German enterprises were involved in 2006 were the acquisition of Engelhart Corp. (United States) by BASF AG (EUR 3.9 bn), acquisition of Reebok International Ltd. (United States) by Adidas-Salomon AG for
− Foreign direct investment 33 EUR 3.3 bn and acquisition of Renal Care Group Inc (United States)
by Fresenius Medical Care AG & Co for EUR 3.2 bn (9).
Cumulated flows 2004-2006: 25 % from the United
Kingdom
The cumulated flows 2004-06 confirm the United Kingdom’s position as the leading investor among the EU Member States: one fourth of the EU outward flows in 2004-06 originated from the United Kingdom.
Luxembourg’s importance as the second largest investor is mainly
explained by its role as a centre of financial intermediation activities.
Chart 1.6
Share in EU FDI outward flows to extra-EU-27, 2004-2006
Luxembourg 12%
France 12% Netherlands
8% Germany
7% Spain
6% Belgium
4% Others
26%
United Kingdom
25%
34 Foreign direct investment –
Extra-EU FDI outflows in terms of GDP: the Netherlands
recorded the highest value in 2006
The ratio of extra-EU FDI flows to EU GDP was 2.2 % in 2006, up slightly on the previous year.
The four main EU investor countries increased their outward FDI to GDP ratio between 2005 and 2006.
With the exception of 2004, the Netherlands had the highest ratio of outward FDI to GDP over the period 2002-06. In 2006, the ratio was 4.2 %.
Generally, Germany recorded the lowest ratios among the main investor countries presented in Chart 1.7. However, in 2006 the ratio reached 1.3 %.
France’s FDI to GDP ratio increased from 1.8 % in 2002 to 2.3 % in 2006, with the lowest level in 2004 at 0.3 %.
Chart 1.7
EU FDI flows to extra-EU countries as share of investor
economy’s GDP
EU-27 for 2004-2006, EU-25 for 2002-2003
-1 1 2 3 4 5 6 7
EU average Germany France Netherlands United Kingdom
Others
%
− Foreign direct investment 35
1.2 FDI income from extra-EU countries
FDI income 10 % up between 2005 and 2006
EU FDI income from extra-EU FDI grew steadily over the period 2002-06, with values rising from EUR 85.8 bn to EUR 211.3 bn.
With EUR 92.9 bn in 2006, America was the main source of FDI income to the EU during the entire period. The income flows it provided averaged EUR 68.7 bn over the five-year period. Asia was the second largest provider of FDI income to the EU during the entire period, averaging EUR 30.1 bn over the five years.
Chart 1.8
EU FDI income from extra-EU FDI, EUR bn
EU-27 for 2004-2006, EU-25 for 2002-20030 25 50 75 100 125 150
2002 2003 2004 2005 2006
0 50 100 150 200 250 Total
Europe (non-EU) Africa
America Asia
36 Foreign direct investment –
Stocks, income and yield: 8.7 % yield on EU FDI abroad
in 2006
The ratio(10) of income in a given period to stocks at the beginning of
that period appears as an indicator of FDI profitability in Chart 1.9. Over the period 2003-06, extra-EU outward FDI yielded an annual average of 7.7 %, with the rate of return on extra-EU FDI rising from 5.4 % in 2003 to 8.7 % in 2006.
Africa had the highest rate of return over the period 2003-06. America, where most of EU FDI stocks are held (57 % in 2006), yielded rather low rates of return on EU investments, ranging from 4.5 % in 2003 to 6.8 % in 2006.
Chart 1.9
Extra-EU FDI rate of return
EU-27 for 2004-2006, EU-25 for 20030 2 4 6 8 10 12 14 16
2003 2004 2005 2006
%
Europe (non-EU) Africa
America Asia
Oceania and Polar regions Extra-EU
Chapter 2:
Direct investment in the EU
− Foreign direct investment 39
EU inward FDI flows from extra-EU countries continued to grow and reached EUR 157.1 bn in 2006.
2.1 FDI from extra-EU countries: trend and main
investors
EU FDI inward flows up by 170 % from 2004 to 2006
After a sharp decline in 2004, EU FDI inward flows increased by 118 % between 2004 and 2005 and by 24 % between 2005 and 2006. This amounts to an increase of EUR 30.1 bn in 2006.
In 2005, America regained its position as the main investor in the EU and this trend is confirmed in 2006 by a further growth in investment
of EUR 21.2 bn – corresponding to a 26 % rise from 2005.
Investment from America accounted for 65 % of the global amount invested in the EU in 2006.
Asia was the second largest investor in 2006, with EUR 29.5 bn and a 19 % share. Its investment in 2006 was the highest since 2002 and increased by EUR 31.8 bn compared to 2005. Asian investment in the EU originated mainly from Japan, which invested EUR 13.6 bn in 2006.
The European continent (non-EU countries) was the third largest investor in the EU, with EUR 25.8 bn, representing 16 % of extra-EU inward FDI flows. Following the sharp decline of inward flows from European non-EU countries in 2004 and the steep rise by 37 % in 2005, EU FDI inward flows fell by 36 % in 2006.
With EUR 4.5 bn and a 3 % share, Oceania and the Polar regions was the fourth biggest investor in the EU, followed by Africa with EUR 1.9 bn and a share of 1 %.
Chart 2.1
Extra-EU inward FDI flows, by main continents, EUR bn
EU-27 for 2004-2006, EU-25 for 2001-20030 20 40 60 80 100
2001 2002 2003 2004 2005 2006 0 20 40 60 80 100 120 140 160 Total
Europe (non-EU) Africa
America Asia
40 Foreign direct investment –
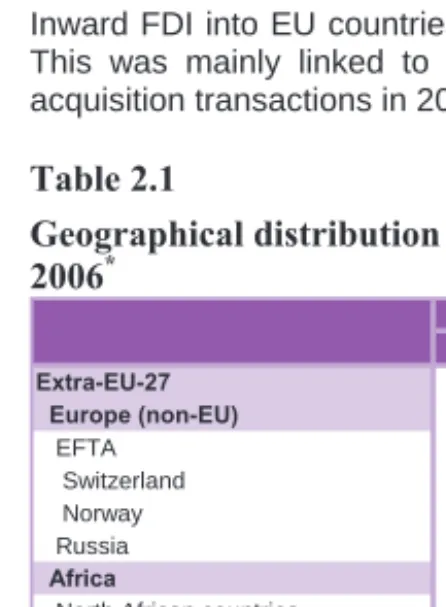
2006: extremely strong year for foreign investment into
the EU
[image:43.595.18.241.139.443.2]Inward FDI into EU countries reached its highest levels since 2000. This was mainly linked to the record level of global merger and acquisition transactions in 2006.
Table 2.1
Geographical distribution of EU-27 FDI inward flows
2004-2006
*2004 2005 2006
Extra-EU-27 58.3 127.0 157.1 100% Europe (non-EU) 29.6 40.6 25.8 16.4%
EFTA 17.2 22.1 20.1 12.8%
Switzerland 16.6 18.8 16.7 10.6%
Norway -1.1 1.3 1.6 1.0%
Russia 0.3 2.8 -0.5 -0.3%
Africa 1.0 1.1 1.9 1.2%
North African countries 0.2 0.1 0.4 0.3% Other African countries 0.8 0.9 1.5 1.0% Republic of South Africa 0.2 0.4 0.8 0.5%
America 11.7 81.2 102.4 65.1% North American countries 7.4 75.1 82.7 52.6%
Canada -4.1 7.8 7.0 4.5%
United States of America 11.5 67.3 75.6 48.1% Central American countries -0.6 2.4 17.8 11.3%
Mexico 1.2 1.2 0.1 0.1%
South American countries 4.9 3.7 1.9 1.2%
Brazil 4.0 2.9 1.1 0.7%
Asia 11.2 -2.2 29.5 18.8% Near and Middle East countries -6.2 2.1 11.0 7.0% Other Asian countries 17.4 -4.3 18.5 11.8%
China 0.5 -0.1 2.2 1.4%
Hong Kong 4.8 1.1 -0.4 -0.3%
Indonesia 0.1 0.4 -0.5 -0.3%
India 0.0 0.5 0.5 0.3%
Japan 8.2 -4.6 13.6 8.7%
Korea** 1.4 1.3 1.0 0.6%
Singapore 0.5 -2.0 5.0 3.2%
Taiwan -0.1 -0.2 0.4 0.2%
Oceania 3.7 5.3 4.5 2.9%
Australia 3.7 5.1 3.7 2.3%
New Zealand -0.1 0.1 0.3 0.2%
ACP countries *** 1.1 0.2 4.5 2.9%
Offshore financial centres **** 17.1 17.0 29.2 18.6% OECD countries (non-EU) 39.3 100.2 120.5 76.7% Flows (EUR bn) Share (%)
in 2006
* The sum of continents does not always equal total extra-EU because of not allocated flows. Parts may be higher than totals because of disinvestment.
** Republic of South Korea.
Direct investment in the EU
− Foreign direct investment 41
USA at the top in total EU inward investment in 2006
With a share of 48 % in 2006, the United States was the main investor in total EU inward flows. Following the sharp drop in EU inward flows from the United States in 2004 (EUR 11.5 bn), inflows expanded to EUR 67.3 bn in 2005 and EUR 75.6 bn in 2006 (+12 % on the year before).
Big strategic deals were put in place in 2006, which reinforced the position of the United States. These included the acquisition of TDC A/S (Denmark) by Nordic Telephone Co ApS for EUR 8.4 bn, VNU NV (Netherlands) by Valcon Acquisition BV for EUR 7.6 bn and Philips Semiconductors (Netherlands) by Investor Group for EUR 7.5 bn. Several other transactions were made in the domains of
telecommunications, hotels, courier services, banks and
pharmaceuticals(11)
.
Significant growth was recorded in FDI inflows from Central America,
which surged to EUR17.8bn in 2006 due to investment from central
American offshore financial centres in particular.
Chart 2.2
EU FDI inflows from America, EUR bn
EU-27 for 2004-2006, EU-25 for 2002-2003-5 15 35 55 75
2002 2003 2004 2005 2006 -15
5 25 45 65 85 105
Total
USA Central American countries Total (right-hand scale)
Switzerland remained the main investor in the EU among
non-EU countries in 2006
The second main investor in the EU was Switzerland, with
EUR16.7 bn, representing 11 % of total EU FDI inflows. Unlike the
United States, Switzerland reduced its investments in the EU by 11 % compared with the previous year.
Russia also reduced its investment in the EU, with a disinvestment
of EUR-0.5bn in 2006 compared with the EUR2.8bn invested in
2005.
42 Foreign direct investment –
Chart 2.3
EU FDI inflows from Europe (non-EU), EUR bn
EU-27 for 2004-2006, EU-25 for 2002-2003-5 0 5 10 15 20 25
2002 2003 2004 2005 2006
0 5 10 15 20 25 30 35 40 45 50 Total
Switzerland Russia Norway Total (right-hand scale)
Japan: sharp increase in FDI inflows to the EU
Japan recorded the strongest increase over the period 2005-06, with
values jumping from a disinvestment of EUR-4.6bn to investments
of EUR13.6bn in 2006. This is the highest level since 2001 (55 %
rise between 2001 and 2006). Japan's share of total extra-EU FDI inflows picked up from -4 % to 9 %, placing it third among the top investors in the EU.
One of the transactions of Japanese investors in the EU was the acquisition of Pilkington Plc. (United Kingdom) by Nippon Sheet
Glass Co Ltd. for EUR1.9bn (12).
Chart 2.4
EU FDI inflows from Asia, EUR bn
EU-27 for 2004-2006, EU-25 for 2002-2003-8 -6 -4 -2 0 2 4 6 8 10 12 14
2002 2003 2004 2005 2006
-8 -3 2 7 12 17 22 27 32 37 Total
China Gulf Arabian Countries Japan Singapore Total (right-hand scale)
Direct investment in the EU
− Foreign direct investment 43
The same trend as for Japan was recorded in the volume of EU
inflows from Singapore, reversing from the EUR -2.0 bn of
disinvestment in 2005 to EUR 5.0 bn invested in the EU in 2006.
Mention can be made of two transactions by United Arab Emirates' investors in 2006 targeting the United Kingdom: acquisition of Travelodge Hotels Ltd. and Doncasters Plc. by Dubai International Capital (both for EUR 1 bn) (13).
Although with relatively small investments in absolute values, China also stepped up its investments between 2005 and 2006 (from a
disinvestment of EUR -0.1bn to an investment of EUR 2.2bn),
reaching 7 % of EU FDI inflows from Asia.
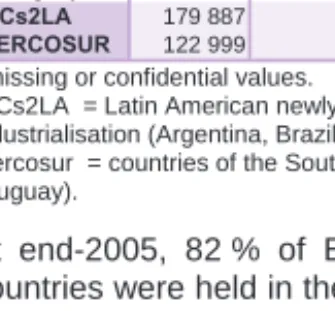
[image:46.595.31.254.228.524.2]EU FDI inward stocks – the strong capital inflows
resulted in a substantial increase in the stock of inward
FDI
Table 2.2
Geographical distribution of EU-27 FDI liabilities 2004-2006
2004 2005 2006
Extra-EU-27 1 732.5 1 823.2 2 057.3 100% Europe (non-EU) 339.4 402.4 457.4 22.2%
EFTA 269.8 298.8 324.7 15.8%
Switzerland 233.5 240.1 247.8 12.0%
Norway 28.6 45.9 63.0 3.1%
Russia 5.8 12.3 12.7 0.6%
Africa 14.7 19.5 23.5 1.1%
North African countries 3.1 3.6 4.4 0.2%
Other African countries 11.6 15.9 19.2 0.9% Republic of South Africa 4.5 4.2 4.0 0.2%
America 1 143.9 1 180.6 1 306.2 63.5% North American countries 907.7 937.3 1 019.9 49.6%
Canada 70.9 76.8 81.0 3.9%
United States of America 842.2 874.5 953.7 46.4% Central American countries 224.2 229.2 261.3 12.7%
Mexico 8.1 8.8 8.4 0.4%
South American countries 11.9 14.1 25.0 1.2%
Brazil 3.3 6.2 10.5 0.5%
Asia 160.9 162.6 208.7 10.1% Near and Middle East countries 18.6 21.5 35.2 1.7% Other Asian countries 142.3 141.1 173.5 8.4%
China 1.8 1.1 3.6 0.2%
Hong Kong 16.9 16.8 16.4 0.8%
Indonesia 0.4 -2.6 -3.3 -0.2%
India 0.7 2.5 3.2 0.2%
Japan 89.2 82.7 99.3 4.8%
Korea * 5.5 6.1 7.6 0.4%
Singapore 17.7 28.2 40.0 1.9%
Taiwan 0.8 0.6 0.8 0.0%
Oceania 37.9 23.5 17.8 0.9%
Australia 37.1 22.8 17.3 0.8%
New Zealand 0.7 1.0 1.8 0.1%
ACP countries ** 17.3 22.3 28.2 1.4%
Offshore financial centers *** 351.3 378.5 393.8 19.1% OECD countries (non-EU) 1 321.8 1 371.3 1 492.7 72.6% Stocks at end (EUR bn) Share (%)
in 2006
* Republic of South Korea.
** African, Caribbean and Pacific countries (Lomé convention). *** Offshore financial centres - refer to Annex 4.
44 Foreign direct investment –
Top 15 investor countries
Chart 2.5 illustrates the recent evolution of stocks held by the 15 largest partners, ranked according to growth rate between 2004 and 2006.
Chart 2.5
Growth rate of inward FDI stocks held in the EU for top 15
investors
-100% -50% 0% 50% 100% 150% 200% 250% 300% 350% Australia (17.3 bn)
Hong Kong (16.4 bn) Mexico (8.4 bn) Switzerland (247.8 bn) Japan (99.3 bn) USA (953.7 bn) Canada (81 bn) Korea* (7.6 bn) Lichtenstein (7.7 bn) Iceland (6.2 bn) Russia (12.7 bn) Norway (63 bn) Singapore (40 bn) Brazil (10.5 bn) Turkey (11.6 bn) Inward FDI stocks
at end-2006 (EUR bn)
2004-2006 Growth rate
*Republic of South Korea.
The highest rate of growth was recorded by Turkey, followed by Brazil and Singapore. This was due to the steady growth of stocks at the end of each period, even if the increase in absolute value was relatively small (rising from EUR 2.9 bn in 2004 to EUR 11.6 bn in 2006 for Turkey, from EUR 3.3 bn to EUR 10.5 bn for Brazil and from EUR 17.7 bn to EUR 40 bn for Singapore) when comparing with the United States.
United States, the main investor in the EU, recorded the biggest growth in absolute terms between the years 2004-06, investment stocks increasing from EUR 842.2 bn in 2004 to EUR 953.7 bn in 2006.
Direct investment in the EU
− Foreign direct investment 45
The investment stocks held in the EU by Switzerland, the second biggest investor, rose from EUR 233.5 bn in 2004 to EUR 247.8 bn in 2006, representing a growth rate of 6 %.
Major hosts of inward FDI in the EU: the United Kingdom
took a fifth of stocks in 2005
Table 2.3
Geographical distribution of EU-27 FDI liabilities, three main
recipients at end-2005, EUR bn
Stocks at end-2005 EU-27 KingdomUnited Netherlands France
Other EU Member States
Extra-EU-27 1 823.2 355.8 154.5 144.5 1 168.4
Europe (non-EU) 402.4 47.6 36.4 45.3 273.2
EFTA 298.8 36.5 21.4 42.5 198.4
Switzerland 240.1 31.6 17.7 39.8 151.1
Norway 45.9 1.6 3.7 2.5 38.1
Russia 12.3 : 0.1 0.5 :
Candidate countries* 7.5 : : 0.1 :
Africa 19.5 0.7 0.5 2.1 16.1
North African countries 3.6 0.2 0.1 1.0 2.2
Other African countries 15.9 0.5 0.4 1.1 13.9
Republic of South Africa 4.2 0.3 0.0 0.1 3.9
America 1 180.6 254.0 106.4 75.9 744.4
North American countries 937.3 : : 70.6 :
Canada 76.8 22.7 : 6.6 :
USA 874.5 218.5 73.2 64.0 518.8
Central American countries 229.2 12.6 30.9 4.5 181.3
Mexico 8.8 : 0.0 0.4 :
South American countries 14.1 : : 0.7 :
Brazil 6.2 : 0.8 0.3 :
Asia 162.6 35.2 10.7 18.4 98.3
Near and Middle East Countries 21.5 4.3 2.5 4.5 10.3
Other Asian countries 141.1 30.8 8.2 14.0 88.1
China 1.1 0.2 0.0 0.1 0.8
Hong Kong 16.8 : 0.1 1.2 :
Japan 82.7 15.3 7.0 11.4 49.0
Singapore 28.2 1.5 0.2 0.6 25.9
Oceania and Polar regions 23.5 18.3 0.6 1.4 3.2
Australia 22.8 18.0 0.6 1.1 3.2
* Turkey and Croatia. : missing or confidential data.
At the end of 2005, the United Kingdom was the main host of direct investments in the EU-27, holding 19.5 % of the EU-27 total.
The Netherlands was the second most attractive country of destination for investment, with 8.5 % of the EU-27 total, followed by France (7.9 %) and Germany (7.8 %). For all of these four countries, the largest partners at the end of 2005 were the United States, Switzerland and Japan. About 50 % of the EU FDI stocks held by the United States, Switzerland and Japan were hosted in the four countries in question.
The amount of EU FDI stocks held by the United States in the three main host countries totalled EUR 356 bn at the end of 2005, which is an increase of 21 % compared with the previous year. The United States' FDI stocks increased in all three countries between 2004 and 2005: by 31 % in the United Kingdom, 6 % in the Netherlands and 11 % in France.
The main host of FDI from Switzerland at the end of 2005 was
46 Foreign direct investment –
Switzerland's FDI stocks increased sharply in the United Kingdom, from EUR 20 bn to EUR 32 bn (57 %), but decreased by 2 % in the Netherlands.
Japan’s FDI stocks dropped in the United Kingdom (-9 %), in France
(-3 %) and decreased considerably in the Netherlands
(-35 %). The United Kingdom remained the main host of FDI stocks from Japan.
United Kingdom, Luxembourg and Germany attracted
most of the inward flows in 2006
Table 2.4
Geographical distribution of EU-27 FDI flows, three main
recipients in 2006, EUR bn
2006 Flows EU-27 United Kingdom
Luxem-bourg Germany
Other EU Member States
Extra-EU-27 157.1 57.1 25.2 15.0 59.9
Europe (non-EU) 25.8 9.2 4.8 1.1 10.8
EFTA 20.1 7.6 1.8 -0.2 10.8
Switzerland 16.7 6.9 1.4 -0.4 8.8
Norway 1.6 0.3 0.1 0.1 1.1
Russia -0.5 : -1.0 0.5 :
Candidate countries* -0.5 : -0.1 0.0 :
Africa 1.9 0.2 0.0 0.1 1.6
Republic of South Africa 0.8 0.1 0.0 0.2 0.5
America 102.4 27.7 18.1 12.0 44.5
North American countries 82.7 : 7.9 5.1 :
Canada 7.0 5.2 0.6 0.1 1.1
USA 75.6 20.5 7.3 5.0 42.8
Central American countries 17.8 1.9 10.0 6.7 -0.8
South American countries 1.9 : 0.2 0.2 :
Brazil 1.1 : 0.2 0.1 :
Asia 29.5 17.3 1.9 1.8 8.5
Near and Middle East countries 11.0 0.4 0.0 7.4 3.2
Other Asian countries 18.5 9.9 1.9 1.4 5.2
China 2.2 0.0 2.1 0.3 -0.2
Japan 13.6 5.4 0.0 0.6 7.6
Singapore 5.0 : -0.3 0.0 :
Oceania and Polar regions 4.5 2.7 0.3 -0.1 1.5
Australia 3.7 2.1 0.3 -0.1 1.3
* Turkey and Croatia. : missing or confidential data.
The United Kingdom was the largest recipient of direct investment flows in the EU-27, hosting 36 % of the EU-27 total in 2006.
Direct investment in the EU
− Foreign direct investment 47
Others 22% Luxembourg
20% France
8% Sweden
7% Germany
5% Belgium
5% Hungary
3%
United Kingdom
30%
United Kingdom confirms its leading position –
receiving 30 % of cumulated investment flows over the
period 2004-2006
The United Kingdom was the main destination of 2004-06 FDI cumulated inflows from outside the EU, followed by Luxembourg (20 %), France (8 %) and Sweden (7 %).
Luxembourg's importance as the second biggest destination of EU
FDI inflows is mainly explained by its role as a centre of financial
intermediation activities.
Chart 2.6
Share in EU-27 FDI inward flows from extra-EU
2004-2006
The largest cumulated 2004-2006 inflows among the 12
new Member States went to Hungary
Chart 2.7
Share of new MSs in FDI inflows from extra-EU27
Poland 17% Malta
8% Cyprus
7% Czech Republic 7%
Bulgaria 7%
Romania 7%
Latvia 3%
Hungary 42% Others
2%
48 Foreign direct investment –
recipient of that group, followed by Poland, Malta and the Czech Republic.
2.2 Income paid on inward EU FDI
Income paid on inward FDI shows steady growth since
2003: up 13 % in 2006
Income paid to foreign investors reached EUR 124 bn in 2006, increasing 13 % between 2005 and 2006. At the same time, the FDI stocks held by extra-EU countries experienced the same growth in
percentage terms, with an increase from EUR 1 823.2 bn to
EUR 2 057.3 bn (Table 2.2).
At EUR 65 bn, EU FDI income accruing to the United States in 2006 was 8 % higher than in 2005 and accounted for more than half (52 %) of total FDI income paid to extra-EU investor countries.
Switzerland, with EUR 21.5 bn (12 % more than in 2005), received 17 % of the total inward FDI income and was the second main recipient country.
Japan recorded the biggest growth of inward EU FDI income (55 %) between 2005 and 2006, reaching EUR 5.2 bn in 2006, which was 4 % of total inward FDI income.
Chart 2.8
Income paid on inward EU FDI, EUR bn
EU-27 for 2004-2006, EU-25 for 2002-20030 15 30 45 60 75 90
2002 2003 2004 2005 2006
0 50 100 150 200 250 Total
Europe (non-EU) Africa
America Asia
Direct investment in the EU
− Foreign direct investment 49
Stocks, income and yield: 6.8 % return on EU inward FDI
in 2006
The ratio (14) of income in a given period to stocks at the beginning of
that period is used as an indicator of FDI profitability (Chart 2.9). In 2006, the rate of return on FDI capital invested by extra-EU countries rose from 6.3 % to 6.8 %.
The geographical breakdown shows that America, Asia and Oceania registered increases in their rate of return during the period 2003-06.
Oceania's yield picked up more than three-fold to 10 % in 2006 while Africa's yield increased by 84 % to 5.1 %. America’s rate of return increased only by 4 %, reaching a yield of 7.1 %.
Europe (non-EU) and Africa observed a small dip in the rate of return in 2006.
Chart 2.9
Rate of return on FDI in the EU
EU-27 for 2004-2006, EU-25 for 20030 2 4 6 8 10 12
2003 2004 2005 2006
%
Europe (non-EU) America
Oceania and Polar regions Africa
Asia Extra EU-27
Chapter 3:
The role of emerging markets
− Foreign direct investment 53
Chapter 3: The role of emerging markets
EU FDI in emerging markets: increased flows in 2006
Data on the activity of European enterprises in emerging markets are monitored very closely by policy-makers and analysts. Despite the plunge in investment activity that had been recorded in those markets in previous years, EU FDI outflows to emerging markets showed a constant growth for the whole period under review - the only exception being 2003, when EU outflows reached their lowest point (EUR 34 bn).
EU outward flows to emerging markets increased in the subsequent years to reach EUR 73 bn in 2006, after increasing by 14 % from 2005 (EUR 64 bn). This increase was mainly due to a more than two-fold increase in the Mediterranean partner countries (MPCs) from EUR 7 bn in 2005 to EUR 15 bn in 2006, and lesser increases in Latin America and Central/Eastern European countries and Russia (CEECR).
This chapter examines the trend in direct investments made by the EU in Latin America, Far East Asia, MPCs and CEECR.
Emerging markets
• Latin America: Argentina, Brazil, Paraguay, Uruguay, Bolivia, Chile, Colombia, Costa Rica, Cuba, Ecuador, Guatemala, Honduras, Mexico, Nicaragua, Panama, Peru, El Salvador, Venezuela
• Far East Asia: Asia (15) excluding Japan
• Mediterranean partner countries (MPCs): Maghreb countries (Algeria, Morocco, Tunisia), Machrek countries (Egypt, Jordan, Lebanon, Palestinian Territory: Occupied, Syrian Arab Republic), Turkey, Israel
• Central/Eastern European countries and Russia (CEECR): Albania,
Bosnia and Herzegovina, Croatia, Macedonia: the former Yugoslav Republic of, Serbia, Montenegro, Russia, Belarus, Ukraine