Int. J. Electrochem. Sci., 12 (2017) 9141 – 9149, doi: 10.20964/2017.10.85
International Journal of
ELECTROCHEMICAL
SCIENCE
www.electrochemsci.org
Development of a Semiconductor-Based Electrochemical Sensor
for Interferon-γ Detection
Zhihui Chu, Haiyan Dai, Yingwei Liu and Yuhua Lin*
Department of Ophtalmology, Hongqi Hospital Affiliated to Mudanjiang Medical University, No.5 Tongxiang Rd, Aimin, Mudanjiang, Heilongjiang, 157000, P.R. China
*
E-mail: [email protected]
Received: 12 July 2017 / Accepted: 26 August 2017 / Published: 12 September 2017
This report described an excellent method for interferon gamma (IFNγ) detection using a label-free electrochemical impedance immunosensor. TiO2 NPs prepared using a simple hydrothermal strategy
were applied to the immobilization of the IFNγ monoclonal antibody. The relative increase in the impedance value was proportional to the logarithmic value of the IFNγ concentration (0.001 - 0.2 ng/mL), and the limit of detection (LOD) was calculated as 0.74 pg/mL. This work presented a facile, novel and highly sensitive strategy.
Keywords: Interferon gamma; Semiconductor; TiO2 NPs; Immunosensor; Electrochemical impedance
spectroscopy
1. INTRODUCTION
preadipocytes from GO-p secreted CXCL10 under IFNγ/TNFα stimulation. Hence IFNγ detection is of vital significance for the diagnostics of GO.
A label-free strategy based on electrochemical impedance spectroscopy (EIS) is proposed for the direct determination of immunospecies through the measurement of the impedance variation, since a majority of antigen and antibody molecules are electrochemically inert [9-11]. This strategy could decrease the cost of measurement by eliminating the need for extra materials (i.e., labelled antibodies) during determination. Furthermore, the EIS measurement functions as a non-destructive technique for characterizing the electrical characteristics of a biological interface [12-14]. Electrochemical impedance immunosensors have recently gained extensive attention in numerous biological reports [15-23].
In this report, a new electrochemical impedance immunosensor based on the immobilization of the IFNγ monoclonal antibody on a TiO2-modified electrode was initially proposed for highly sensitive
IFNγ detection. The sensitivity of our developed immunosensor was enhanced by the loading of proteins, which was achieved on the desirable, hydrophilic, and high capacity platform provided by TiO2. The relative increase of the impedance value corresponding to the specific reaction between the
IFNγ antibody and IFNγ was measured for the determination of IFNγ. The proposed strategy was confirmed to be highly sensitive, simple, and lower cost compared with the traditional measurement methods.
2. EXPERIMENTS
2.1. Chemicals
Absolute ethanol, hydrazine, and titanium(IV) bis(ammonium lactato)dihydroxide were commercially available from Sinopharm Chemical Reagent Co., Ltd. Purified monoclonal IFN-γ antibody and purified recombinant IFN-γ antigen were commercially available from the Shandong Agricultural Research Institute. Bovine serum albumin (BSA) and Nafion were commercially available from Sigma. The proportion of Na2HPO4 and NaH2PO4 was adjusted to obtain a 0.1 M pH 7.0
phosphate buffered saline (PBS buffer). All other chemicals were of analytical reagent grade and were prepared with distilled water.
2.2. Preparation of TiO2 nanoparticles
The synthesis of the TiO2 nanoparticles used in this study was performed based on the simple
hydrothermal technique proposed by Lui and co-workers [24] with several alterations. Acetic acid (20 mL) was mixed with titanium butoxide (2 mL) and stirred for 30 min. This step was followed by introducing the mixture into a Teflon-lined stainless-steel autoclave (50 mL), heating the mixture to 150 °C for 10 h, and finally, natural cooling the mixture to ambient temperature. Then, the product was centrifuged to collect the sediment, which was then washed. After heating to 500°C, TiO2
2.3. Preparation of IFNγ immunosensor
After successive polishing using an alumina slurry (0.03 and 0.05 μm), a glassy carbon electrode (GCE) was completely rinsed with distilled water, followed by sonication in nitric acid– water (1:1 v/v), ethanol and distilled water, and then air drying. Afterwards, the as-prepared TiO2 NPs
(2.0 mg) were dispersed in distilled water (1.0 mL) and ultrasonically stirred, followed by the addition of monoclonal IFNγ antibody (0.5 mL, 400 μg/mL) to the TiO2 NPs suspension (0.5 mL) (denoted
anti-IFNγ/TiO2/GCE). Then, 5.0 μL of the final mixed solution was dropped onto the pre-treated GCE
and allowed to stand for 12 h at 4 °C. This was followed by dropping Nafion (5.0 μL, 1.0%) onto the antibody-embedded GCE surface to prevent leakage of the IFNγ antibody from the TiO2 NP/GCE.
Subsequently, a BSA solution (10 mg/mL) was introduced at 37.5 °C for 0.5 h to block the non-specific sites (denoted as BSA/anti-IFNγ/TiO2/GCE). The IFNγ immunosensor was obtained after
washing with PBS three times and stored at 4 °C for further application (denoted IFNγ/BSA/anti-IFNγ/GCE).
2.4. Immunoassay measurement
A CHI 660D electrochemical workstation (CH Instruments, Shanghai, China) was used for all electrochemical measurements with a traditional triple-electrode configuration. The working, reference, and auxiliary electrodes consisted of the original or decorated GCE (diameter, 3 mm), a saturated calomel electrode (SCE), and a platinum wire, respectively. EIS and CV measurements were performed in PBS containing K3[Fe(CN)6]/K4[Fe(CN)6] (5.0 mM) and KCl (0.1 M), and the scan rate
was 100 mV/s. EIS measurements were conducted over a frequency range of 10−1 - 105 Hz at an amplitude of 10 mV for the applied sine wave potential.
3. RESULTS AND DISCUSSION
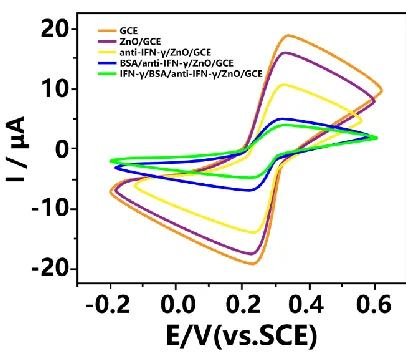
Figure 1. Cyclic voltammograms (CVs) of the original GCE, the TiO2-modified GCE, the
anti-IFNγ/TiO2-modified GCE, the BSA/anti-IFNγ/TiO2-modified GCE and the
IFNγ/BSA/anti-IFNγ-modified TiO2/GCE in a 0.1 M pH 7.0 PBS solution containing KCl (0.1 M) and
[image:3.596.191.394.515.692.2]
The performance of the electrode after each fabrication step was studied using CV measurements. The Fe(CN)63−/4− redox reaction at the original GCE, the TiO2-modified GCE, the
anti-IFNγ/TiO2-modified GCE, the BSA/anti-IFNγ/TiO2-modified GCE and the
IFNγ/BSA/anti-IFNγ/TiO2-modified GCE was characterized via the CVs shown in Fig. 1. Compared to the original
GCE, a gradual decrease in the redox current was observed after the stepwise modifications, indicating an impeded electron transfer process between the surface of the GCE and the Fe(CN)63−/4− probe.
Particularly, the charge transfer was blocked to a greater degree at the GCE after the immobilization of BSA and the IFNγ antibody, suggesting that the current of the cathodic and anodic peaks was sharply decreased. The introduction of BSA improved the interaction between the IFNγ antibody and TiO2
because sufficient space for IFN-γ binding was secured by competitive immobilization [25].
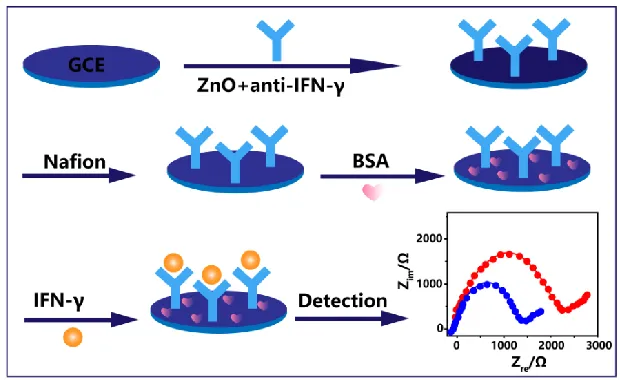
In Fig. 2, the strategy for IFNγ determination is presented in detail. After incubation with the IFNγ antigen (varying concentrations) for 80 min at 37.5 °C, the IFNγ immunosensor was carefully washed with PBS. The Rct value reflects the state of the electrode surface. After the formation of an
aptamer monolayer with pentanethiol on the electrode, Rct greatly increased compared to that of the
bare electrode since the negative charge on the phosphate backbone and the steric hindrance of IFNγ interfered with the movement of the [Fe(CN)6]3−/4− ions [26]. The relative variation in the impedance
of the immunosensor was investigated in PBS solution (0.1 M, pH 7.0) that contained KCl (0.1 M) and 5 mM K3[Fe(CN)6]/K4[Fe(CN)6].
Figure 2. Schematic illustration of the immunosensor preparation process and the immunoassay of IFNγ.
The impedance variations between the modification steps were determined using EIS measurements. In the Nyquist plot of an impedance spectrum, the semicircle diameter can be used for the quantification of the electron transfer resistance (Rct). Faradaic impedance spectra were recorded
[image:4.596.143.453.404.594.2]
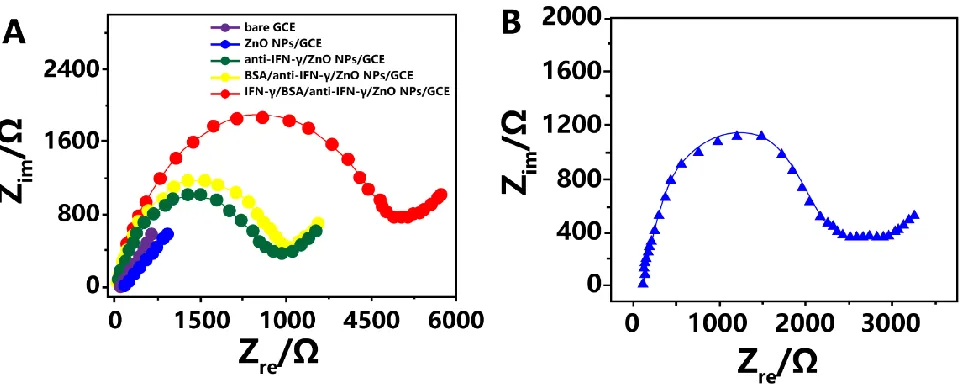
therefore, the Rct value increased [27]. The original GCE exhibited an insignificant semicircle,
suggesting that the transfer resistance was low. An insignificant increase in Rct was observed after
modification of the GCE with TiO2 NPs, suggesting that the TiO2 NPs were attached to the surface of
the electrode. An obvious increase in Rct was observed upon loading the IFN-γ antibody onto the TiO2
NP/GCE surface, implying that the antibody was successfully loaded onto the TiO2 NPs. An additional
increase in Rct was observed after the blockage of the IFN-γ antibody-immobilized electrode using
BSA. During the determination of the IFNγ antigen concentration using the immunosensor, a similar increase was also recorded, possibly due to the significant hindrance of the diffusion of the ferricyanide probe to the electrode surface by the protein layer formed on the electrode surface.
An FRA software (Autolab)-based Randles equivalent circuit was used for fitting the impedance data. As showed in Fig. 3B, the measured spectra were fit to the equivalent circuit and a modified Randles equivalent circuit, suggesting the desirable consistency between the measurement system and the circuit model throughout the tested frequency range. The circuit was comprised of the Warburg impedance (ZW), electron transfer resistance (Rct), solution resistance (Rs), and interfacial
double layer capacitance (Cdl) between a solution and an electrode. Ordinarily, ZW represents the
diffusion properties of the redox probe in solution, while Rs corresponds to the bulk features of the
electrolyte solution. Both parameters were unaffected by surface modification. These increases of Rct
values correspond to the loading of IFN-γ on the aptamer probe located on the electrode. Thus, these results clearly show that IFN-γ could be sensitively detected using this aptamer-based electrochemical impedance spectroscopy strategy [28]. The impedance data were fit the a Randles equivalent circuit using the constant phase element (CPE) rather than the classical capacitance because the Cdl electrode/electrolyte interface in this work was not a simple capacitor.
Figure 3. (A) Nyquist plots of the original GCE, the TiO2 NP-modified GCE, the anti-IFNγ/TiO2
NP-modified GCE, the BSA/anti-IFNγ/TiO2 NP-modified GCE and the IFNγ/BSA/anti-IFNγ/TiO2
NP-modified GCE in 0.1 M pH 7.0 PBS solution that contained KCl (0.1 M) and K3[Fe(CN)6]/K4[Fe(CN)6] (5.0 mM). Scan rate: 50 mV/s. (B) Fitted and experimental Nyquist
[image:5.596.60.541.479.671.2]
The interface characteristics of the electrode would not vary upon the capture of the target protein on the TiO2 NPs/GCE, further causing a variation in Rct. Hence, optimization of the parameters
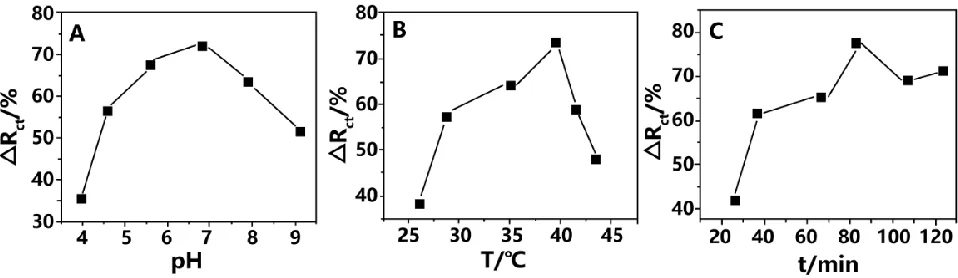
that affected the antibody-antigen reaction was carried out, which included the incubation time, incubation temperature, and solution pH. The effect of the solution pH on the relative variation in Rct during the antigen-antibody reaction in the presence of IFNγ (0.01 ng/mL) is presented in Fig.
4A. An increase in ΔRct was observed as the solution pH increased in the range of 4.0 - 9.0 and then
reached a plateau at a pH of 7.0. Therefore, pH 7.0 was selected as the optimized pH value for the immunoreaction. We also studied the effect of the incubation temperature in the range of 25 to 45 °C in the presence of IFNγ (0.01 ng/mL). Under two different pH conditions, a negative peak representing the helices of IFN-γ was commonly detected. These results confirm that the conformation of the IFN-γ antibody did not significantly change at high pH [29]. When the incubation temperature was 37.5 °C, the relative change in Rct reached the maximum value (Fig. 4B). In addition, the Ag–Ab combination
was significantly influenced by the incubation time; hence, we investigated the effect of the reaction time on the ΔRct value in the presence of IFNγ (0.01 ng/mL), as showed in Fig. 4C. An increase in the
[image:6.596.61.540.409.548.2]electrochemical response to the binding reaction was observed as the incubation time was prolonged, and then the response remained stable when the incubation time exceeded 80 min. Based on these results, the optimum incubation time, incubation temperature, and pH were determined to be 80 min, 37.5 °C, and 7.0, respectively, to achieve optimized IFNγ detection.
Figure 4. Effect of (A) solution pH, (B) incubation temperature and (C) incubation time on the relative variation in Rct in the presence of IFNγ (0.01 ng/mL).
Our developed immunosensor was incubated with IFNγ at varying concentrations under the optimized conditions. The corresponding Nyquist plots of the impedance spectra are presented in Fig. 5A. As the IFNγ concentration increased, an increase in the semicircle diameter in the Nyquist plot was observed. The logarithm of IFNγ was found to be linearly related to the relative variation in Rct, as
[image:7.596.96.497.81.247.2]
Figure 5. (A) Faradaic impedance spectra of our developed immunosensor after incubation with IFNγ (0.001, 0.005, 0.01, 0.1 and 0.2 ng/mL) in a PBS solution. (B) Calibration curve for IFNγ.
Table 1. Comparison of the major characteristics of electrochemical sensors used for the detection of AFP.
Electrode Linear detection range Detection limit Reference 5’-thiol-modified aptamer probe
/gold electrode
- 1 pM [30]
Sandwich enzyme immunoassay - 25 pg/mL [31]
Aptamer-based array 1–500 ng/mL 1.3 ng/mL [32]
IFNγ/BSA/anti-IFNγ/TiO2 NPs 0.0001-0.1 ng/mL 0.74 pg/mL This work
Intra- and inter-assay coefficients of variation (CVs) were used to assess the reproducibility of the developed immunosensor in IFNγ detection. The intra-assay CV obtained after six replicative measurements in the presence of IFNγ (0.01 ng/mL) was 3.4%, suggesting that the detection of the IFNγ immunosensor was highly reproducible. The inter-assay CV for six immunosensors prepared in six batches in the presence of IFNγ (0.01 ng/mL) was 3.2%, suggesting that the preparation of the IFNγ immunosensor was highly reproducible. This IFNγ immunosensor was stored in a refrigerator at 4 °C for further use. Our developed immunosensor showed no significant variation in the relative change in Rct after being stored for 30 days. It is obvious that the as-prepared TiO2 NPs provided a
desirable microenvironment, thus helping the immobilized antibody molecules to maintain their bioactivity.
Table 2. Recoveries of IFNγ by the proposed electrochemical impedance immunosensor.
Sample Added (ng/mL) Found (ng/mL) Recovery (%) RSD (%)
1 0.005 0.0052 104 2.5
2 0.01 0.0108 108 3.1
3 0.05 0.0504 100.8 1.5
4 0.1 0.0983 98.3 0.7
4. CONCLUSIONS
This report presented a highly sensitive IFNγ detection method using a TiO2 NP-based
electrochemical impedance immunosensor prepared from a simple hydrothermal strategy. The IFNγ monoclonal antibody was immobilized on the TiO2 NP/GCE, contributing to the successful preparation
of an effective immunosensor. Our developed immunosensor was easy to use, highly sensitive, stable, reproducible, and specific. In addition, this immunosensor possessed a broad linear range, was highly accurate and could be used for the determination of IFN-γ in real specimens, as shown in the recovery test.
References
1. A. Antonelli, M. Rotondi, S. Ferrari, P. Fallahi, P. Romagnani, S. Franceschini, M. Serio and E. Ferrannini, The Journal of Clinical Endocrinology & Metabolism, 91 (2006) 614.
2. M. de Carli, M. D'Elios, S. Mariotti, C. Marcocci, A. Pinchera, M. Ricci, S. Romagnani and G. del Prete, The Journal of Clinical Endocrinology & Metabolism, 77 (1993) 1120.
3. J. Aniszewski, R. Valyasevi and R. Bahn, The Journal of Clinical Endocrinology & Metabolism, 85 (2000) 776.
4. P. Romagnani, M. Rotondi, E. Lazzeri, L. Lasagni, M. Francalanci, A. Buonamano, S. Milani, P. Vitti, L. Chiovato and M. Tonacchera, The American Journal of Pathology, 161 (2002) 195. 5. A. Antonelli, M. Rotondi, P. Fallahi, P. Romagnani, S. Ferrari, A. Buonamano, E. Ferrannini and
M. Serio, The Journal of Clinical Endocrinology & Metabolism, 89 (2004) 5496.
6. A. Antonelli, M. Rotondi, P. Fallahi, P. Romagnani, S.M. Ferrari, A. Paolicchi, E. Ferrannini and M. Serio, European Journal of Endocrinology, 152 (2005) 171.
7. . Garc a-L pez, D. Sancho, F. Sánchez-Madrid and M. Marazuela, The Journal of Clinical Endocrinology & Metabolism, 86 (2001) 5008.
8. M. Rotondi, E. Lazzeri, P. Romagnani and M. Serio, Journal of Endocrinological Investigation, 26 (2003) 177.
9. Y. Lin, J. Luo, C. Chiou, C. Yang, C. Wang, C. Chou and C. Lai, Sensors and Actuators B: Chemical, 186 (2013) 374.
10.P. Kumar, S. Maikap, A. Prakash and T. Tien, Nanoscale Res Lett, 9 (2014) 179. 11.Y. Lin and P. Peng, Anal. Chim. Acta., 869 (2015) 34.
12.Y. Lin, S. Wang, M. Wu, T. Pan, C. Lai, J. Luo and C. Chiou, Biosensors and Bioelectronics, 43 (2013) 328.
13.T. Pan, C. Wang, Y. Huang, W. Weng and S. Pang, Journal of The Electrochemical Society, 162 (2015) B83.
606.
15.S. Schusser, A. Poghossian, . Bäcker, . Krischer, . Leinhos, P. Wagner and .J. Schöning, Sensors and Actuators B: Chemical, 207 (2015) 954.
16.M. Huang, H. Li, H. He, X. Zhang and S. Wang, Analytical Methods, 8 (2016) 7413.
17.K. Miyamoto, K. Hayashi, A. Sakamoto, C. Werner, T. Wagner, M. Schöning and T. Yoshinobu, Sensors and Actuators B: Chemical, 248 (2017) 1006.
18.R. Packard, X. Zhang, Y. Luo, T. Ma, N. Jen, J. Ma, L. Demer, Q. Zhou, J.W. Sayre and R. Li, Annals of Biomedical Engineering, 44 (2016) 2695.
19.W. Weng, C. Wang, S. Pang and T. Pan, Journal of The Electrochemical Society, 163 (2016) B445. 20.S. Beging, . Leinhos, . Jablonski, A. Poghossian and .J. Schöning, Physica Status Solidi (a),
212 (2015) 1353.
21.A. Poghossian, . Weil, A.G. Cherstvy and .J. Schöning, Anal Bioanal Chem, 405 (2013) 6425. 22.T. Pan and C. Tan, Journal of Materials Chemistry C, 4 (2016) 7436.
23.S. Patskovsky, V. Latendresse, A. Dallaire, L. Doré-Mathieu and M. Meunier, The Analyst, 139 (2013) 596.
24.G. Lui, J. Liao, A. Duan, Z. Zhang, M. Fowler and A. Yu, Journal of Materials Chemistry A, 1 (2013) 12255.
25.M. Dijksma, B. Kamp, J. Hoogvliet and W. Van Bennekom, Analytical Chemistry, 73 (2001) 901. 26.A. Schmittel, U. Keilholz and C. Scheibenbogen, Journal of Immunological Methods, 210 (1997)
167.
27.M. Reynard, D. Turner and C. Navarrete, International Journal of Immunogenetics, 27 (2000) 241. 28.M. Santin, L. Munoz and D. Rigau, PloS one, 7 (2012) e32482.
29.Y. Zhang, B. Zhang, X. Ye, Y. Yan, L. Huang, Z. Jiang, S. Tan and X. Cai, Materials Science and Engineering: C, 59 (2016) 577.
30.K. Min, M. Cho, S. Han, Y. Shim, J. Ku and C. Ban, Biosensors and Bioelectronics, 23 (2008) 1819.
31.J. Rothel, S. Jones, L. Corner, J. Cox and P. Wood, Australian Veterinary Journal, 67 (1990) 134. 32.Y. Chen, T. Pui, P. Kongsuphol, K. Tang and S. Arya, Biosensors and Bioelectronics, 53 (2014)
257.