Research & Innovation policy
Innovation Union
Competitiveness
report
2011
“Innovation is as essential to sustainable growth
and jobs as water is to life. Economies that do
not innovate will wither away. The European
Commission is asking Member States to act on it in
their Europe 2020 National Reform Programmes, by
building on strengths and addressing weaknesses.
The Innovation Union Competitiveness report
provides them economic evidence and analysis to
underpin EU and national policy making in support
of Innovation Union. Public and private stakeholders
will also get in a single compendium valuable
insights to design winning innovation strategies
within Europe and for the global market”
Máire Geoghegan-Quinn
European Commissioner for Research, Innovation
and Science
Price (excluding VAT)
in Luxembourg: EUR 55
In
no
va
tio
n U
ni
o
n
C
o
mp
etitiv
en
es
s r
ep
o
rt
20
11
11
-E
N
-C
EUROPEAN COMMISSION
Directorate-General for Research and Innovation Directorate C — Research and Innovation Unit C.6 — Economic analysis and indicators
E-mail: [email protected] Contact: Pierre Vigier, Johan Stierna
Innovation Union Competitiveness report
2011
Directorate-General for Research and Innovation
Research and Innovation
LEGAL NOTICE
Neither the European Commission nor any person acting on behalf of the Commission is responsible for the use which might be made of the following information.
The views expressed in this publication are the sole responsibility of the author and do not necessarily reflect the views of the European Commission.
EUROPE DIRECT is a service to help you find answers to your questions about the European Union
Freephone number (*):
00 800 6 7 8 9 10 11
(*) Certain mobile telephone operators do not allow access to 00 800 numbers or these calls may be billed
More information on the European Union is available on the Internet (http://europa.eu).
Cataloguing data can be found at the end of this publication.
© Shutterstock, 2011
Luxembourg: Publications Office of the European Union, 2011
ISBN 978-92-79-14541-4 doi 10.2777/87066
© European Union, 2011
Reproduction is authorised provided the source is acknowledged.
Printed in France
Foreword
The main messages presented in the executive summary of the Innovation Union Competitiveness report confirm that Europe is in a state of "Innovation emergency" which makes the building of an Innovation Union essential for the success of the Europe 2020 strategy for growth and jobs.
Most importantly, this analysis is substantiated and enriched by a solid body of evidence. This report constitutes the most comprehensive publication to date of statistical data and economic analysis on research
and innovation from a European perspective. It brings together in a single document the information needed to properly understand the innate complexity of the European economy from an innovation point of view.
For each theme, a dedicated chapter provides the key data at European and at country level and outlines the strategic and operational issues that need to be addressed. The report aims to be a practical tool to help policy makers and stakeholders in regions, in Member States and Associated Countries to evaluate the situation in their country and to understand the contribution that building the Innovation Union and the European Research Area can make to tackling their economic challenges and addressing their citizens' concerns.
The report and the annexed country profiles will also support the design and development of ambitious and realistic national or regional innovation strategies, consistent with each country's particular strengths, economic structure and policy objectives as well as with an overall European view of the common challenges before us. While a great deal of detailed information is presented, the report is user-friendly and allows the reader to quickly find the information most relevant to his or her interests.
We are now at the start of the ambitious long term work to create a sustainable Innovation Union. The size of the challenge is all the greater because we face it at a time when most Member States are confronted with strong budgetary constraints. The solution is smarter investment in growth-enhancing policies that get excellent value from the money invested, prioritising the most cost-effective reforms that help develop new markets for innovative products and services. This approach will help create the conditions for a smart and creative economy, based on knowledge and on innovation, bringing concrete benefits to everybody.
Faced with an innovation emergency, now is the time to act. This report provides an excellent evidence basis for action and constitutes a reference-point to measure the progress that we'll accomplish together in the next decade. It is my sincere hope that you will find it useful for achieving our common goal: the Innovation Union.
Acknowledgements
and Editors’ Note
The first edition of the Innovation Union Competitiveness (IUC) report has been published, at the request of Maíre Geoghegan-Quinn, member of the European Commission in charge of research, innovation and science, by the Directorate General for Research and Innovation, Director General Robert Jan Smits. Directorate C, Research and Innovation policy, under the direction of Clara de la Torre, was responsible for producing the report.
This IUC report was prepared under the leadership and policy guidance of Pierre Vigier, Head of Unit for Economic Analysis and Indicators. Johan Stierna was the overall coordinator and was responsible for the analytical perspective of the report. The authors of individual chapters or sections are, in alphabetical order: Maria Herminia Andrade, Beñat Bilbao Osorio, Jacques Bonin, Matthieu Delescluse, Benedikt Herrmann, Carmen Marcus, Carmen Mena Abela, Johan Stierna, Giuseppe Veltri, Pierre Vigier, and Werner Wobbe. Beñat Bilbao Osorio reviewed the economic analysis, Matthieu Delescluse supervised the indicators’ consistency, Dermot Lally prepared the statistics, Fotini Chiou assisted in the publication process and Jolanta Chmielik designed the maps. Mihaela Varnav assisted in the overall production of the report and Eleonora Mavroeidi assisted in the data analysis.
The report has benefitted from valuable analytical and statistical contributions from several Commission services, in particular by DG Joint Research Centre IPTS (which also contributed with chapter 3 in Part III), DG Eurostat, DG Regional Policy, DG Communication, DG Education and Culture, DG Enterprise, DG Internal Market, DG Information Society, the European Research Council and other units of DG Research and Innovation. The authors of this report gratefully acknowledge critical advice, external peer review and analytical input given by Isidro Aguillo, Alexandros Arabatzis, Rémi Barré, Patrick Brenier, Paraskevas Caracostas, Emmanuelle Cauwe, Giorgio Clarotti, Laura De Dominicis, Janine Delahaut, Nicole Dewandre, Susana Elena Perez, Ana Fernandez Zubieta, Peter Fisch, Dominique Foray, Luke Georghiou, Tassos Giannitsis, Bronwyn Hall, Jennifer Harper, Luisa Henriquez, Hugo Hollanders, Branco Huc, Morten Kroger, Jos Leijten, Petros Macridis, Franco Malerba, Belmiro Martins, Patrick McCutcheon, Fulvio Mulatero, Tomas Niklasson, Erkki Ormala, Marianne Paasi, Adian Pascu, Daniel Pasini, Dimitrios Pontikakis, Celine Ramjoue, Pierre Regibeau, Helmar Rendez, Lorenza Saracco, John Smith, Lena Tsipouri, Pierre Valette, Rene van Bavel, Ludger Viehoff, Virginia Vitorino, Marco Weydert, Peter Whitten, and Emily Wise.
The structure of this report reflects the main policy developments in the EU: ensuring investment in research and innovation, construction of the European Research Area and effective outcomes for economic competitiveness and for addressing societal challenges. The report also contains an overall benchmarking of the EU with other world R&I centres, a more experimental section presenting new perspectives on country grouping for mutual learning, an evidence base for smart specialisation, and an analysis of citizens’ trust in science and technology. Finally, the report reviews strengths and weaknesses in research and innovation in all EU Member States and six Associated Countries. More information can be found at the website, ec.europa.eu/iuc2011, together with the full report, the executive summary in all EU official languages, country fact sheets and all underlying statistical data. The cut-off date for data from Eurostat and OECD was March 2011.
Table of Contents
Foreword I-I
Acknowledgements and Editors’ Note
I-II
ExECUTIvE SUMMARy
I-1
Introduction
I-1
Key findings
I-3
OvERALL PICTURE:
EUROPE'S COMPETITIvE POSITION IN RESEARCh ANd
INNOvATION - ACTING IN ThE NEw GEOGRAPhy OF
KNOwLEdGE
I-15
ChAPTER 1
Europe’s competitive position in research and innovation
I-16
ChAPTER 2
Investments in knowledge and human resources
I-21
ChAPTER 3
Towards the construction of a European Research Area (ERA)
open to the world
I-29
ChAPTER 4
Innovation for a knowledge economy and societal challenges I-35
ANALySIS:
PART I: INvESTMENT ANd PERFORMANCE IN R&d -
INvESTING FOR ThE FUTURE
I-45
ChAPTER 1
Progress towards the EU and national R&d intensity targets
I-46
ChAPTER 2
Effect of the economic crisis on R&d investment
I-61
ChAPTER 3
Public investment in research and education
I-74
ChAPTER 4
Investing in human resources for R&d
I-89
ChAPTER 5
Business sector investment in R&d
I-108
ANALySIS:
PART II : A EUROPEAN RESEARCh AREA OPEN TO ThE
wORLd - TOwARdS A MORE EFFICIENT RESEARCh ANd
INNOvATION SySTEM
I-157
ChAPTER 1 Strengthening public research institutions
I-158
ChAPTER 2 Knowledge transfer and public–private cooperation
I-199
ChAPTER 3 Addressing the gender gap in science and technology
I-214
ChAPTER 4 Optimising research programmes and infrastructures
I-240
ChAPTER 5 Mobility of researchers and human resources
I-271
ChAPTER 6
Free movement of science and technology across Europe and
beyond
I-285
ANALySIS:
PART III: TOwARdS AN INNOvATIvE EUROPE -
CONTRIBUTING TO ThE INNOvATION UNION
I-313
ChAPTER 1 Fast-growing innovative firms
I-314
ChAPTER 2 Framework conditions for business R&d
I-328
ChAPTER 3 Structural change for a knowledge-intensive economy
I-376
ChAPTER 4 Achieving economic competitiveness
I-396
ChAPTER 5 Addressing societal challenges
I-412
NEw PERSPECTIvES:
SMARTER POLICy dESIGN – BUILdING ON dIvERSITy
I-433
ChAPTER 1
diversity of European countries
I-434
ChAPTER 2
Thematic diversity : specialisation at national and regional level
I-440
ChAPTER 3
Trust and dialogue between science and society
I-453
AT – Austria
II-2
BE - Belgium
II-10
BG - Bulgaria
II-18
hR - Croatia
II-26
Cy - Cyprus
II-34
CZ - Czech Republic
II-42
dK - denmark
II-50
EE - Estonia
II-58
FI - Finland
II-66
FR - France
II-74
dE - Germany
II-82
EL - Greece
II-90
hU - hungary
II-98
IS - Iceland
II-106
IE - Ireland
II-114
IL - Israel
II-122
IT – Italy
II-128
Lv - Latvia
II-136
LT –Lithuania
II-144
LU - Luxembourg
II-152
MT - Malta
II-160
NL - Netherlands
II-168
NO - Norway
II-176
PL - Poland
II-184
PT - Portugal
II-192
RO - Romania
II-200
SK - Slovakia
II-208
Sl - Slovenia
II-216
ES - Spain
II-224
SE - Sweden
II-232
Ch - Switzerland
II-240
TR - Turkey
II-248
UK - United Kingdom
II-256
OvERALL REvIEw OF EU MEMBER STATES ANd
ASSOCIATEd COUNTRIES
II-1
ANNExES A-1
Index of Themes and Sectors
A-2
Literature references
A-3
First answer Total answers
%
Innovation Union Competitiveness Report 2011
Source: DG Research and Innovation
Data: DG Communication; Eurobarometer 73, Spring 2010
0 10 20 30 40 50 60 70 Refocus research on new challenges such as climate
change, energy and resource efficiency
Encourage cooperation between researchers
Give more financial support to research
66 38
61 25
60 29
ExEcutivE summary
FIGURE 1
Opinion of European citizens on the three main priorities
for Innovation in Europe, 2010
Introduction
Against a backdrop of rising societal concerns and lagging economic performance, the European Union launched in 2010 the Europe 2020 strategy1
to guide Europe’s economic recovery and present a comprehensive agenda towards becoming a more competitive, sustainable and inclusive economy. At the core of this strategy, the Innovation Union Flagship Initiative2 sets out how Europe will tackle the ‘innovation
emergency’ it is facing, through a strategic approach integrating research and innovation instruments and actors. It commits the EU and Member States to put in place framework conditions to make the business environment more innovation friendly, facilitate access to private finance, complete the European Research Area, and address major societal challenges.
1 COM (2010) 2020.
2 Europe 2020 Flagship Initiative Innovation UnionCOM (2010) 546 final. The Europe 2020 strategy also includes other Flagship initiatives enhancing competitiveness: “an Industrial Policy for the Globalisation Era”, “the Agenda for New Skills and Jobs”, “the Digital Agenda”.
I-2
The Innovation Union flagship initiative calls for setting in place a strong monitoring mechanism for measuring innovation performance and progress towards Europe’s shared objectives. This echoes Treaty provisions3
regarding periodic monitoring and evaluation in that domain.
To this end, a three-tier monitoring framework has been developed constituted of:
headline objectives: where do we want to go? One of the five headline objectives in the Europe 2020 strategy is to improve the conditions for research and development, in particular with the aim of raising combined public and private investment levels in this sector to 3 % of GDP. In complement, the European Council of 4 February 2011 called for the development of a new, single integrated indicator to allow a better monitoring of progress in innovation. The European Commission, in cooperation with the National Statistical offices and with the OECD, is currently developing such an indicator, focusing on the share in the employment of the fast-growing innovative enterprises.
A performance scoreboard: where do we stand? The Innovation Union Scoreboard (IUS) was published in early 2011 and will be updated annually to provide comparative benchmarking of EU and Member State performance against 25 core R&I indicators and, for 12 of them, against major international partners.
An analytical strategic report: what are the causes and remedies for insufficient performance? Every two years, the Innovation Union Competitiveness report (IUC) will provide an in-depth statistical and economic analysis covering the main features of an efficient and socially effective research and innovation system. It will constitute a key tool for evidence-based policy making in the context of the Innovation Union.
The present Innovation Union Competitiveness report monitors progress towards the EU and national R&D headline targets and provides economic evidence and analysis to underpin EU and national policy making in support of Innovation Union. It aims to complement the
3 Article 181, §2: "In close cooperation with the Member States, the Commission may take any useful initiative to promote the coordination referred to in paragraph 1, in particular initiatives aiming at the establishment of guidelines and indicators, the organisation of exchange of best practices, and the preparation of the necessary elements for periodic monitoring and evaluation."
overall review of Europe 2020 targets in the European Commission Annual Growth Survey by offering a deeper perspective on R&D intensity targets at EU and national level and presenting evidence on the dynamics of knowledge-intensive firms and other aspects of innovation. The report also extends and complements the Innovation Union scoreboard indicators to address the whole cycle of innovation, including the impact of research and innovation on raising competitiveness and tackling societal challenges.
Key findings
Investing for the future
1. The EU is slowly advancing towards its 3 % R&D target - but there is a widening gap between the EU and its world competitors notably due to weaker business R&D investment
Investment in research and innovation is a key driver of growth and innovative ideas for the future of Europe. This is why increasing investment in R&D is one of the five priorities of the Europe 2020 strategy.
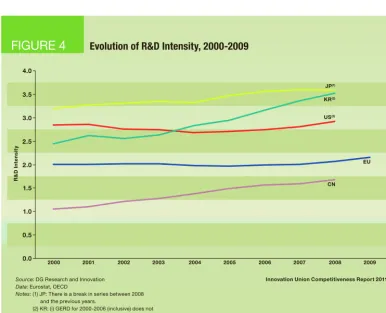
During the period 2000-2007, the EU R&d intensity stagnated as a result of a parallel increase in GDP and Gross Expenditure on R&D (GERD). More recently, EU R&D intensity has grown from 1.85 % of GDP in 2007 to 2.01 % in 2009 as the result of a decrease in GDP and widespread budgetary prioritisation of public R&D funding combined with the resilience of private investment in R&D. This can be attributed to the positive impact of the Lisbon agenda and national reforms initiated starting in 2005.
Between 2000 and 2009, R&D intensity progressed in 24 Member States with acceleration in the period 2006-2009 in a majority of Member States. Despite this progress, most Member States in 2009 were still far short of the national 2010 R&D targets they set for themselves in 2005. In 2010, nearly all the EU Member States set new R&D targets for 2020, which are generally ambitious but achievable.
Between 1995 and 2008, total research investment in real terms rose by 50 % in the EU. However, performance was higher in the rest of the world, as the world economy became more knowledge-intensive. During the same period, the United States increased its total research investment in real terms by 60 %, the four most knowledge intensive countries in Asia (Japan, South Korea, Singapore and Taiwan) by 75 %, the BRIS countries (Brazil, Russia, India, South-Africa) by 145 %, China by 855 % and the rest of the world by almost 100 %. The result is that a rapidly growing share of R&D activities in the world is being carried out outside
Europe. In 2008, less than a quarter (24 %) of the total world R&d expenditure was performed in the EU compared to 29 % in 1995. On the current trend, China is set to overtake the EU by 2014 in terms of intensity of R&D expenditure.
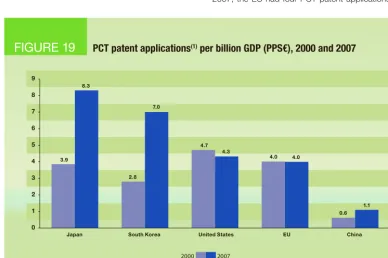
EU under-investment in R&D is most visible in the business sector where Europe is falling further behind the United States and the leading Asian economies. Relative to GdP, business invests twice more in Japan or in South Korea than in Europe4.
The business R&D intensity gap in the EU is due to two main reasons: (i) the EU has a smaller and decreasing share of high-tech manufacturing sectors in its economy than the United States and (ii) these sectors are less research-intensive in the EU than in the United States. This is largely attributable to the framework conditions in place in Europe which are less favourable to investing and attracting investors than, for instance, in the United States. The slow speed of structural change in Europe makes also investment in R&D in Europe less likely to develop in fast growing sectors. As a result, the average annual growth rates of business R&D intensity in Japan and South Korea were much higher than those of the EU. Chinese firms are also becoming increasingly R&D intensive, with the result that since 2000 business R&d intensity in China has been growing 30 times quicker than in Europe to reach a level of 1.12 % in 20085.
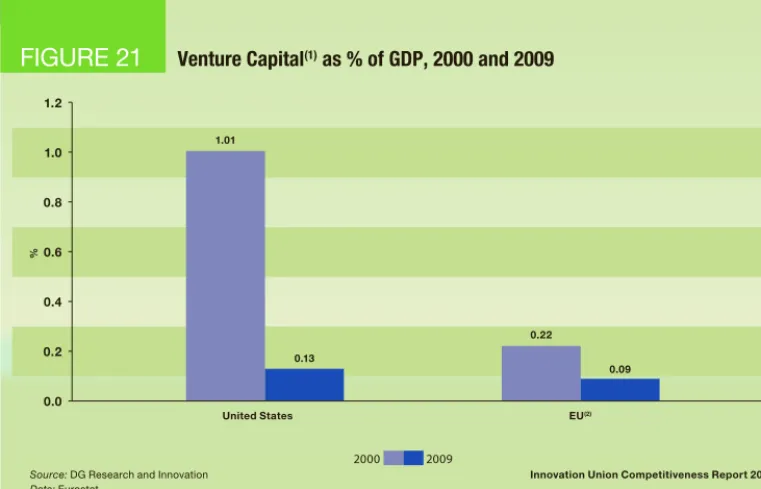
Major obstacles to be tackled include access to finance, e.g. venture capital, the much higher cost of patenting in Europe particularly for SMEs, and the framework conditions required in order to enhance knowledge-intensive entrepreneurial activities.
4 In the last decade, EU business expenditure on R&D has indeed stagnated at around 1.20 % of GDP (1.25 % in 2009), a much lower level than in the United States (2.01 % in 2008), South Korea (2.45 % in 2007) and Japan (2.68 % in 2007).
I-4
2. The economic crisis has hit business R&D investments hard. However, as part of a counter-cyclic effort, many European countries are maintaining or increasing their levels of public R&D funding
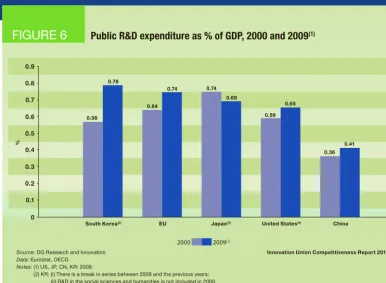
Despite the economic crisis, there was a positive continuity in public R&D funding trends in 2009 and 2010, with sustained investment rates in many Member States. Seventeen Member States were able to maintain or increase their R&D budgets in nominal terms in 2009 compared to 2008, and only seven Member States decreased their R&D budgets over the same period6. In
2010, sixteen Member States planned to increase their R&d budgets. However, the preliminary data available shows that, relative to GDP, R&D budgets decreased in more countries in 2010 than in 2009 and this trend seems to be maintained in 2011. These are worrying signs, since evidence from previous crises shows that maintaining public R&D funding during an economic downturn is key to ensuring a more rapid return to sustained economic growth.
While the crisis has had a stronger impact on private R&D investment than on public funding, R&d spending by firms headquartered in the EU fell in 2009 half less than that by US firms (-2.6 % and -5.1 % respectively). This impact was greater in the automotive and IT hardware sectors than in the electronic & electrical equipment and the health sector (which actually posted an increase in R&D investment in 2009). However, as a whole it is noticeable that due to intense competition based on investment in knowledge creation and innovation, private R&D investment proved to be relatively resilient in 2009, and even increased in Asia. This demonstrates the determination of the business sector to preserve R&D investments in times of crisis to maintain their competitiveness in the present globalisation context.
The challenge to invest more in knowledge remains a key priority even under the current tight budgetary constraints in Europe. Member States should, therefore, both consolidate public finances and safeguard the resources for future growth and competitiveness by investing in growth-enhancing policies, such as research, innovation and education.
6 This does not add up to 27: data is not available for Greece; break in series in Spain and Poland in 2009 prevents a direct comparison of the 2009 R&D budget (Government Appropriations or Outlays on R&D) with 2008 for these two countries.
3. Europe is host of a large and diversified pool of skilled human resources in particular in Science and Technology, which the business sector is not fully nor optimally making use of; in terms of new tertiary educated graduates, China now weights as much as the EU, the United States and Japan combined
Its large number of researchers and skilled human resources is one of Europe’s major assets. In 2008, there were 1.5 million full time equivalent researchers in the EU, compared to 1.4 million in the United States and 0.71 million in Japan. However, in absolute terms, China has taken the world lead with 1.6 million researchers in 2008. The EU will need to create at least 1 million new research jobs if it is to reach an R&D intensity of 3 %. This net increase by two thirds of the number of European researchers by 2020 should primarily benefit the business sector, where there is a large gap with the United States. In addition a large number of the existing research work-force will retire by 2020. This, combined with the need to strongly adapt the profiles of researchers to new priorities and market demands, will constitute one of the main challenges facing national research and one innovation systems in the years to come.
In dynamic terms, a sizeable and increasing share of the EU population graduates from academic tertiary education every year and represents a unique chance to meet this quantitative and qualitative challenge. The EU produces more than 940,000 students with a tertiary degree in Science and Engineering every year, and the number of tertiary degrees in the EU increased at an average annual rate of 4.9 % per year in the period 2000-2008. The same applies at the doctoral level. With 111,000 new doctorates awarded every year, the EU produces nearly twice as many doctorates than the United States. This proportion is even higher for Science and Engineering where the EU produces more than twice the number of doctorates as the United States. However, relative to GDP, the United States invests about 2.5 times more in higher education than the EU, mainly due to much lower private spending in the EU. As a result, education expenditure per graduate or PhD student in Europe is a fraction of what it is in the US, sacrificing quality for quantity at the risk of not meeting the expectations of the business sector.
Regarding the enrolment of students, the real breakthrough of the last decade, however, occurred in China: in 2009, China enrolled as many undergraduate students as the EU, the United States and Japan combined, i.e. more than 6 million. Less than seven years ago, China enrolled a similar number of undergraduate students as the EU (around 3 million) or the United States (2.5 million).
A central issue for the success of Innovation Union is for Member States to adapt their (tertiary) education systems in view of substantially increasing the number of available researchers and engineers while ensuring a better match of their skills with the needs of the business sector and improving the attractiveness of research careers for top talents from around the world.
4. While remaining a top player in terms of knowledge production and scientific excellence, Europe is losing ground as regards the exploitation of research results
The EU is the first producer of peer-reviewed scientific publications in the world, with 29 % of the
world production in 2009, ahead of the United States (22 %), China (17 %) and Japan (5 %).
In terms of scientific excellence, during the period 2001-2009, the EU as a whole increased its share of total scientific publications in the top 10 % most cited in the world from 10.4 % to 11.6 %, the world average being by definition at 10 %. This means that Europe’s capacity to produce high-impact scientific publications, which is a proxy for scientific quality, is 16 % above the world average and has been increasing since 2000. The Netherlands, Denmark, Switzerland and Iceland score highest and rank amongst world leaders on that criterion. This achievement is correlated with the gradual development of a European Research Area and the improvement of EU and national R&D funding instruments as part of the Lisbon strategy.
In spite of such recent progress the United States is still performing one third better than Europe in terms of R&d excellence, with 15.3 % of US publications among the world’s 10 % most cited.
In terms of development of competitive technology, Europe is losing ground in a context of increased competition. Today, the world share of PCT patents is at a comparable level for the EU, the United States and the five leading Asian countries (all at 25-30 %). However, the rate of growth in the number of PCT patent applications over recent years in Japan and South Korea is almost double that of the EU. On current trend, by 2020, the respective shares of PCT patent applications could be: EU: 18 %; United States 15 % and 55 % for the five leading Asian countries.
I-6
Europe7, evidencing the difficulty for Europe to acquire
a leading role on world technology markets.
The relative high cost of filing and maintaining a patent in Europe may partly explain this situation: An SME must disburse EUR 168,000 of legal fees to obtain and maintain a patent protection in all 27 EU Member States. It would cost only EUR 4000 for a protection of the same duration in the United States.
The development of the European Research Area, past and ongoing structural reforms of the national R&I systems and the deepening of the single market for knowledge are instrumental in improving the excellence of European science. However, further steps are needed – in particular towards more cost-efficient intellectual property protection and management - to strengthen technological and regain innovation leadership in view of ensuring Europe’s future competitiveness, growth and jobs.
A European Research Area for a more efficient R&I system
5. Member States are introducing reforms to improve the functioning of the public research base and increase public-private cooperation - however knowledge transfer in Europe remains weak
During the period 2000-2009, the EU Member States started reforming their higher education institutions and organisations performing public research. In many Member States universities have been given more autonomy and have developed institutional strategies to prioritise research activities and attract top foreign researchers. In addition, the allocation of public funds is increasingly based on the monitoring and evaluation of performance and on a competitive basis. The development of the so called “third mission” of universities is progressing in most Member States, in particular through the development and promotion of public-private cooperation. Out of 200 European Universities recently surveyed, 86 % had a Technology Transfer Office and more than a third had created 10 or more spin off companies.
7 Accounting for only 0.21 % of its GDP, compared to 0.53 % for Japan and 0.64 % for the United States.
However, these reforms are often still underway, with large differences between countries. As a result, scientific and technological cooperation between the public and private sectors remains generally weak in Europe. The number of joint publications between private and public actors per population in the EU is roughly half that of the United States and one third lower than in Japan. It is, however, much higher in a number of Member States (Sweden, Denmark, Finland, the Netherlands). An encouraging sign is the 20 % increase between 2000 and 2008 in the share of public R&D funded by business enterprises in the EU (which is superior to the situation in the United States and Japan). On this aspect as well, there are large variations amongst EU Member States and Associated Countries with Germany, Finland and Iceland performing much better than the EU average.
6. The development of the ERA underpins the evolution and efficiency of scientific activities in Europe
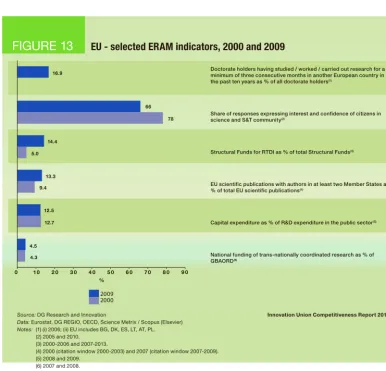
The European Research Area is still far from being a reality and progress has sometimes been slow since the launch of the first initiative in 2000. It is estimated that in 2008 only 4.5 % of the national R&D budgets of the EU Member States was allocated to trans-nationally coordinated research (4.3 % in 2007). An important part of this funding was constituted by the financing of large-scale trans-national research infrastructures (e.g. CERN) or corresponded to national R&D programmes coordinated by the Framework Programme’s instruments (ERA-NET, ERANET+, Joint technology Initiatives, article 185 initiatives) and other Europe-wide R&D coordination schemes (e.g. Eureka, COST). There is currently no quantitative estimation of the share in Europe of “open national R&d programmes”8.
However, first investigations show that they are very few of them.
Intra-European mobility remains at a modest level. In 2008, only 7 % of European doctoral candidates studied in another Member State. When it comes to established researchers however, 56 % of researchers based in Europe have worked at least three months in another country during their career.
Indicators on co-publications show that researchers based in the EU are increasingly integrated in transnational networks, as evidenced by the higher growth of transnational co-publications (both within the EU and with non-EU countries) compared to the growth of publications within individual Member States over the same period 2003–2008. The growth of extra-EU scientific cooperation is lower but relatively close to the intra-EU growth (average annual growth rates of 8 % and 9.8 % respectively). The figures show, therefore, both a greater EU integration in recent years and an increasing openness of EU research towards the rest of the world.
8 i.e. fully open to research teams that do not reside in the country where the programme is launched
Network analyses show that knowledge flows inside Europe (i.e. flows of students, electronic academic links, co-publications and co-patenting cooperation) are, however, very unbalanced, with a strong concentration amongst a few Western European countries, marginal involvement of EU-12 Member States and of most Southern European countries.
A major and visible progress towards a more efficient and integrated research funding landscape in Europe lies in the marked increase in EU-wide competitive research funding, mostly through the 7th Framework Programme,
as well as in the increasing orientation of Structural Funds towards research and innovation. In 2008, almost 11 % of the total EU budget was devoted to research and innovation, compared to less than 3 % in 1985. This has a considerable impact on the European research community. In most EU-12 Member States, Structural Funds directed to Research, Technological Development and Innovation represent more than 60 % of the national R&D budget, and even more than 100 % in a few cases. This is a unique opportunity for these Member States to increase their research and innovation capacity. As to the EU Research Framework Programme, according to preliminary Europe-wide estimates, it represents some 20 % to 25 % of all project-based funding in Europe.
I-8
7. Europe is increasing its international cooperation in science and technology, while striving to catch up with the United States
In a globalised economy, the competitive advantage of Europe mainly lies in its ability to compete on high value added products. However, the share of Europe in the world’s research capacity (in terms of investments and researchers) and output (in terms of S&T publications and patents) is decreasing as the rest of the world, and in particular leading Asian economies, is emerging. In parallel with this long term trend, major societal challenges, such as climate change and the ageing of population, are creating new needs but also market opportunities which are global in nature. These challenges call for increasing the international scientific and technological cooperation in a focussed and strategic way, building on the excellent collaborative record and high scientific rating of European science but also addressing the issue of a comparatively much weaker technological cooperation.
The older and better established scientific and technological collaborative networks in the world (as measured by co-publications and co-patenting) are between the United States and the EU. The future prospect for the transatlantic cooperation looks as good as ever, as evidenced in particular by the growing number of European students accomplishing their doctoral studies in the United States. Over the last decade, the number of European citizens receiving their doctoral degree in the United States increased by more than 38 %.
Both regions are at the same time adapting to the new geography of knowledge production and market opportunities, by increasing their bilateral cooperation with emerging economies in Asia. In terms of students, both economies have a significant one-way inflow of Asian doctoral students. Over the period 2000–2009, the scientific cooperation (measured by number of co-publications) of the United States with the research-intensive Asian countries (Japan, South Korea and China) was higher than between the EU and the same countries. Nevertheless, over the same period, the EU increased its scientific cooperation with these Asian countries at a higher pace (average annual growth rate of 12.8 %) than the United States (10.6 %). The same applies to technological cooperation,
with a higher absolute number of co-patents between the United States and the above mentioned Asian countries compared to the EU.
Finally, the share of participants in the Framework Programme from countries outside Europe is slowly growing - from 5.3 % in 2002 to 6.0 % in 2010 – as a result of its full international opening up. Russia and China have the highest number of participants in FP projects, followed by the United States. Among the European countries, it is mainly the five largest countries – Germany, the United Kingdom, France, Italy and Spain - which have collaborative links with Russia, China and the United States. In addition, the Netherlands and Sweden have also, relative to their size, a high proportion of collaborative links with these countries.
8. The gender balance in the European research population is improving, but major research institutions continue to be predominantly led and managed by men
Reforms for a more efficient and creative research and innovation system also include measures for a better gender balance. In 2007, women represented on average in the EU 37 % of total researchers in higher education institutions, 39 % of researchers in public research organisations and only 19 % of researchers in the business sector. Since 2002, the average annual growth rate in the number of female researchers has been higher than that of male researchers. Moreover, the gender gap has been closing more markedly among scientists than in the labour market in general. However, only 13 % of higher education institutions were headed by women in 2007, and the proportion of female staff in research institutions having reached the position of full professor or equivalent remains very low: 7.2 % in engineering and technology, 17 % in medical sciences and 27 % in humanities. Over the period 2004-2007, there was a slight increase in the proportion of women having reached that level.
In principle, advancement in gender equality is the result of the combined effect of reforms in the R&I systems, the features of the labour market and the equity policies in place. To provide a diversified view on what constitutes a good life for Europeans and what enhances innovation, the capacities and creativeness of both men and women have to be used in a balanced way in the research and innovation context. Focused actions with clear objectives, targets, deadlines and monitoring for gender equality should be included in sound national R&I strategies.
Research and Innovation for a sustainable economy and a better life
9. European SMEs are innovative but they do not grow sufficiently. The United States has shown a much better capacity to create and grow new companies in research-intensive sectors over the last 35 years
European SMEs are innovative. Out of those with innovation activities, 27 % introduced new or improved products to the market in 2008 according to the CIS survey. This figure even reaches 41 % in Sweden.
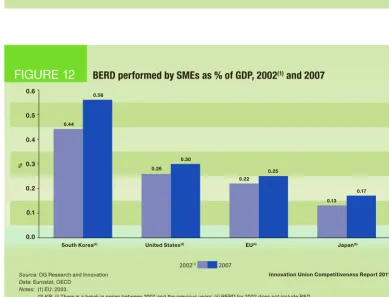
Relative to the size of the economy, SMEs perform more R&d in the United States than in the EU: in 2007, SMEs’ R&D expenditure amounted to 0.25 % of GDP in the EU against 0.30 % in the United States, with a high concentration in certain States such as California. However, in a number of European countries (Denmark, Finland, Belgium, Austria and Sweden), SMEs perform much more R&D (above 0.5 % GDP).
More worrying, however, is the fact that in terms of patenting activity, young (less than five years old) firms in the EU are less innovative than their counterparts in the United States, except in Norway and Denmark where more than 30 % of young firms filed a PCT patent application between 2005 and 2007.
As a result, innovative SMEs and enterprises of intermediate size do not grow sufficiently to become large R&D-investing and innovative companies. The share of companies created after 1975 is three times higher among the top R&D-investing US companies (54.4 %) than among the top R&D-investing EU companies (17.8 %). This is symptomatic of a consistently lower capacity of the EU over the last 35 years to create and grow new companies in research-intensive sectors as compared to the United States. As a result the EU’s industrial structure is not oriented enough towards fast-growing economic sectors.
I-10
10. Weaker framework conditions for business R&D and a fragmented European market for innovation are hampering private R&D investments and affecting the attractiveness of Europe
The attractiveness of Europe for foreign firms depends in particular on the existence of a single market of 500 million consumers with transparent business environment, sound and enforceable competition rules and the availability of a large pool of skilled human resources. This economic openness is characterised by the intensity of intra-EU competition and the openness to foreign investments and products. Within the EU, economic competition is perceived to be more intense in old Member States compared to new Member States and particularly strong in Germany, Austria and the Netherlands.
An important element in identifying the markets where companies prefer to innovate is the level of customer and consumer demand for new products and in particular the presence of lead users who may provide feedback and have a high propensity to take up innovations. The EU is the largest market in the world and should take full advantage of this by attracting investors to develop innovations that respond to the needs of consumers worldwide. This potential is, however, hampered by a lack of appropriate framework conditions at EU and national level for facilitating access to market of innovative goods and service, and promoting R&D and innovation investment by firms.
At national level, evidence shows that framework conditions for business R&I vary considerably between EU Member States. Northern European countries are systematically in the top positions for many indicators; while new Member States are generally in less attractive positions.
A typical example of the major obstacles to innovation concerns the protection and management of intellectual property. While there is a political will at European level to facilitate the transfer of knowledge from research to technology and towards the market, further efforts are needed to create a genuine marketplace for research results and for patents and licensing. In particular, the total cost of patenting and of maintaining a patent is around twenty times higher in Europe than in
the United States9 (40 times higher in the case of
SMEs). Most of this difference is due to the cost of fees for maintaining a patent over the period which is needed for a firm to expand its activities and get resources to develop a new generation of innovative products.
When it comes to access to private finance by firms, Europe lags well behind the United States regarding venture capital. Early stage venture capital funds in the EU are at less than half of the level in the US (respectively 1.9 and 4.5 EUR billion in 2009) and are only prominent in Norway, the Netherlands, Denmark, Portugal, Finland, Belgium and France. There are only three European countries that stand out regarding venture capital investments at the expansion phase: the United Kingdom, Sweden and Switzerland. New Member States have low levels of venture capital and generally still insufficiently attractive framework conditions for private R&D in spite of recent progress. As a result, the interest and demand for domestic R&D and innovation is low with no sufficient prospect for high return on investment.
At EU level, current initiatives mostly provide incentives stimulating the supply of innovation in fast-growing sectors (including the SET Plan, Joint Technology Initiatives, European Technology Platforms, and Joint Programming) whereas there have been fewer and less intensive efforts to stimulate the demand side (e.g. the Lead Market Initiative).
The Innovation Union flagship aims, therefore, to create a genuine single market for knowledge and set in place framework conditions to attract entrepreneurs and business investment and to provide European citizens with better public services and working opportunities.
In complement to current incentive schemes, the Innovation Union flagship aims to set in place a business environment more favourable for business R&D and innovation by improving key framework conditions. EU initiatives are being launched to modernise European standardisation, promote innovative procurement, create an EU-wide market for IPR and facilitate access to private finance.
11. Sustainable economic competitiveness in high knowledge-intensive sectors requires faster structural change in Europe
In the last 15 years, the EU economy has become ever more service oriented with the weight of manufacturing sectors shrinking to 20 % of the total Value Added.
This structural change has important consequences for the EU research and innovation system as the growing weight of the services sectors, which have a lower R&D intensity, offsets in most EU Member States recent increases in the research-intensity of manufacturing sectors. At the same time business R&D concentrates in high-tech and medium-high tech sectors which become ever more research intensive as more economies around the world move closer to the technological frontier. The net result of this complex evolution is that, while the EU economy has become slightly more knowledge-intensive since 2000, the gap with the United States has widened due to the higher share of high-tech sectors in the US economy and higher research intensities in individual sectors including services.
The increasing level of education and skills in the workforce is also an indicator of ongoing structural change. In 2009 knowledge-intensive activities (KIAs), where more than one third of the employees have a tertiary education degree, represented 35 % of total employment in the EU with generally no large variation around this rate among EU Member States. Between 2008 and 2009 there was a slight increase in KIAs at EU level.
Compared with the United States, there is room for further increases in the research intensity of the high-tech and medium high-high-tech industries and of services. Structural change is facilitated by the development of lead markets and addressing obstacles to the growth of new technology-based firms. Structural change from the perspective of R&D intensity can also be analysed at the level of firms. The 2010 European Industrial R&D Investment Scoreboard, covering the 1000 EU top firms in terms of R&D investments in a range of sectors, shows that in 2009 the R&D intensity of the EU companies slightly increased to reach 2.4 %.
Worldwide, the Industrial Scoreboard shows that, despite the impact of the crisis, the world’s R&D
landscape has maintained its sectoral specialisation, with the United States dominating in high R&D intensive sectors, which concentrate 69 % of the total BERD, and the EU in medium-high ones, which account for 48 % of the total BERD. R&D is a main competitiveness factor for key sectors such as Semiconductors, Software and Biotechnology: in these sectors, the United States’ companies dominate in terms of number of companies and total investment. EU companies increased their share of R&D investment in Chemicals, Electronic & Electrical Equipment, Software & Computer Services, Automobiles & Parts and Pharmaceuticals & Biotechnology. The emergence of strong R&D investors from China and India is well visible through the Scoreboard: with one and zero companies in the 2004 edition to 21 and 17 companies respectively, in the 2010.
Finally, the trend in the contribution of innovation-related trade in manufactured goods to the balance of trade goods is an indicator of competitiveness. In the period 2000-2008, almost all EU Member States increased the knowledge-intensity in their manufacturing export as share of the trade balance. Between 2002 and 2007, countries like Denmark, Greece, Ireland, Germany, Luxembourg and the Netherlands had as well a very positive contribution of knowledge intensive services to trade balance; over the same period, the other Member States displayed a knowledge-intensive service trade deficit.
I-12
12. Europe has a strong potential in technological inventions for societal challenges and new global growth areas, which could be successfully brought to the market by implementing the comprehensive and integrated approach set out in Innovation Union
Major societal challenges require developing innovative solutions which in turn will provide major opportunities in future high-growth markets around the world. The percentage of European citizens that trust science and technology to improve their quality of life decreased over the last five years from 78 % to 66 %. There is, therefore, a genuine expectation for science to reorient its efforts to contribute to addressing the societal challenges of our time.
Amongst the global societal challenges currently addressed, patenting activity shows that the emphasis in the EU has been on climate change mitigation: the number of PCT patent applications filed in the EU relative to GdP has more than doubled between 2000 and 2007 in this area. Europe thus has a strong research and innovation capacity for the development of technologies for climate change mitigation and the environment. As a result of the rapidly increasing European patenting activity in this area, the EU had in 2007 a positive technological specialisation in environmental technologies, whereas it suffered from a negative specialisation in health technologies and other fast-growing technology fields.
In 2007, the EU accounted for 40 % of all patents related to climate change technologies in the world, with Germany, Denmark and Spain accounting for nearly half of world wind energy production in 2009. In contrast, the photovoltaic industry is dominated by Asian and US firms, with only two out of the ten largest companies in the world based in Europe.
In the field of health technologies, Europe is lagging behind the United States, which accounts for almost half of all health-related patents in the world, for both pharmaceutical products and medical technologies. EU patenting in health technologies has fallen slightly since 2000. However, individual Member States such as Denmark, the Netherlands, Sweden and Germany are at the forefront of technology in health-related technologies.
Table of contents
ChAPTER 1
Europe’s competitive position in research and innovation
I-16
1.1. Is the EU improving its performance in research and innovation? I-17 1.2. How big a player is the EU in the multi-polar world of science and technology? I-20
ChAPTER 2
Investments in knowledge and human resources
I-21
2.1. Is the EU investing sufficiently in research, education and innovation? I-21 2.2. Can the EU count on a growing number of human resources and researchers? I-24 2.3. Are EU firms increasing their R&D investments in order to generate and
absorb new knowledge and boost innovation? I-27
ChAPTER 3
Towards the construction of a European Research Area (ERA)
open to the world
I-29
3.1. What is the overall progress towards the European Research Area? I-29 3.2. Is Europe advancing towards a single market for knowledge? I-31 3.3. Has Europe achieved world excellence in science and technology? I-33
ChAPTER 4
Innovation for a knowledge economy and societal challenges I-35
4.1. Are European firms/companies achieving technology-based innovation? I-35
4.2. Can the EU count on the right framework conditions to boost innovation? I-36 4.3. Is the EU shifting towards a more knowledge-intensive economy? I-38 4.4. Is European R&D addressing societal challenges? I-42
Overall picture
Europe's competitive position in
research and innovation - Acting
in the new geography of knowledge
This first section of the Innovation Union Competitiveness Report presents the
overall picture of European Research and Innovation (R&I). It benchmarks Europe's
efforts to maintain its scientific, technological and innovation competitiveness in
the new multi-polar world, and reveals some strengths and weaknesses of the
European system. In addition, the analysis helps to monitor the progress towards
an Innovation Union that contributes to smart, sustainable and inclusive growth in
Europe. New threads and opportunities are identified in a rapidly changing world
and the need for a long-term and global vision for Europe is put forward.
I-16
Overall picture
|
Europe's competitive position in research and innovation - acting in the new geography of knowledgechaptEr 1
Europe’s competitive position
in research and innovation
HIGHlIGHTS
The EU’s Research and Innovation (R&I) remains relatively competitive, even in a changing multi-polar world. The EU has one of the highest numbers of researchers in the world and in terms of research funding, scientific production and patenting of technologies, the EU remains the second major R&I centre after the United States of America. However, in many areas, the EU is still behind its main world competitors and its overall competitive position is declining.
The EU has made progress in some areas to increase its R&I capacity and performance and has managed to build some
distinctive strengths. More precisely, the EU benefits from a
number of researchers and a sizable and increasing share of the population graduating from academic tertiary education every year. Moreover, the EU is also advancing in its scientific and technological integration, thanks to closer collaborations between European researchers - albeit not at a desirable speed. Progress is also being made towards higher scientific excellence. Finally, the EU is well positioned in some upcoming technologies aimed at addressing societal global challenges, such as climate change technologies, that can yield significant economic results and become new growth areas. However, despite these encouraging signals, the overall R&I competitive position of the EU has been progressively declining in the last decade. This decline is mainly due to the sharp rise of Asia, a trend likely to continue given the ambitious R&D targets of South Korea, Japan or China; and the inability of the EU to address
some important weaknesses of its R&I system, which are:
1. A severe underinvestment in Research and Education vis-à-vis the United States and major Asian economies. The underinvestment in R&D is particularly worrying in the private sector, as firms face unfavourable framework conditions that deter them from investing or accessing the necessary resources to invest.
2. Weak knowledge exchanges between Science and Industry hamper the diffusion and use of existing knowledge and its commercialisation.
3. Poorer scientific and technological excellence in comparison to the United States — as evidenced by a lower percentage of scientific publications among the most cited publications worldwide and much lower licence and patent revenues — affects the EU’s capacity to lead groundbreaking innovations. 4. Unfavourable framework conditions for innovation in terms of access to financing (including venture capital), the much higher cost of patenting in Europe and business conditions that would enhance entrepreneurship activity.
The persistence of these weaknesses threatens the capacity
of the EU to enhance its future R&I competitive position and its capacity to accelerate its currently sluggish progress towards a knowledge-intensive economy. Without this structural change to the EU economy, its future economic competitiveness in high-value-added products and services may be at risk. The EU needs to react opportunely, addressing the weaknesses and continuing to build on its strengths in order to grasp the new
1.1.
is the Eu improving its performance in research and innovation?Each Research and Innovation (R&I) System has its own characteristics which depend on the socio-economic realm in which it is embedded. However, it is generally accepted that well-functioning systems share a number of common features10, (European Commission 201011).
The European Commission, after a broad consultation with stakeholders, has identified 10 of these features, which range from governance and design of R&I policies, to adequate and sufficient support for R&I, availability of the right mix of skills, support for effective knowledge flows, and the improvement of framework conditions that will promote private investment12.
This section provides an overview of how the EU performs on a series of indicators that capture some of these features. An analysis of 25 indicators13 of the Innovation
Union Scoreboard14 (IUS) is used. The 25 indicators of
the scoreboard are grouped into 8 dimensions and were selected for their capacity to describe the competitive position of a system, both in terms of research and innovation performance, and of the factors affecting its capacity to achieve this performance.
The IUS, therefore, provides an appropriate framework to overview the R&I competitiveness of the EU vis-à-vis its main trading competitors, namely the United States and Japan, and the new rising scientific and technological economies in Asia, e.g. South Korea and China. International comparison of the EU with non-EU countries is already possible for 14 out of the 25 indicators proposed by IUS, although with different geographical coverage. For the remaining 11 indicators (mainly indicators on innovation), the absence of the necessary data in many non-EU countries prevents any international comparison. Nevertheless, the available indicators cover most of the relevant dimensions fairly well, and the IUS remains a suitable framework for our analysis. The two figures below present (1) an overview of the gap between the EU, the United States and Japan in the key dimensions
10 OECD (2009): ‘The OECD Innovation Strategy: Getting a head start on tomorrow’ (http://www.oecd.org/document/15/0,3343, en_2649_34273_45154895_1_1_1_1,00.html).
11 European Commission (2010): ‘Europe 2020 Flagship Initiative: Innovation Union’ (http://ec.europa.eu/research/innovation-union/ pdf/innovation-union-communication_en.pdf).
12 A detailed description of these 10 features can be found in Annex 1 of the Innovation Union initiative.
13 While 25 indicators comprise the Innovation Union Scoreboard, only 24 indicators are currently computed, as the indicator on "high-growth innovative enterprises as a percentage of all enterprises" is not sufficiently available yet.
14 The 25 indicators can be found in "Performance Scoreboard for research and innovation", Annex II of the Innovation Union initiative.
of the IUS where data are available (Figure 1), and (2) a comparative analysis of the current state of play and the recent evolution of the EU, the United States, Japan and also China and South Korea, two countries rapidly gaining in scientific, technological and economic fields (Figure 2). From this overview, two overall conclusions can be drawn:
1. R&I performance in the EU keeps lagging behind that of the United States and Japan. The much weaker R&I activity of EU private firms, coupled with a less favourable environment in terms of accessing funding (including venture capital) and the much higher cost of patenting, are major competitive challenges for the EU.
2. New competitors are swiftly growing. In particular, South Korea and China have emerged as important science, technology and innovation centres, in some areas outperforming Europe and the United States.
The United States remains the world R&I leader, although in some areas such as business R&D investments or technological production measured by PCT15 patents,
some Asian countries, e.g. Japan and South Korea, have taken the lead. As figure 2 shows, the EU tends to lag behind the United States, Japan and South Korea particularly in terms of business R&I-related activities. The strengths of the EU lie in its production of new doctoral graduates and in the role of the export of knowledge-intensive services. Similar findings can be found in the recently published European Innovation Scoreboard.
In dynamic terms, the Asian economies, especially China, South Korea and Japan, have increased their R&D investments and scientific and technological performance more sharply than the EU or the United States. This trend is likely to continue given the ambitious R&D targets that they have set for the next decade. South Korea will aim to achieve an R&D intensity of 5 %, Japan of 4 %, Singapore of 3.5 % and China of 2.5 %, compared to the EU’s 3 % target for 2020.16 Moreover, the United States plans to launch a
very ambitious R&I investment policy which could aid them in ‘maintaining their leadership in research and technology as a crucial policy to support Amercia’s success’17.
15 Patent Cooperation Treaty.
16 A detailed analysis of the EU’s 3 % R&D intensity target is presented in Part I, chapter 1.
39% 3%
8% -13%
28% -32%
0% 5%
-46%
84% 97%
-122% -66%
-56% -94%
-108%
-8%
-19% -62%
-122%
-58% -25%
-156% -209%
16%31% 76%87% 50%
New doctoral graduates (ISCED 6) per thousand population aged 25-34
International scientific co-publications as % of total scientific publications
Scientific publications within the 10% most cited scientific publications worldwide as % of total scientific publications Public expenditure on R&D as % of GDP
Venture Capital (early-stage, expansion and replacement) as % of GDP(2)
Cost of patent application and maintenance for SMEs per billion GDP (PPS€)(3)
Business enterprise expenditure on R&D (BERD) as % of GDP Public-Private co-publications per million population PCT patent aplications per billion GDP (PPS€) Health technology patents (PCT) per billion GDP (PPS€) Climate change mitigation patents (PCT) per billion GDP (PPS€) Community trademarks per billion GDP (PPS€)
High-Tech and medium-high-tech product exports as % of total product exports(4)
Knowledge-intensive services exports as % of total services exports(5)
Licence and patent revenues from abroad as % of GDP(6) -225 -200 -175 -150 -125 -100 -75 -50 -25 0 25 50 75 100 EU less Japan as % of EU EU less United States as % of EU
Source: DG Research and Innovation
Data: Eurostat, OECD, Science Metrix / Scopus (Elsevier), Innovation Union Scoreboard 2010
Notes: (1) The values refer to 2009 or to the latest available year. (2) EU does not include EE, CY, LV, LT, MT, SI, SK.
(3) The values are on the left side of the graph because they express higher costs.
(4) EU includes intra-EU exports and was calculated from the uweighted average of the values for the Member States. (5) EU includes intra-EU exports.
(6) EU refers to extra-EU.
(7) Elements of estimation were involved in the compilation of the data.
Innovation Union Competitiveness Report 2011
%
I-18
Overall picture
|
Europe's competitive position in research and innovation - acting in the new geography of knowledgeNew doctoral graduates (ISCED 6) per thousand population aged 25-34
Licence and patent revenues from abroad as % of GDP(3)
Knowledge-intensive services exports as % of total services exports(4)
High-tech and medium-high-tech product exports as % of total product exports(5)
Community trademarks per billion GDP (PPS€)
Climate change mitigation patents (PCT) per billion GDP (PPS€) Health technology patents (PCT)
per billion GDP (PPS€) PCT patent aplications per billion GDP (PPS€) Public-Private co-publications
per million population Business enterprise expenditure
on R&D (BERD) as % of GDP Cost of patent application and maintenance
for SMEs per billion GDP (PPS€) Venture Capital (early-stage, expansion
and replacement) as % of GDP(6)
Public expenditure on R&D as % of GDP Scientific publications within the 10% most
cited scientific publications worldwide as % of total scientific publications
International scientific co-publications as % of total scientific publications
New doctoral graduates (ISCED 6) per thousand population aged 25-34
Licence and patent revenues from abroad as % of GDP(3)
Knowledge-intensive services exports as % of total services exports(4)
High-tech and medium-high-tech product exports as % of total product exports(5)
Community trademarks per billion GDP (PPS€)(7)
Climate change mitigation patents (PCT) per billion GDP (PPS€)(7)
Health technology patents (PCT) per billion GDP (PPS€)(7)
PCT patent aplications per billion GDP (PPS€)(7)
Public-Private co-publications per million population Business enterprise expenditure on R&D (BERD)
as % of GDP Venture Capital (early-stage, expansion
and replacement) as % of GDP(8)
Public expenditure on R&D as % of GDP Scientific publications within the 10% most
cited scientific publications worldwide as % of total scientific publications
International scientific co-publications as % of total scientific publications
EU United States Japan China South Korea
Source: DG Research and Innovation
Data: Eurostat, OECD, Science Metrix / Scopus (Elsevier), Innovation Union Scoreboard 2010
Notes: (1) The values refer to 2009 or to the latest available year.
(2) Growth rates which do not refer to 2000-2009 refer to growth between the earliest available year and the latest available year over the period 2000-2009.
(3) EU refers to extra-EU. (4) EU includes intra-EU exports.
(5) EU includes intra-EU exports and was calculated from the uweighted average of the values for the Member States. (6) EU does not include EE, CY, LV, LT, MT, SI, SK.
(7) Average annual growth refers to real growth. (8) EU does not include BG, EE, CY, LV, LT, LU, MT, SI, SK. (9) Elements of estimation were involved in the compilation of the data.
Innovation Union Competitiveness Report 2011