This is a repository copy of
Decoupled spin crossover and structural phase transition in a
molecular iron(II) complex
.
White Rose Research Online URL for this paper:
http://eprints.whiterose.ac.uk/84883/
Version: Accepted Version
Article:
Cook, LJK, Shepherd, HJ, Comyn, TP et al. (4 more authors) (2015) Decoupled spin
crossover and structural phase transition in a molecular iron(II) complex. Chemistry - A
European Journal, 21 (12). 4805 - 4816. ISSN 0947-6539
https://doi.org/10.1002/chem.201406307
[email protected]
https://eprints.whiterose.ac.uk/
Reuse
Unless indicated otherwise, fulltext items are protected by copyright with all rights reserved. The copyright
exception in section 29 of the Copyright, Designs and Patents Act 1988 allows the making of a single copy
solely for the purpose of non-commercial research or private study within the limits of fair dealing. The
publisher or other rights-holder may allow further reproduction and re-use of this version - refer to the White
Rose Research Online record for this item. Where records identify the publisher as the copyright holder,
users can verify any specific terms of use on the publisher’s website.
Takedown
If you consider content in White Rose Research Online to be in breach of UK law, please notify us by
Decoupled Spin-Crossover and Structural Phase Transition in a
Molecular Iron(II) Complex
Laurence J. Kershaw Cook,
[a]Helena J. Shepherd,
[b]Tim P. Comyn,
[c]Chérif Baldé,
[d,e]Oscar Cespedes,
[f]Guillaume Chastanet,*
[e]and Malcolm A. Halcrow*
[a]Introduction
The structural chemistry of molecular spin-crossover (SCO) materials[1-4]continues to be of great interest, for two reasons.[5,6] One, is to elucidate the factors underlying cooperative spin-state switching so that new materials with useful switching properties can be designed for nanoscience and device applications.[3] However, the study of SCO by multiple techniques also affords more general information about the underlying chemistry of crystallographic phase transitions, which is important for the crystal engineering of other types of functional material. Increasingly complex structural behavior is being reported in spin-transition crystals,[5] including: stepwise spin-transitions coupled to multiple crystallographic phase changes;[7,8] incomplete SCO reflecting symmetry-breaking transitions generating a mixture of active and inactive sites in a material;[9]and, thermal hysteresis induced by large changes in molecular conformation during SCO, rather than a change in crystallographic symmetry.[10]
We report here [Fe(bppSMe)2][BF4]2(1; bppSMe = 4-[methyl-sulfanyl]-2,6-di[pyrazol-1-yl]pyridine), whose crystals exhibit a thermal spin-transition near room temperature that is decoupled from a crystallographic phase change at lower temperature. Only
two other SCO materials show comparable behavior:
[{Fe(NCS)2(3-bpp)}2(-4,4’-bipy)] (3-bpp = 2,6-di[pyrazol-3-yl]pyridine; 4,4’-bipy = 4,4’-bipyridyl)[11]and [FeL
2][BF4]2(L = 2,6-di[5-methylpyrazol-3-yl]pyridine),[12] which both undergo one or more crystallographic phase changes abovetheir spin-transition temperatures. Two other complexes [Fe(bppBr)2][BF4]2(2; bppBr [a] Dr. L. J. Kershaw Cook, Prof. M. A. Halcrow.
School of Chemistry, University of Leeds, Woodhouse Lane, Leeds, LS2 9JT (UK)
E-mail: [email protected]
[b] Dr. H. J. Shepherd.
Department of Chemistry, University of Bath, Claverton Down, Bath BA2 7AY (UK).
[c] Dr. T. P. Comyn.
Institute for Materials Research, School of Chemical and Process Engineering, University of Leeds, Leeds, LS2 9JT (UK).
[d] Dr. C. Baldé
University of Ziguinchor, Sciences and Technology Department, 253 Ziguinchor, Senegal.
[e] Dr. G. Chastanet
CNRS, Univ. Bordeaux, ICMCB, UPR 9048, F-33600 Pessac, France.
Email: [email protected]
[f] Dr. O. Cespedes
School of Physics and Astronomy, University of Leeds, E.C. Stoner Building, Leeds, LS2 9JT (UK).
Supporting information for this article is available on the WWW under http://www.chemeurj.org/ or from the author.
Abstract:Crystalline [Fe(bppSMe)2][BF4]2(1; bppSMe = 4-[methylsulfanyl]-2,6-di[pyrazol-1-yl]pyridine) undergoes an abrupt spin-crossover (SCO) event at 265±5 K. The crystals also undergo a separate phase transition near 205 K, involving a contraction of the unit cellaaxis to one-third its original value (high-temperature phase 1;Pbcn,Z= 12; low-temperature phase 2;Pbcn,Z= 4). The SCO-active phase 1 contains two unique molecular environments, one of which appears to undergo SCO more gradually than the other. In contrast, powder samples of1retain phase 1 between
140-300 K, although their SCO behavior is essentially identical to the single crystals. The compounds [Fe(bppBr)2][BF4]2 (2;
bppBr = 4-bromo-2,6-di[pyrazol-1-yl]pyridine) and
[Fe(bppI)2][BF4]2 (3; bppI = 4-iodo-2,6-di[pyrazol-1-yl]-pyridine) exhibit more gradual SCO near room temperature, and adopt phase 2 in both spin-states. Comparison of 1-3
reveals that the more cooperative spin-transition in1, and its
separate crystallographic phase transition, can both be attributed to an intermolecular steric interaction involving its methylsulfanyl substituents. All three compounds exhibit the
LIESST effect with T(LIESST = 70-80 K), but show
= 4-bromo-2,6-di[pyrazol-1-yl]pyridine) and [Fe(bppI)2][BF4]2 (3; bppI = 4-iodo-2,6-di[pyrazol-1-yl]pyridine)[13] are also described, which are isostructural to1at low temperature but do not exhibit
the crystallographic phase change. Comparison of these compounds has allowed us to identify the intermolecular interactions in1that cause its more complicated SCO and phase behavior, and has thus afforded a structure:function relationship for SCO in this type of crystal lattice.
Results and Discussion
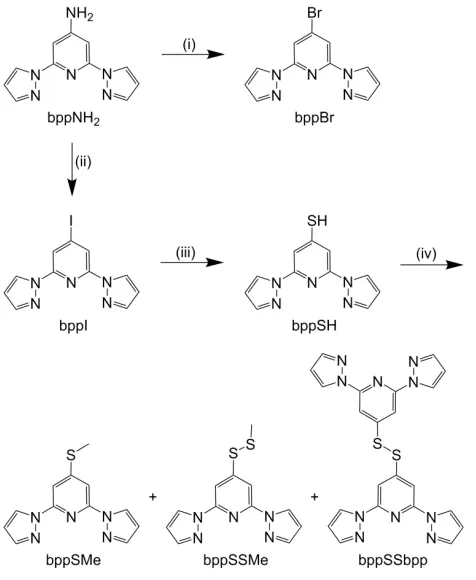
The ligands bppBr and bppI[14]were both obtained from 4-amino-2,6-di[pyrazol-1-yl]pyridine (bppNH2)[14] by a diazotization procedure. Treatment of bppI with NaSH in dmf affords 4-mercapto-2,6-di[pyrazol-1-yl]pyridine (bppSH),[15] which was methylated with MeI to give bppSMe, together with the disulfides
bppSSbpp[15] and bppSSMe (Scheme 1). Pure bppSMe can be
isolated from the mixture by vacuum sublimation, while the disulfido products were purified from the involatile residue by silica column chromatography. Complexation of hydrated Fe[BF4]2with 2 equiv of the appropriate ligand in nitromethane yielded the complex salts1-3, which all form solvent-free yellow crystals from nitromethane/diethyl ether mixtures.[16]
Scheme 1. Synthesis of the ligands in this study. Conditions used: (i) NaNO2,
KBr, HBr (aq), MeCN, rt reflux then Na2S2O3(aq). (ii) Isopentyl nitrite, KI, I2,
CH2Cl2, rt reflux then Na2S2O3(aq).[14] (iii) NaSH, dmf, reflux.[15] (iv) MeI,
K2CO3, MeCN, 85 °C.
The variable temperature magnetic susceptibility of a powder sample of1 demonstrated a thermal spin-transition with a small
thermal hysteresis width of 2 K (T½ = 268 K, T½ = 270 K; Fig. 1).
Although the transition has no discontinuities at first glance, only ca.80 % of the sample is in its low-spin state at 250 K (MT= 0.7 cm3mol−1K) with the remainder of the material becoming low-spin more gradually on further cooling. The first derivative of the susceptibility curve shows the transition is not symmetrical, and contains small discontinuities near 220 and 330 K (Fig. 1).[17]
Therefore, SCO in 1 appears to contain two components: an
abrupt, hysteretic transition undergone byca.70 % of the sample; and, a more gradual crossover with a similar midpoint temperature, involving the remaining 30 %. That suggestion is also supported by the DSC data described below. In contrast 2
and3both exhibit more gradual SCO, with no masked features in
theirMT/Tcurves and midpoint temperatures ofT½= 307 K (2) and 332 K (3). The SCO cooperativity, as measured by the maximum value ofMT/T, follows the order1> 3> 2(Fig. 1).
The SCO transition for3is essentially identical to that shown by
[image:3.595.42.280.388.678.2]the perchlorate salt of the same complex.[13]
Figure 1. Top: variable temperature magnetic susceptibility data for1 ( ), 2( ) and3 ( ), measured with a 298 350 3 298 K temperature ramp. The inset
shows the thermal hysteresis on the abrupt part of the spin-transition of1. Bottom: the first derivative of theMT vs. Tcurves of1 ( ), 2( ) and3 ( ).[17]
Initial structure refinements showed that 1-3are isostructural
deviations from the idealizedD2dsymmetry that is expected with this ligand type (Table 1). The complex cations pack in layers in the crystals, related to the “terpyridine embrace” lattice that is often adopted by salts of [Fe(bpp)2]2+derivatives.[18-20]The cation layers in the full embrace structure have strict or approximate four-fold symmetry, with each molecule interdigitating to four
nearest neighbors via face-to-face and edge-to-face –
[image:4.595.312.545.177.411.2]interactions between their pyrazolyl rings.[21]In1-3, although the
Figure 2. Views of the [Fe(bppSMe)2]2+cation in1(top) and [Fe(bppBr)2]2+in2
(bottom) at 100 K. Displacement ellipsoids are at the 50 % probability level, and all H atoms have been omitted. Symmetry codes: (i) 1–x,y,3/
2–z; (ii) –x,y,3/
2–z.
layered structure is retained, this interdigitation is disrupted by the pyridyl substituents which protrude into the adjacent layers (Fig.
3). Thus, each [Fe(bppR)2]2+ cation (R = SMe, Br or I)
experiences a partial terpyridine embrace, forming just two intra-layer–interactions to face-to-face pyrazolyl rings.
[image:4.595.55.279.215.444.2]Figure 3. View of the cation layers in the LS-2 phase of1at 100 K. The pale colored cations are in the same layer as the highlighted molecule, while the dark cations are in adjacent layers to the front and back. The close intermolecular C–H…contacts involving the methylsulfanyl groups are also indicated. The view is perpendicular to the crystallographic (100) plane, and BF4–ions have been omitted for clarity.
Table 1.Selected bond distances [Å] and angles [º] for the different phases of the complexes.,andare indices characteristic for the spin state of the
complex,[5,22]while and are measures of the Jahn-Teller distortion sometimes shown by these iron centers in their high-spin state (see the Supporting
Information).[23-25]Typical values of these parameters in [Fe(bpp)
2]2+derivatives are given in ref. [18]. 1
T= 290 K (HS-1) T= 240 K (LS-1) T= 100 K (LS-2) Half-molecule A Molecule B Half-molecule A Molecule B
Fe−N{pyridyl} 2.105(4) 2.103(4), 2.118(4) 1.930(5) 1.901(4), 1.901(5) 1.893(2)
Fe−N{pyrazolyl} 2.159(5), 2.170(5) 2.160(5)–2.168(5) 2.002(5), 2.015(5) 1.965(5)–1.980(5) 1.969(3), 1.971(2)
73.7(2) 73.5(4) 78.8(3) 79.9(4) 80.0(2)
148.9(7) 152.7(6) 98.7(8) 88.4(7) 87.6(4)
461 475 320 289 287
178.6(3) 168.3(2) 178.6(3) 175.2(2) 174.28(15)
89.04(5) 86.55(5) 88.09(4) 87.76(4) 87.23(2)
2
T= 350 K (HS-2) T= 250 K (LS-2) T= 100 K (LS-2)
3
T= 350 K (HS-2)[a]
T= 100 K (LS-2)
Fe−N{pyridyl} 2.110(4) 1.896(6) 1.895(2) 2.077(4) 1.898(3)
Fe−N{pyrazolyl} 2.145(4), 2.146(5) 1.971(5), 1.976(6) 1.968(2), 1.982(2) 2.134(5), 2.147(5) 1.962(3), 1.968(3)
73.7(2) 80.2(3) 79.99(13) 74.6(3) 80.23(17)
148.8(6) 85.6(8) 87.1(3) 139.9(7) 84.8(4)
458 282 286 437 278
175.9(2) 177.2(3) 175.62(13) 177.1(2) 177.21(18)
89.64(4) 89.60(5) 87.02(2) 88.35(4) 86.98(2)
[image:4.595.37.558.542.761.2]Unit cell measurements showed that, in addition to SCO at 260-270 K, crystals of 1 undergo a second phase transition between 210 and 200 K involving a contraction of the unit cella axis from 53-54 Å in the higher temperature phase (phase 1) to 18 Å in the low-temperature phase (phase 2). The spin-transition near 270 K is accompanied by a sharp decrease in a, but has little effect onborc(Fig. 4). The resultant contraction in unit cell volume (V), 260(27) Å3or 2.8 %, is typical for an abrupt thermal spin-transition in an iron(II) complex salt.[6] The phase 1 phase 2 change around 205 K causes a small contraction inbas well as the aforementioned reduction ina, and is also reflected in a 23(6) Å3 reduction in V (normalized to Z = 4, Fig. 4). Thus, the molecular packing in phase 2 of1is significantly more compact
[image:5.595.304.553.192.456.2]than the low-spin form of phase 1. Further cooling to 100 K leads to a small increase ina, which is offset by decreases inbandcto give the expected reduction inVwith decreasing temperature.
Figure 4. Temperature dependence of the single crystal unit cell dimensions of
1(top), and the unit cell volume normalised toZ= 4 (bottom), upon cooling from 290 to 110 K. Error bars are shown for all data points, but are often smaller than the symbols on the graphs.
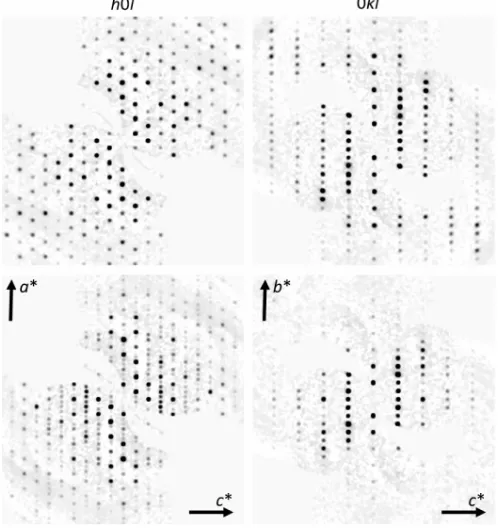
Investigation of multiple crystals revealed that the formation of phase 1 on warming above 200-210 K was always apparent in the diffraction images, from the ingrowth of additional diffraction peaks along a* (Fig. 5). However, ingrowth of the additional
reflections from phase 1 was not abrupt, and often occurred over a temperature range of 20-30 K.[25]The relative intensities of the supercell reflections, compared to the parent reflections, differed significantly between crystals, and upon repeated cycling of the same crystal.
Figure 5. Diffraction images from a single crystal of1in theh0land 0klzones at 100 K (top) and 240 K (bottom) showing the appearance of additional reflections alonga*. The apparently weaker diffraction in0kl compared toh0lat 240 K is an artefact of the data reconstruction process.[25]
Although crystals of1always diffract well at 100 K, they often
suffer from twinning above the phase 2 phase 1 transition
temperature. This twinning is reversed upon re-cooling the crystals below 205 K. Hence, the formation of the phase 1 supercell along [100] may take place in an incoherent or disordered manner in those crystals. Several attempts were required to obtain good refinements of all the phases of 1 from
the same crystal. One refinement of each phase was ultimately achieved at 290 K (HS-1), 240 K (LS-1) and 100 K (LS-2); HS-1 and LS-1 are isostructural in phase 1, but in the high-spin and low-spin states respectively. Interestingly, crystals that diffracted well at 100 K had a much higher mosaicity at 30 K, which prevented us from obtaining a useful structure of1at that lower
temperature.
[image:5.595.45.289.312.658.2]the sample remains high-spin at 240 K (Fig. 1). The molecules differ in that molecule A has a more regular coordination geometry, closer to idealD2dsymmetry, than molecule B. That is reflected in thetrans-N{pyridine}–Fe–N{pyridine} angle (in Table 1), which is close to the expected value of 180° in molecule A [178.6(3)° in both HS-1 and LS-1] but is significantly smaller in molecule B [168.3(2) and 175.2(2)°, respectively].[23,24]Notably, in HS-1 molecule B is unusually low for an SCO-active complex of this type, and the change induring SCO for molecule B [= 6.9(3)°] is correspondingly large.[18]The greater change in shape during SCO for molecule B compared to molecule A [= 0.0(4)°], implies that molecule B should undergo SCO more cooperatively than molecule A.[5] That is consistent with the mixture of abrupt and gradual SCO evident in the susceptibility and DSC data for1. The A and B cation sites in phase 1 are segregated into distinct layers in the lattice, with an ABBABB stacking pattern along the crystallographicaaxis. Nearest neighbor cations in the A layers are related by an inversion centre and are aligned strictly co-parallel, while in the B layers they are related by mirror symmetry and are slightly canted with respect to each other. This leads to an undulation of the complex molecules in adjacent layers down the [100] vector.[25]Discontinuities in this undulation might lead to the weaker diffraction in 0kl exhibited by phase 1 (Fig. 5). In LS-2, the cation layers are all identical and equivalent to the A layers in HS-1/LS-1, and the complex molecules are all aligned linearly along [100].
The–interactions within the layers involve pyrazolyl rings that are strictly or approximately coplanar by symmetry and separated by 3.5 Å. The dimensions of these interactions change only slightly between the different phases of 1.[25]More variation occurs in intermolecular contacts involving the methylsulfanyl groups, however, which occupy cavities bounded by four pyrazolyl groups from two different cations in an adjacent layer. In
HS-1 the intermolecular methyl…pyrazolyl distances are C…C ≥
3.640(14) Å, close to the sum of the van der Waals radii of a methyl group and an aromatic ring (3.7 Å).[26]However, in LS-1 there is a general contraction of these interactions, and the three unique methyl groups in this structure each form one close intermolecular C–H… contact of C…C = 3.452(12), 3.531(12) and 3.573(15) Å. The shortest of these is associated with the unique methylsulfanyl group in molecule A, which exhibits a degree of disorder in the LS-1 phase. In LS-2 at 100 K, this ligand disorder is no longer apparent although the short C–H…contact to the unique methylsulfanyl group is retained, at C…C = 3.445(5) Å (Fig. 3).[25] Relief of this steric clash may contribute to the
driving force for the LS-2 LS-1 phase change. While there are
also several cation…anion C–H…F contacts in HS-1 and LS-1, these are less likely to contribute to the spin-transition because the anions are comparably disordered in both structures.
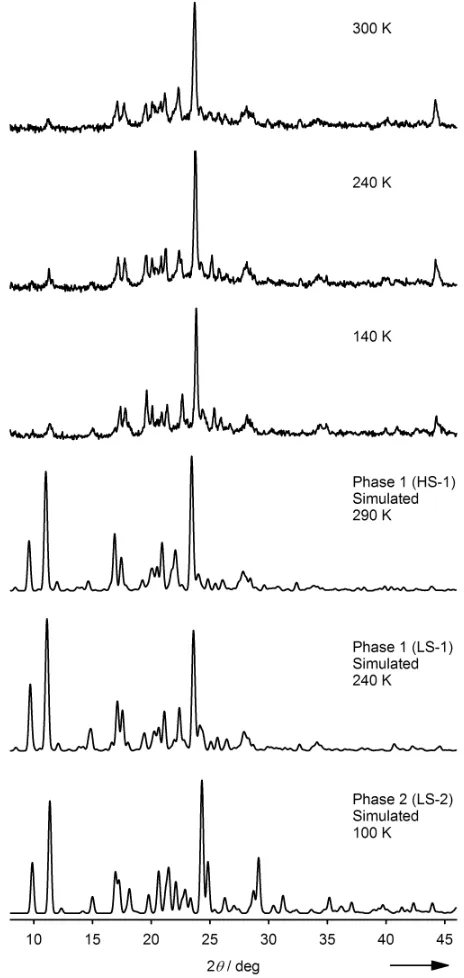
The phase behavior of bulk samples of 1 was probed by
variable temperatureX-ray powder diffraction. Although the peaks are broad, the data show only minor changes on cooling from 300 to 140 K (Fig. 5). The data at all temperatures are a better match for the simulated patterns based on phase 1 than for phase 2,
particularly in the region 20 ≤ 2 ≤ 30° which shows the greatest
difference between the two forms. Hence, in contrast to the single crystals, powder samples of 1 do not exhibit the LS-1/LS-2
transition and retain phase 1 at all accessible temperatures. This observation was supported by a differential scanning calorimetry
(DSC) measurement, which showed peaks corresponding to the SCO event that are in excellent agreement with the susceptibility curve (T = 267 K, T = 270 K, H= 10.1(2) kJmol−1). However no peak was observed near 205 K that could be attributed to the phase 1/phase 2 conversion, confirming that this transition does not occur in the powder sample. The measured SCO enthalpy is ca. 50 % smaller than for other compounds of the [Fe(bpp)2]2+ type,[20,23,27] which is consistent with the suggestion that the abrupt part of the spin-transition in 1 only involves a fraction of
[image:6.595.312.544.236.725.2]the iron centers in the sample (see above).
Higher temperature crystal structure determinations of2 and 3 were also performed, to probe the structure changes during
SCO in those materials (Table 1). In contrast to1,2and3both
adopt phase 2 at all the temperatures examined. Structures of2
at 250 and 350 K, either side of its spin-transition, showed it to be low-spin at 250 K and high-spin at 350 K as expected from its susceptibility data (Fig. 1). The metric parameters of 3at 350 K
imply a predominantly, but not fully, high-spin iron center. That is again consistent with the susceptibility data, which predict aca. 85 % high-spin population in the material at that temperature (Fig. 1). X-ray powder diffraction confirmed that powder samples of 2
and3are phase pure, and adopt phase 2 as in the single crystal.
Salts of [Fe(bpp)2]2+ derivatives are well known to exhibit photomagnetic effects at low temperatures.[7,20,28-30]The low spin high spin photoconversion was investigated on 1-3 in bulk
condition using a SQUID magnetometer coupled to a CW optical source. The samples were irradiated at the following wavelengths: 405, 510, 640, 830 and 980 nm. In each case, the most efficient wavelength to induce the LIESST effect was found to be 510 nm, leading to a strong increase of the magnetic signal at 10 K. No reverse-LIESST was observed upon irradiation at the longer wavelengths, however. Using the standardizedT(LIESST) procedure[31,32] we monitored the direct magnetic response on a thin layer of powders of compounds 1-3 upon irradiation of the 1A1 1T1 absorption band. The T(LIESST) curves were then recorded for each compound (Fig. 7) to determine the stabilization of the photoinduced HS state.
For all complexes, a drastic increase in the magnetic signal under green light irradiation was observed at 10 K. However, unusually for [Fe(bpp)2]2+derivatives,[7,20,28-30]the photoconversion efficiency was not quantitative. The maximumMTvalues indicate photoconversion efficiencies of 70 % (for1), 57 % (2) and 60 %
(3). Following the irradiation procedure, an increase inMToccurs upon heating from 10 K in the dark, reflecting zero-field splitting of the HS iron(II) centers.[33]For
1and2the plateau reached at 40 K
remains stable until 60 K, beyond which the metastable light-induced HS state rapidly decreases, reaching the baseline above 80 K. The T(LIESST) values can be extracted from the first derivative of the MT vs. T curves (Fig. 7, inset) affording
T(LIESST) = 70 and 80 K, respectively. In contrast, the
T(LIESST) curve for3clearly exhibits two steps, with two minima
being resolved in the(MT)/T vs. Tplot at 65 and 75 K.
These T(LIESST) values all agree well with the predicted values from eq 1 (T0= 150 K),[31,32] in common with most other [Fe(bpp)2]2+ derivatives that have been measured by this procedure.[20,28]
T(LIESST) =T0– 0.3T½ (1)
However, although the differences are small, it is noteworthy that within this series 1 has both the lowest T1/2 and the lowest T(LIESST) values, in apparent violation of eq 1 and Hauser’s inverse energy gap law.[34]
The dynamics of LIESST relaxation of the photo-induced HS fraction,HS, were investigated for all three complexes in the 50-80K temperature range where the HS-LS relaxation is thermally activated. The value of HS was deduced from the equation [(MT)hv–(MT)LS]/[(MT)HS–(MT)LS], in which (MT)hv is the
[image:7.595.326.529.104.519.2]magnetic value reached after irradiation, (MT)LSis the magnetic value of the initial LS state, and (MT)HS is the magnetic value recorded at room temperature for afully HS state.
Figure 7. Temperature dependence ofMTfor1–3: thermal behavior ofMT
before irradiation ( ), during irradiation ( ) at 510 nm at 10 K, and the
T(LIESST) measurement in the warming mode when the laser was switched off (). The lines through the latter data for 1 and 3 show the T(LIESST) simulations discussed in the text. Inset: first derivative of theMT vs. Tcurve,
recorded in the dark after irradiation, whose minimum givesT(LIESST).
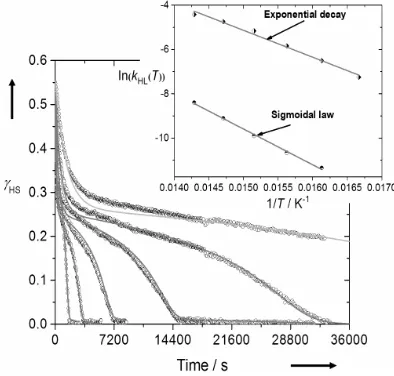
The relaxation behavior for1 deviates strongly from a single
exponential. However the relaxation curves are not perfectly sigmoidal; while a fast exponential decay occurs at short time-scales, a much slower process is also observed as a long tail at the end of the relaxation (Fig. 8). The sigmoidal shape of the relaxation curves is consistent with the cooperative thermal spin transition, while the superimposed exponential decay reflects either the presence of short-range interactions in the lattice, or the presence of more than one relaxing species. The latter suggestion is consistent with the presence of two different iron centers in phase 1 of the sample, as predicted by the powder diffraction data, but it could also imply a crystallographic phase
1 2 transition occurring during the relaxation process. Therefore,
barrier as a function of HS in cooperative SCO materials.[35][eq (2) and (3), with=Ea*/kBTandkHL=kexp(−Ea/kBT)]:
HS * HL
HS
k t
(2)
k*HL(T, HS) =kHL(T)exp[(T)(1 − HS)] (3) This procedure yielded the solid lines shown in Fig. 8. From these simulations, an Arrhenius plot can be drawn to extract the dynamical parametersEa= 1040 cm−1,Ea* = 120 cm−1 andk
[image:8.595.333.522.202.360.2]= 6.9 105s−1. However the second, minority exponential component of the decay curves is clearly not reproduced by the simulation.
Figure 8. HSLS relaxation for1at 72.5, 70, 67.5, 65, 62.5 and 60 K. The
relaxation curves are fitted according to Hauser’s sigmoidal law.[34] Inset:
Arrhenius plot of lnkHLvs.1/T. The line represents the best linear fit.
The HS-LS relaxation curves for 2 exhibit a clear multistep
character (Fig. 9). On the basis of the gradual, single step thermal SCO exhibited by 2 (Fig. 1), and the single minimum in its T(LIESST) curve (Fig. 7), a single exponential or even stretched exponential decay might have been expected. This is clearly not the case, however. Some of the relaxation steps exhibit a sigmoidal shape, indicating the presence of cooperative phases in the powder which can be explained by the formation of domains during the relaxation process.[36] The simultaneous, coincident relaxation processes exhibited by 2 could not be accurately simulated, and we were unable to describe its global LIESST relaxation.
Compound 3 clearly exhibits a two-step relaxation behavior,
from the shape of its T(LIESST) curve (Fig. 7). The first step follows a single exponential decay while the second step exhibits
a sigmoidal shape. If the relaxation process is [HS−HS] [HS−LS] [LS−LS], as observed in dinuclear systems,[37]the second relaxation step depends on the lifetime of the first one, and the relaxation kinetics should account for this dependence. On the other hand, if the relaxation processes arise from two independent metastable sites, the two relaxation rates are not correlated.[38] This latter situation seems more appropriate to describe the two-step relaxation of 3, especially since the two
processes have sufficiently different time scales to be treated separately. By inspection, the relaxation processes have approximately the following proportions: 40 % of exponential decay and 60 % of self-accelerating process. The first component was modelled with an exponential model, and the second part was simulated using eq 2 and 3. Fig. 10 presents the simulation
obtained from this approach, leading to the dynamic parameters extracted from the ln[kHL(T)]vs1/Tplot (Fig. 10, inset). For the exponential relaxationEa= 840 cm–1andk∞= 4.6x10⁵s–1; and for
the sigmoidal simulationEa= 1140 cm–1,Ea*= 190 cm–1andk∞=
[image:8.595.74.261.244.388.2]2.2x10⁶s–1. The latter values are comparable to those obtained for 1, reflecting the similar structural environment observed for both complexes.
Figure 9. HSLS relaxation at different temperatures for2.
Figure 10. HSLS relaxation for 3 at 70, 68, 66, 64, 62 and 60 K. The relaxation curves are fitted by combining the exponential and sigmoidal models. Inset: Arrhenius plot of ln(kHL) versus 1/T. The lines represent the best linear
simulations.
An elegant way to validate the parameters obtained from the simulation of the relaxation kinetics is to reproduce the experimental T(LIESST) curves. The procedure takes careful account of the time and temperature dependencies of the relaxation, and combines the quantum mechanical tunnelling and the thermally activated regions (eq 4).[32,39]
HS
B a 0
HS
HS exp .exp 1
E kT T
k k
[image:8.595.328.525.403.591.2]The rate constantk0characterizes the relaxation in the quantum tunnelling region, and is estimated as an upper limit from the last complete kinetic recorded at lowest temperature. k0 is of the order of 2 x10⁻⁵s–1for 1 and 4x10⁻⁵s–1for
3.
The simulation of the double step in theT(LIESST) curve of3
was obtained by considering 40% of the sites with exponential decay and 60% of the sites with sigmoidal relaxation, as above.
The calculated T(LIESST) curves (Fig. 7) show excellent
agreement with the experimental T(LIESST) data, thereby
supporting the validity of the derived parameters and the simulation procedure. The two-step character for 3 is well reproduced, and the position of the twoT(LIESST) values is also well simulated.
The observation of distinct strongly and weakly cooperative LIESST relaxation regimes in1is consistent with the mixture of
strongly and weakly cooperative thermal SCO observed in the susceptibilty data, and the presence of two distinct molecular environments in the phase 1 crystal lattice. However, neither of those observations is true for 2or 3, which still exhibit similarly complicated LIESST relaxation. Hence, that interpretation of the LIESST properties of1remains to be confirmed.
Conclusion
While 1-3 are isostructural at 100 K, crystals of 1 undergo a
crystallographic phase transition near 205 K. Thermal SCO then occurs upon further warming, centered at 270 K, without a further crystallographic phase change. The high-temperature (phase 1) and low-temperature (phase 2) structures have the same space group, but phase 1 is expanded along the unit celladirection and contains one-and-a-half unique molecules in its asymmetric unit. The expansion of the unit cell along [100] often occurs incoherently, as evidenced by frequent twinning of crystals in phase 1 which is reversed upon re-formation of phase 2 on cooling below 205 K. The phase transition may be driven by an intermolecular interaction between a ligand methyl substituent and a neighboring pyrazolyl ring. In phase 2, all these C…C contacts are 0.25 Å shorter than the sum of the van der Waals radii for these groups. In phase 1, there are three unique equivalent contacts which are 0.25, 0.17 and 0.13 Å shorter than the van der Waals sum at 240 K (just above the transition
temperature). Hence, the phase 2 phase 1 transition leads to a
partial relief of this steric crowding. Consistent with that suggestion, 2 and 3 do not exhibit comparable intermolecular steric clashes in their crystal lattices, and remain in phase 2 in both spin states between 100-350 K.
Interestingly, the crystallographic phase transition was only observed in single crystal samples of 1. Powder samples of 1
retain the room-temperature phase 1 between 140-300 K, by DSC and powder diffraction. Particle size-dependent phase behavior is well known at the nanoscale, where the structure of the bulk becomes influenced by the particle surface energy.[40,41] Such phenomena are more unusual in macroscopic materials, however, where defect structures and domain sizes can influence the stability of crystal phases as well as surface effects.[42,43] Notably the variable temperature unit cell, DSC and susceptibility data all imply that SCO proceeds similarly in single crystalline and powdered1. That is reasonable, since both samples adopt phase 1 in the temperature range of the spin-transition.
The SCO-active phase 1 contains one-and-a-half unique complex dications. The whole molecule undergoes a significant change in its shape during SCO, as evidenced by an increase of nearly 7° in thetrans-N{pyridine}–Fe–N{pyridine} angle (, Table 1), which is not exhibited by the other half-molecule in the unit cell (Figure in the Supporting Information). We have previously demonstrated that a change in molecular shape between the spin states can be correlated with cooperative SCO in [Fe(bpp)2]2+ derivatives.[5] Hence, this is consistent with the observation of abrupt (molecule B) and gradual (molecule A) SCO fractions, in an approximate 2:1 ratio, in the susceptibility data of1.
The literature compound [Fe(bppCCH)2][BF4]2(4; bppCCH = 4-ethynyl-2,6-di[pyrazol-1-yl]pyridine) also adopts phase 2 in its high-spin state, but undergoes a phase change during SCO to a new low-spin phase in a different orthorhombic space group.[30,44] While it occurs at a similar temperature to the compounds in this work, the spin-transition in 4 is more cooperative with a 8 K
hysteresis loop, reflecting the involvement of the phase change in its SCO. While it is difficult to draw further comparison between1 -3 and 4, this emphasizes the structural complexity of the
[Fe(bpp)2]2+system in this particular lattice type.
The T(LIESST) values from 1-3 are in line with previous expectation,[20,28] but the relaxation kinetics of their metastable high-spin states unexpectedly involve a mixture of weakly (exponential) and strongly (sigmoidal) cooperative regimes. The explanation for this behavior is uncertain, given that1, and2and 3, exhibit different phase behavior in the temperature range that
could be examined (above 100 K). One potential explanation, that bulk samples of 2and 3contain a mixture of crystal phases, is ruled out by the X-ray powder diffraction data (the same samples were used for both measurements). Alternatively, the complexes may undergo crystallographic phase changes on cooling below 100 K, and/or during photoexcitation at very low temperatures. The poor diffraction exhibited by crystals of1at 30 K is intriguing
in that regard, and we are currently examining these possibilities in more detail.
Experimental Section
Instrumentation
Elemental microanalyses were performed by the University of Leeds School of Chemistry microanalytical service. Infra-red spectra were obtained as nujol mulls pressed between NaCl windows, between 600-4,000 cm–1, using a Nicolet
Avatar 360 spectrophotometer.1H NMR spectra employed a Bruker DPX300
spectrometer operating at 300.2 MHz. UV/vis/NIR measurements were performed using a Perkin Elmer Lambda900 spectrophotometer in 1 cm quartz solution cells, between 200-3000 nm. Electrospray mass spectra (ESI MS) were obtained on a Waters ZQ4000 spectrometer, from MeCN feed solutions. All mass peaks have the correct isotopic distributions for the proposed assignments.X-ray powder diffraction measurements employed a Bruker D8 Advance A25 diffractometer, using Cu-Kradiation (= 1.5418 Å). Differential scanning calorimetry measurements used a TA Instruments DSC Q20 calorimeter, heating at a rate of 10 K min−1. The magnetic susceptibility, powder
diffraction, DSC and LIESST measurements were all performed using the same samples of1-3.
Magnetic susceptibility measurements were performed on a Quantum Design SQUID/VSM magnetometer, in an applied field of 1000 or 5000 G. A diamagnetic correction for the sample was estimated from Pascal’s constants;[45] a previously measured diamagnetic correction for the sample
Quantum Design SQUID magnetometer operating at 2000 G. The powder sample was prepared in a thin layer (~0.1 mg) to promote full penetration of the irradiated light. The sample mass was obtained by comparison with the thermal spin transition curve measured on a larger, accurately weighed polycrystalline sample. The sample was first slow cooled to 10 K, ensuring that potential trapping of HS species at low temperatures did not occur. Irradiation was carried out at a set wavelength and the power of the sample surface was adjusted to 5 mW cm−2. Once photo-saturation was reached, irradiation was
ceased and the temperature increased at a rate of 0.3 K min−1to ~100 K and
the magnetisation measured every 1 K to determine theT(LIESST) value given
by the minimum of theMT/T vs Tcurve for the relaxation.[32]TheT(LIESST)
value describes the limiting temperature above which the light-induced magnetic high-spin information is erased in a SQUID cavity. In the absence of irradiation, the magnetisation was also measured over the temperature range 10–290 K to follow the thermal spin transition and to obtain a low temperature baseline. Kinetic studies of LIESST relaxation were performed by irradiating the sample at 10 K until photo-saturation, then, under constant irradiation the sample was warmed to a desired temperature around theT(LIESST) region. At
the desired temperature, irradiation is stopped and the decay of the magnetization signal was followed for several hours, or until complete relaxation back to the low-spin baseline.
Materials and methods
Unless otherwise stated, all reactions were carried out in air using non-pre-dried AR-grade solvents. 4-Amino-2,6-di(pyrazol-1-yl)pyridine (bppNH2),[14]
4-iodo-2,6-di(pyrazol-1-yl)pyridine (bppI)[14]and 4-mercapto-2,6-di(pyrazol-1-yl)pyridine
(bppSH)[15]were synthesized by the literature methods, while all other reagents
were used as commercially supplied.
4-(Methylsulfanyl)-2,6-di(pyrazol-1-yl)pyridine (bppSMe) and 4-(Methyldisulfanyl)-2,6-di(pyrazol-1-yl)pyridine (bppSSMe). Under dry anhydrous conditions, bppSH (0.20 g, 0.82 mmol) was added to a Schlenk tube containing K2CO3(0.23 g, 1.64 mmol), iodomethane (0.33 g, 2.31 mmol) and
activated molecular sieves (10 granules) in MeCN (25 cm3). The mixture was
heated to 85 °C for 18 hrs, during which the suspension became pale yellow in color. The contents, once cooled, were diluted to 50 cm3with CHCl
3(caution:
strong odor), passed over a short silica pad and the silica washed further with 1:1 CHCl3:MeCN (100 cm3). The solvent was removedin vacuoand the yellow
solid residue was redissolved in 1:2 hexane-EtOAc and filtered, before again being evaporated to dryness. The white solid bppSMe was isolated by sublimation under reduced pressure at 130 °C. Yield 78 mg, 37 %. Found C 55.6, H 4.35, N 27.3. Calcd for C12H11N5S (257.32): C 56.0, H 4.31, N 27.2 %.
M.p. 140-142°C. ES mass spectrum:m/z280.1 [Na(bppSMe)]+.1H NMR (300
MHz, CDCl3); , ppm 2.64 (s, 3H, SCH3), 6.50 (br s, 2H, pzH4), 7.71 (s, 2H, py H3/5), 7.76 (br s, 2H, pzH3), 8.56 (d, 2.1 Hz, 2H, pzH5);13C NMR (75.5 MHz,
CDCl3); , ppm 14.2 (SCH3), 105.1 (2C, pyC3/5), 108.0 (2C, pzC4), 127.3 (2C,
pzC5), 142.3 (2C, pzC3), 149.8 (2C, pzC2/6), 156.5 (1C, pyC4).
The involatile residue from the sublimation contains the symmetric disulfide bppSSbpp[15] and bppSSMe, which were separated by silica column
chromatography (eluent 99:1 CH2Cl2:MeOH). bppSSMe (Rf0.66) was obtained
as a white solid. Yield 73 mg, 20 %. Found C 49.9, H 3.80, N 24.0. Calcd for C12H11N5S2(289.18): C 49.8, H 3.83, N 24.2 %. M.p. 115-117°C. ES mass
spectrum: m/z 290.1 [H(bppSSMe)]+, 312.0 [Na(bppSSMe)]+. 1H NMR (300
MHz, CDCl3); , ppm 2.54 (s, 3H, SCH3), 6.51 (dd, 1.9 and 2.6 Hz, 2H, pzH4),
7.79 (d, 1.6 Hz, 2H, pzH3), 8.04 (s, 2H, pyH3/5), 8.57 (d, 2.6 Hz, 2H, pzH5);13C
NMR (75.5 MHz, CDCl3); , ppm 23.0 (SCH3), 105.3 (2C, pyC3/5), 108.1 (2C, pz C4), 127.3 (2C, pzC5), 142.5 (2C, pzC3), 150.3 (2C, pzC2/6), 155.1 (1C, py
C4).[16]
4-Bromo-2,6-di(pyrazol-1-yl)pyridine (bppBr).bppNH2 (0.39 g, 1.73 mmol)
and NaNO2(2.51 mg, 3.64 mmol) were suspended in MeCN (25 cm3) under an
atmosphere of N2. Addition of KBr (0.49 g, 4.15 mmol) and 48% aqueous HBr
(10 cm3, 59.3 mmol) caused immediate darkening of the mixture. The mixture
was stirred for 1 hr at room temperature, then heated to 80 °C for 1 hr. The cooled mixture was poured into saturated aqueous Na2S2O3(100 cm3) and
shaken, precipitating a pale solid. The solid was then collected on a glass frit and washed with H2O. Silica gel column chromatography (3:2 CH2Cl2:hexane
eluent;Rf0.19) yielded the product as a white solid, which was recrystallzed
fromn-hexane. Yield 0.16 g, 32 %. Found C 44.6, H 2.95, N 22.8 %. Calcd for
C11H8BrN5·½H2O (299.13): C, 44.2, H 3.03, N 23.4 %. M.p. 148-150 °C. ES
mass spectrum:m/z290.0 [H(bppBr)]+.1H NMR (300 MHz, CDCl3); , ppm 6.52
(dd, 1.7 and 2.6 Hz, 2H, pzH4), 7.77 (d, 1.7 Hz, 2H, pzH3), 8.06 (s, 2H, pyH3/5), 8.53 (d, 2.6 Hz, 2H, pzH5).13C NMR (75.5 MHz, CDCl3); , ppm 108.4 (2C, pz
C4), 112.7 (2C, pyC3/5), 127.3 (2C, pzC5), 136.7 (1C, pyC4), 142.9 (2C, pzC5), 150.4 (2C, pyC2/6).
Synthesis of complexes. The same basic method, described here for [Fe(L2SMe)2][BF4]2(1), was used for all the complexes. A solution of bppSMe
(70 mg, 0.27 mmol) and Fe[BF4]2·6H2O (45 mg, 0.13 mmol) in nitromethane (20
cm3) was stirred at room temperature for 1 hr. The solution was filtered and
concentrated toca.5 cm3, then the product was precipitated by addition of
diethyl ether. Isolated yields ranged from 87-95 %. Microanalytical data for the complexes are listed below.
[Fe(bppSMe)2][BF4]2(1)Found C 38.4, H 2.95, N 18.5 %. Calcd for
C24H22B2F8FeN10S2(744.09): C 38.7, H 2.98, N 18.8 %.
[Fe(bppBr)2][BF4]2(2) Found C 32.5, H 1.90, N 16.9 %. Calcd for
C22H16B2Br2F8FeN10(809.70): C 32.6, H 1.99, N 17.3 %.
[Fe(bppI)2][BF4]2(3) Found C 29.3, H 1.70, N 15.5 %. Calcd for
C22H16B2F8FeI2N10(903.69): C 29.2, H 1.78, N 15.5 %.
Single-Crystal Structure Analyses:Single crystals of1-3were all obtained by
slow diffusion of diethyl ether vapor into nitromethane solutions of the compounds. Diffraction data were collected with an Agilent Supernova dual-source diffractometer fitted with Oxford Cryosystems cryostat, or with aHELIX
cryostat for the measurements at 30 K (the Agilent diffractometer is modified to accept theHELIXdevice). Diffraction data from1and2were measured using monochromated Cu-K radiation (= 1.54184 Å). Several crystals of 1were
screened to find one that diffracted sufficiently well at room temperature. That crystal was then used for all three data collections, measured in a
290 240 100 K temperature sequence. Two different crystals were used for 2, one for the 100 K structure and the other for the two higher temperature measurements. Data for 3 were collected with the same diffractometer, but using monochromated Mo-K radiation (= 0.71073 Å) to avoid absorption
problems. The structures were solved by direct methods (SHELXS-97),[46]then
developed by least squares refinement onF2(SHELXL-97).[46]Crystallographic
figures were prepared using XSEED.[47] Experimental data for the structure
determinations are collected in Tables 2 and 3. The unit cell data in Fig. 4 were collected under the same conditions, using Mo-K radiation.
CCDC-1006370 (1, LS-2), CCDC-1006371 (1, LS-1), CCDC-1006372 (1, HS-1),
CCDC-1006373 (2, 100 K), CCDC-1006374 (2, 250 K), CCDC-1006375 (2, 350 K), CCDC-1006376 (3, 100 K) and CCDC-1006377 (3, 350 K) contain the
supplementary crystallographic data for this paper. These data can be obtained free of charge from The Cambridge Crystallographic Data Centre via
www.ccdc.cam.ac.uk/data_request/cif.
Structure refinement of 1 (HS-1). The asymmetric unit contains 1.5 formula
units, with half a complex cation spanning theC2axis1/2,y,3/
4(molecule A);
and, a whole complex dication (molecule B) and three unique BF4–anions lying
on general crystallographic sites. All three anions are disordered over two or three sites, each sharing a common wholly-occupied B atom which results in some significant deviations from tetrahedrality. The refined restraints B–F = 1.37(2) and F...F = 2.24(2) Å were applied to these residues. All wholly occupied non-H atoms were refined anisotropically, and all H atoms were placed in calculated positions and refined using a riding model.
Structure refinement of 1 (LS-1). This structure is isostructural with HS-1, and its refinement showed only two significant differences from the previous one. First, is a slightly different pattern of disorder in the three unique anions. Second, is the resolution of a minor, 15 %-occupied disorder site for the methylsulfanyl group of half-molecule A, which was refined using the fixed restraint C–S = 1.78(2) Å. All wholly occupied non-H atoms plus the major methylsulfanyl disorder orientation were refined anisotropically, and all H atoms were placed in calculated positions and refined using a riding model.
Structure refinement of 1 (LS-2). This asymmetric unit contains half a formula unit, with Fe(1) lying on the crystallographicC2axis1/2,y,3/4and one unique
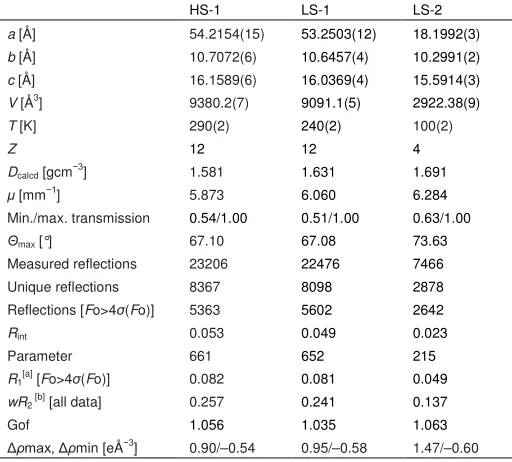
Table 2.Experimental details for the crystal structure determinations of the
different phases of1(C24H22B2F8FeN10S2, formula weight 744.11 gmol−1, crystal
system orthorhombic, space groupPbcn).
HS-1 LS-1 LS-2
a[Å] 54.2154(15) 53.2503(12) 18.1992(3)
b[Å] 10.7072(6) 10.6457(4) 10.2991(2)
c[Å] 16.1589(6) 16.0369(4) 15.5914(3)
V[Å3] 9380.2(7) 9091.1(5) 2922.38(9)
T[K] 290(2) 240(2) 100(2)
Z 12 12 4
Dcalcd[gcm−3] 1.581 1.631 1.691
[mm−1] 5.873 6.060 6.284
Min./max. transmission 0.54/1.00 0.51/1.00 0.63/1.00
max[°] 67.10 67.08 73.63
Measured reflections 23206 22476 7466
Unique reflections 8367 8098 2878
Reflections [Fo>4 (Fo)] 5363 5602 2642
Rint 0.053 0.049 0.023
Parameter 661 652 215
R1[a][Fo>4 (Fo)] 0.082 0.081 0.049
wR2[b][all data] 0.257 0.241 0.137
Gof 1.056 1.035 1.063
max, min [eÅ−3] 0.90/–0.54 0.95/–0.58 1.47/–0.60
[a]R=[Fo–Fc] /Fo. [b]wR= [w(Fo2–Fc2) / wFo4]1/2
refinement, and no restraints were applied. All non-H atoms were refined anisotropically, while H atoms were placed in calculated positions and refined using a riding model. The highest residual Fourier peak of +1.5eÅ–3is 1.2 Å
from S(18), and may reflect a remnant of the disorder in that group which is present in molecule A of the LS-1 refinement.
Structure refinements of 2. The asymmetric unit contains half a formula unit,
with Fe(1) spanning the crystallographicC2axis 0,y,3/4. The unique BF4–ion is
badly disordered at 250 and 350 K, and was refined over four equally occupied orientations that share a common full-occupancy B atom. The resultant partialanions deviate significantly from tetrahedrality. The refined restraints B–F = 1.39(2) and F...F = 2.27(2) Å were applied to the disordered anion. At 100 K this disorder was no longer apparent, and the anion was modelled without restraints at that temperature. All non-H atoms except the disordered F atoms (where applicable) were refined anisotropically, and H atoms were placed in calculated positions and refined using a riding model.
Structure refinements of 3. The asymmetric unit contains half a formula unit,
with Fe(1) lying on the crystallographic C2axis1/2,y,3/
4. No disorder was
present in the model at 100 K, but at 350 K the unique BF4–site is disordered
and was refined over four equally occupied orientations that share a common full-occupancy B atom. The resultant partial anions deviate significantly from an tetrahedral geometry. The refined restraints B–F = 1.40(2) and F...F = 2.28(2) Å were applied to the disordered anion. All non-H atoms except the disordered F atoms (where applicable) were refined anisotropically, and H atoms were placed in calculated positions and refined using a riding model.
Acknowledgements
This work was funded by the EPSRC (EP/H015639/1, EP/K012576/1 and EP/K00512X/1). The Aquitaine Region is acknowledged for the development of the International Centre of Photomagnetism in Aquitaine (ICPA) platform.
Table 3.Experimental details for the crystal structure determinations of2(C22H16B2Br2F8FeN10, formula weight809.74gmol−1, crystal system orthorhombic, space
groupPbcn) and3(C22H16B2F8I2FeN10, formula weight 903.72 gmol−1, crystal system orthorhombic, space groupPbcn).
2[a] 3[b]
HS-2 LS-2 LS-2 HS-2[c] LS-2
a[Å] 17.2631(5) 17.5486(9) 17.8625(3) 17.4698(9) 16.8364(4)
b[Å] 10.4120(5) 9.9817(9) 9.3666(2) 10.6631(9) 11.1465(5)
c[Å] 16.6989(8) 16.4985(11) 16.5749(3) 16.6117(11) 15.5406(5)
V[Å3] 3001.5(2) 2890.0(4) 2773.16(9) 3094.5(4) 2916.46(18)
T[K] 350(2) 250(2) 100(2) 350(2) 100(2)
Z 4 4 4 4 4
Dcalcd[gcm−3] 1.792 1.861 1.939 1.940 2.058
[mm−1] 7.914 8.220 8.566 2.564 2.720
Min./max. transmission 0.76/1.00 0.50/1.00 0.61/1.00 0.65/1.00 0.84/1.00
max[°] 72.05 71.92 74.03 29.82 26.37
Measured reflections 5966 5624 10444 15927 15286
Unique reflections 2854 2735 2768 3916 2976
Reflections [Fo>4 (Fo)] 1820 2006 2541 1734 2445
Rint 0.031 0.038 0.047 0.056 0.065
Parameter 233 233 204 233 204
R1[d][Fo>4 (Fo)] 0.060 0.077 0.035 0.055 0.032
wR2[e][all data] 0.172 0.231 0.090 0.163 0.072
Gof 1.050 1.070 1.050 1.029 1.051
max, min [eÅ−3] 0.34/–0.48 0.97/–1.23 0.63/–1.17 0.40/–0.63 0.83/–0.68
[a] Data collected using Cu-Kradiation. [b] Data collected using Mo-Kradiation. [c] The compound wasca.85 % high-spin at this temperature.
[image:11.595.36.559.483.725.2]Keywords:spin-crossover • iron • N-ligands • crystal engineering
• photomagnetic properties
[1] P. Gütlich, H. A. Goodwin (eds.), Spin Crossover in Transition Metal Compounds I-III, Top. Curr. Chem.2004, 233-235.
[2] M. A. Halcrow (ed), Spin-crossover materials – properties and applications,John Wiley & Sons, Chichester, UK,2013, p. 568. [3] a) A. Bousseksou, G. Molnár, L. Salmon, W. Nicolazzi,Chem. Soc. Rev.
2011,40, 3313–3335; b) H. J. Shepherd, G. Molnár, W. Nicolazzi, L. Salmon, A. Bousseksou,Eur. J. Inorg. Chem.2013, 653–661.
[4] For other recent reviews see: a) P. Gamez, J. S. Costa, M. Quesada, G. Aromí,Dalton Trans. 2009, 7845–7853; b) M. C. Muñoz, J. A. Real,
Coord. Chem. Rev.2011,255, 2068–2093; c) J. Tao, R.-J. Wei, R.-B. Huang, L.-S. Zheng,Chem. Soc. Rev.2012,41, 703–737; d) P. Gütlich,
Eur. J. Inorg. Chem. 2013, 581–591; e) M. Sorai, Y. Nakazawa, M. Nakano, Y. Miyazaki,Chem. Rev.2013,113, PR41–PR122.
[5] M. A. Halcrow,Chem. Soc. Rev.2011,40, 4119–4142. [6] P. Guionneau,Dalton Trans.2014,43, 382–393.
[7] a) V. A. Money, C. Carbonera, J. Elhaïk, M. A. Halcrow, J. A. K. Howard, J.-F. Létard,Chem. Eur. J.2007,13, 5503–5514; b) M. Nihei, H. Tahira, N. Takahashi, Y. Otake, Y. Yamamura, K. Saito, H. Oshio,J. Am. Chem. Soc.2010,132, 3553–3560.
[8] a) D. Chernyshov, M. Hostettler, K. W. Törnroos, H.-B. Bürgi,Angew. Chem.2003,115, 3955–3960;Angew. Chem. Int. Ed.2003,42, 3825– 3830; b) S. Bonnet, M. A. Siegler, J. S. Costa, G. Molnár, A. Bousseksou, A. L. Spek, P. Gamez, J. Reedijk,Chem. Commun.2008, 5619–5621; c) N. Bréfuel, H. Watanabe, L. Toupet, J. Come, N. Matsumoto, E. Collet, K. Tanaka, J.-P. Tuchagues,Angew. Chem.2009,121, 9468–9471;Angew. Chem. Int. Ed. 2009, 48, 9304–9307; d) N. Bréfuel, E. Collet, H. Watanabe, M. Kojima, N. Matsumoto, L. Toupet, K. Tanaka, J.-P. Tuchagues, Chem. Eur. J. 2010, 16, 14060–14068; e) M. Buron-Le Cointe, N. O. Moussa, E. Trzop, A. Moréac, G. Molnár, L. Toupet, A. Bousseksou, J. F. Létard, G. S. Matouzenko, Phys. Rev. B2010,82, 214106/1–214106/11; f) M. Griffin, S. Shakespeare, H. J. Shepherd, C. J. Harding, J.-F. Létard, C. Desplanches, A. E. Goeta, J. A. K. Howard, A. K. Powell, V. Mereacre, Y. Garcia, A. D. Naik, H. Müller-Bunz, G. G. Morgan, Angew. Chem.2011, 123, 926–930;Angew. Chem. Int. Ed.
2011, 50, 896–900; g) N. F. Sciortino, K. R. Scherl-Gruenwald, G. Chastanet, G. J. Halder, K. W. Chapman, J.-F. Létard, C. J. Kepert,
Angew. Chem.2012,124, 10301–10305;Angew. Chem. Int. Ed. Engl.
2012,51, 10154–10158; h) Z.-Y. Li, J.-W. Dai, Y. Shiota, K. Yoshizawa, S. Kanegawa, O. Sato,Chem. Eur. J.2013,19, 12948–12952; j) J. Kusz, M. Nowak, P. Gütlich,Eur. J. Inorg. Chem.2013, 832–842; j) B. J. C. Vieira, J. T. Coutinho, I. C. Santos, L. C. J. Pereira, J. C. Waerenborgh, V. da Gama,Inorg. Chem.2013,52, 3845 3850; k) K. D. Murnaghan, C. Carbonera, L. Toupet, M. Griffin, M. M. Dîrtu, C. Desplanches, Y. Garcia, E. Collet, J.-F. Létard, G. G. Morgan,Chem. Eur. J.2014,20, 5613– 5618.
[9] a) D. L. Reger, C. A. Little, V. G. Young, jr., M. Pink,Inorg. Chem.2001,
40,2870–2874; b) M. Yamada, H. Hagiwara, H. Torigoe, N. Matsumoto, M. Kojima, F. Dahan, J.-P. Tuchagues, N. Re, S. Iijima,Chem. Eur. J.
2006,12, 4536–4549; c) A. Lennartson, A. D. Bond, S. Piligkos, C. J. McKenzie,Angew. Chem.2012,124, 11211–11214;Angew. Chem. Int. Ed.2012,51, 11049–11052.
[10] a) H. J. Shepherd, T. Palamarciuc, P. Rosa, P. Guionneau, G. Molnár, J.-F. Létard, A. Bousseksou, Angew. Chem. 2012, 124, 3976–3980;
Angew. Chem. Int. Ed.2012,51, 3910–3914; b) G. A. Craig, J. S. Costa, S. J. Teat, O. Roubeau, D. S. Yufit, J. A. K. Howard, G. Aromí,Inorg. Chem.2013,52, 7203 7209.
[11] a) D. Fedaoui, Y. Bouhadja, A. Kaiba, P. Guionneau, J.-F. Létard, P. Rosa, Eur. J. Inorg. Chem. 2008, 1022–1026; b) A. Kaiba, H. J. Shepherd, D. Fedaoui, P. Rosa, A. E. Goeta N. Rebbani, J. F. Létard, P. Guionneau,Dalton Trans.2010,39, 2910–2918; c) H. J. Shepherd, P. Rosa, L. Vendier, N. Casati, J.-F. Létard, A. Bousseksou, P. Guionneau, G. Molnár,Phys. Chem. Chem. Phys.2012,14, 5265–5271.
[12] a) T. D. Roberts, F. Tuna, T. L. Malkin, C. A. Kilner, M. A. Halcrow,
Chem. Sci.2012,3, 349–354; b) T. D. Roberts, M. A. Little, F. Tuna, C.
A. Kilner, M. A. Halcrow,Chem. Commun.2013,49, 6280–6282. [13] The salt [Fe(bppI)2][ClO4]2 has been reported previously. It is
isostructural with2and3and shows a similarly gradual SCO in the solid state, with T½ = 333 K. N. T. Madhu, I. Salitros, F. Schramm, S.
Klyatskaya, O. Fuhr, M. Ruben,C. R. Chimie2008,11, 1166–1174. [14] C. Rajadurai, F. Schramm, S. Brink, O. Fuhr, M. Ghafari, R. Kruk, M.
Ruben,Inorg. Chem.2006,45, 10019–10021.
[15] L. J. Kershaw Cook, J. Fisher, L. P. Harding, M. A. Halcrow, submitted for publication.
[16] The complex salt [Fe(bppSSMe)2][BF4]2is low-spin at room temperature
but undergoes a spin-transition on warming, with an unusual structured hysteresis loop. Structural studies on this material are in progress, and will be reported separately.
[17] Although they occur at comparable temperatures, the discontinuity at 220 K in the MT/T curve for 1 cannot correspond to the phase
1 phase 2 transition. The same sample was also used for the powder diffraction and DSC measurements, where the phase 1 phase 2
transformation was not observed.
[18] a) M. A. Halcrow,Coord. Chem. Rev. 2009,253, 2493–2514; b) L. J. Kershaw Cook, R. Mohammed, G. Sherborne, T. D. Roberts, S. Alvarez, M. A. Halcrow,Coord. Chem. Rev.,doi: 10.1016/j.ccr.2014.08.006.. [19] a) R. Pritchard, C. A. Kilner, M. A. Halcrow,Chem. Commun.2007, 577–
579; b) T. D. Roberts, F. Tuna, T. L. Malkin, C. A. Kilner, M. A. Halcrow,
Chem. Sci.2012,3, 349–354.
[20] a) R. Pritchard, H. Lazar, S. A. Barrett, C. A. Kilner, S. Asthana, C. Carbonera, J.-F. Létard, M. A. Halcrow,Dalton Trans.2009, 6656–6666;
b) R. Mohammed, G. Chastanet, F. Tuna, T. L. Malkin, S. A. Barrett, C. A. Kilner, J.-F. Létard, M. A. Halcrow,Eur. J. Inorg. Chem.2013, 819–
831.
[21] a) M. L. Scudder, H. A. Goodwin, I. G. Dance,New J. Chem.1999,23,
695–705; b) J. McMurtrie, I. Dance,CrystEngComm2005,7, 216–229; c) J. McMurtrie, I. Dance,CrystEngComm2010,12, 2700–2710.
[22] a) J. K. McCusker, A. L. Rheingold, D. N. Hendrickson,Inorg. Chem.
1996,35, 2100–2112; b) P. Guionneau, M. Marchivie, G. Bravic, J.-F.
Létard, D. Chasseau,Top. Curr. Chem.2004,234, 97–128.
[23] J. M. Holland, J. A. McAllister, C. A. Kilner, M. Thornton-Pett, A. J. Bridgeman, M. A. Halcrow,J. Chem. Soc. Dalton Trans.2002, 548–554.
[24] a) J. Elha k D. J. Evans, C. A. Kilner, M. A. Halcrow, Dalton Trans.2005,
1693–1700; b) C. A. Kilner, M. A. Halcrow,Polyhedron2006,25, 235– 240; c) M. Haryono, F. W. Heinemann, K. Petukhov, K. Gieb, P. Müller, A. Grohmann,Eur. J. Inorg. Chem.2009, 2136–2143.
[25] Additional crystallographic Figures and Tables, definitions of the structure parameters in Table 1, DSC and powder diffraction data are given in the Supporting Information.
[26] L. Pauling,The Nature of the Chemical Bond, 3rdedn., Cornell University
Press, Ithaca, New York, USA,1960, pp. 257–264.
[27] a) C. Carbonera, C. A. Kilner, J.-F. Létard, M. A. Halcrow,Dalton Trans.
2007, 1284–1292; b) C. A. Tovee, C. A. Kilner, J. A. Thomas, M. A.
Halcrow,CrystEngComm2009,11, 2069–2077.
[28] a) C. Carbonera, J. S. Costa, V. A. Money, J. Elhaïk, J. A. K. Howard, M. A. Halcrow, J.-F. Létard, Dalton Trans. 2006, 3058–3066; b) C. Carbonera, C. A. Kilner, J.-F. Létard, M. A. Halcrow,Dalton Trans.2007,
1284–1292; c) G. Chastanet, C. A. Tovee, G. Hyett, M. A. Halcrow, J.-F. Létard,Dalton Trans.2012,41, 4896–4902.
[29] I.Šalitroš, O. Fuhr, R. Kruk, J. Pavlik, L. Pogány, B. Schäfer, M. Tatarko,
R. Boča, W. Linert, M. Ruben, Eur. J. Inorg. Chem.2013, 1049–1057.
[30] I. Šalitroš, L. Pogány, M. Ruben, R. Boča, W. Linert, Dalton Trans.2014,
43, 16584–16587.
Lecren, L. Capes, H. A. Goodwin, J-F. Létard,Chem. Phys. Lett.2002,
358, 87–95; c) J-F. Létard, P. Guionneau, O. Nguyen, J. S. Costa, S.
Marcen, G. Chastanet, M. Marchivie, L. Capes,Chem. Eur. J,2005,11,
4582–4589; d) J-F. Létard, G. Chastanet, P. Guionneau, C. Desplanches
inSpin-crossover materials – properties and applications,M. A. Halcrow (ed.), John Wiley & Sons, Chichester, UK,2013, ch. 19, p. 475–506.
[32] J.-F. Létard,J. Mater. Chem.2006,16, 2550–2559.
[33] O. Kahn, Molecular Magnetism, VCH, Weinheim, Germany,1993.
[34] a) A. Hauser,Coord. Chem. Rev.1991,111, 275−290; b) A. Hauser, C.
Enachescu, M. L. Daku, A. Vargas, N. Amstutz,Coord. Chem. Rev.2006,
250, 1642−1652.
[35] A. Hauser, J. Jeftic, H. Romstedt, R. Hinek, H. Spiering,Coord. Chem. Rev.1999,190−192, 471−491.
[36] I. Krivokapic, C. Enachescu, R. Bronisz, A. Hauser,Inorg. Chim. Acta
2008, 361, 3616−3622.
[37] a) G. Chastanet, A. B. Gaspar, J. A. Real, J.-F. Létard,Chem. Commun.
2001, 819−820; b) G. Chastanet, C. Carbonera, C. Mingotaud, J.-F. Létard,J. Mater. Chem.2004, 14, 3516−3523.
[38] a) V. Niel, A. L. Thompson, A. E. Goeta, C. Enachescu, A. Hauser, A. Galet, M. C. Munoz, J. A. Real,Chem. Eur. J.2005, 11, 2047−2060; b)
J. Klingele, D. Kaase, M. Schmucker, Y. Lan, G. Chastanet, J. F. Létard,
Inorg. Chem.2013, 52, 6000−6010; c) C. Baldé, W. Bauer, E. Kaps, S.
Neville, C. Desplanches, G. Chastanet, B. Weber, J. F. Létard,Eur. J. Inorg. Chem.2013, 2744–2750.
[39] J.-F. Létard, G. Chastanet, O. Nguyen, S. Marcèn, M. Marchivie, P. Guionneau, D. Chasseau, P. Gütlich,Monatsh. Chem.2003, 134, 165–
182.
[40] a) A. Navrotsky, L. Mazeina, J. Majzlan,Science2008,319, 1635–1638;
b) A. Navrotsky, ChemPhysChem 2011, 12, 2207–2215; c) B. D. Hamilton, J.-M. Ha, M. A. Hillmyer, M. D. Ward,Acc. Chem. Res.2012,
45, 414–423; d) Y. Sakata, S. Furukawa, M. Kondo, K. Hirai, N. Horike, Y. Takashima, H. Uehara, N. Louvain, M. Meilikhov, T. Tsuruoka, S. Isoda, W. Kosaka, O. Sakata, S. Kitagawa,Science 2013,339, 193–
196; e) C. Zhang, J. A. Gee, D. S. Sholl, R. P. Lively,J. Phys. Chem. C,
2014,118, 20727–20733.
[41] M. Mikolasek, G. Félix, W. Nicolazzi, G. Molnár, L. Salmon, A. Bousseksou,New J. Chem.2014,38, 1834–1839.
[42] a) J. M. Crettez, E. Coquet, B. Michaux, J. Pannetier, J. Bouillot, P. Orlans, A. Nonat, J. C. Mutin,Physica B 1987, 144, 277–291; b) F.
Iwatsu,J. Phys. Chem.1988,92, 1678–1681; c) I. Yamashita, H. Kawaji, T. Atake, Y. Kuroiwa, A. Sawada, Phys. Rev. B2003,68, 092104/1–
092104/4.
[43] Particle size effects can also be important in spin-crossover transitions, whether or not they involve a crystallographic phase change. See for example ref. [40], and: a) E. W. Müller, H. Spiering, P. Gütlich,Chem. Phys. Lett.1982,93, 567; b) E. König, G. Ritter, S. K. Kulshreshtha, N. Csatary, Inorg. Chem.1984,23, 1903–1910; c) W. D. Federer, D. N.
Hendrickson,Inorg. Chem.1984,23, 3870–3877; d) D. J. Rudd, C. R. Goldsmith, A. P. Cole, T. D. P. Stack, K. O. Hodgson and B. Hedman,
Inorg. Chem. 2005, 44, 1221–1229; e) M. Sorai, R. Burriel, E. F. Westrum, Jr., D. N. Hendrickson,J. Phys. Chem. B2008,112, 4344; f) C.
Chong, A. Slimani, F. Varret, K. Boukheddaden, E. Collet, J.-C. Ameline, R. Bronisz, A. Hauser,Chem. Phys. Lett.2011,504, 29–33.
[44] I. Šalitroš, O. Fuhr, A. Eichhöfer, R. Kruk, J. Pavlik, L. Dlhá , R. Boča, M.
Ruben,Dalton Trans.2012,41, 5163–5171.
[45] C. J. O’Connor,Prog. Inorg. Chem.1982,29, 203–283. [46] G. M. Sheldrick,Acta Crystallogr. Sect. A2008,64, 112–122.
[47] L. J. Barbour,J. Supramol. Chem.2001,1, 189–191.
![Figure 2. Views of the [Fe(bppSMe)2]2+ cation in 1 (top) and [Fe(bppBr)2]2+ in 2(bottom) at 100 K](https://thumb-us.123doks.com/thumbv2/123dok_us/7876361.183097/4.595.37.558.542.761/figure-views-fe-bppsme-cation-fe-bppbr-k.webp)