Formation of Stable Uranium(VI) Colloidal Nanoparticles in
Conditions Relevant to Radioactive Waste Disposal
Pieter Bots,
†Katherine Morris,
†Rosemary Hibberd,
†,‡Gareth T. W. Law,
‡J. Frederick W. Mosselmans,
§Andy P. Brown,
∥James Doutch,
§Andrew J. Smith,
§and Samuel Shaw
*
,††Research Centre for Radwaste & Disposal, and Williamson Research Centre, School of Earth, Atmospheric and Environmental
Sciences, Faculty of Engineering and Physical Sciences, The University of Manchester, Manchester M13 9PL, U.K.
‡Centre for Radiochemistry Research, School of Chemistry, Faculty of Engineering and Physical Sciences, The University of
Manchester, Manchester M13 9PL, U.K.
§Diamond Light Source Ltd., Diamond House, Harwell Science and Innovation Campus, Didcot, Oxfordshire OX11 0DE, U.K.
∥School of Process, Environmental and Materials Engineering, Faculty of Engineering, University of Leeds, Leeds LS2 9JT, U.K.
*
S Supporting InformationABSTRACT: The favored pathway for disposal of higher
activity radioactive wastes is via deep geological disposal. Many geological disposal facility designs include cement in their engineering design. Over the long term, interaction of groundwater with the cement and waste will form a plume of a hyperalkaline leachate (pH 10−13), and the behavior of radionuclides needs to be constrained under these extreme conditions to minimize the environmental hazard from the wastes. For uranium, a key component of many radioactive wastes, thermodynamic modeling predicts that, at high pH, U(VI) solubility will be very low (nM or lower) and controlled
by equilibrium with solid phase alkali and alkaline-earth uranates. However, the formation of U(VI) colloids could potentially enhance the mobility of U(VI) under these conditions, and characterizing the potential for formation and medium-term stability of U(VI) colloids is important in underpinning our understanding of U behavior in waste disposal. Reflecting this, we applied conventional geochemical and microscopy techniques combined with synchrotron based in situand ex situ X-ray techniques (small-angle X-ray scattering and X-ray adsorption spectroscopy (XAS)) to characterize colloidal U(VI) nanoparticles in a synthetic cement leachate (pH > 13) containing 4.2−252 μM U(VI). The results show that in cement leachates with 42 μM U(VI), colloids formed within hours and remained stable for several years. The colloids consisted of 1.5−1.8 nm nanoparticles with a proportion forming 20−60 nm aggregates. Using XAS and electron microscopy, we were able to determine that the colloidal nanoparticles had a clarkeite (sodium−uranate)-type crystallographic structure. The presented results have clear and hitherto unrecognized implications for the mobility of U(VI) in cementitious environments, in particular those associated with the geological disposal of nuclear waste.
■
INTRODUCTIONMany countries including the U.K., USA, and former Soviet Union have significant legacies of radioactive waste materials due to their long history of nuclear power generation and military activities. Typically, the long-term strategy for nuclear waste management of higher activity materials is containment in a geological disposal facility (GDF) within the deep subsurface.1 Currently, in many nations, GDF designs are at a generic stage and will be developed as site selection proceeds. Essentially, the design of a GDF is focused on limiting the mobility and migration of radionuclides.2 Typically, the mobility of radionuclides, and particularly uranium, in the subsurface is governed by solubility and adsorption to geological materials.3 In addition, colloidal transport has the potential to significantly enhance radionuclide migration in geodisposal relevant conditions.3,4 However, it is not known
whether stable U(VI) colloids form under geochemical conditions relevant to radioactive waste disposal in GDFs.
Most scenarios for intermediate level waste (ILW) disposal in a GDF utilize cementitious materials. For example, ILW is typically grouted with Portland cement and emplaced in steel drums, and engineering of any subsurface disposal facility will require use of structural cement.5,6 In addition, some GDF designs are likely to utilize cementitious backfill.2,5,7,8 Post closure, groundwater will resaturate the GDF and interact with the cementitious material forming hyperalkaline leachate (pH 10−13) with elevated concentrations of K, Na, and Ca.9 Specifically, during the initial stages of the evolution of a GDF,
Received: July 18, 2014
Revised: October 4, 2014
Published: October 23, 2014
Article
pubs.acs.org/Langmuir License, which permits unrestricted use, distribution and reproduction in any medium,
and may exist within a GDF for a significant period post closure.10
The benefit of using cementitious materials in the design of a GDF is that U(VI) is expected to exhibit low solubility in the resulting hyperalkaline environment.11 At the pH values of cement leachates (pH 10−13), aqueous U(VI) concentration in equilibrium with, i.e., alkali/alkaline-earth uranates (e.g., Na(UO2)O(OH)·(H2O)0−1 and CaUO4) will be very low (∼10−9 M).11,12 Furthermore, U(VI) adsorbs strongly to the surfaces of many solid phases (e.g., iron oxides,13−15 silicates,14,16 and cement related phases17,18) which will be ubiquitous in the GDF. These factors are predicted to significantly reduce the concentration of aqueous U(VI) in a cementitious GDF. Furthermore, even though the aqueous concentration of carbonate is expected to be low in the deep subsurface, it is noteworthy that the presence of carbonate could significantly enhance U(VI) mobility through the formation of soluble uranium(VI)−carbonate and calcium− uranium(VI)−carbonate complexes.12−14,19
Significantly, U(VI) mobility could also be enhanced by colloids formed within or transported through the GDF.3,20 Depending on the physical and chemical state of these colloidal nanoparticles (e.g., surface charge) and the prevailing geo-chemical conditions, colloids could facilitate the transport of U(VI) into the geosphere.3,4 Previous studies have identified cement and sediment derived colloidal particles3,20 with complexed radionuclides3 and intrinsic radionuclide colloids (e.g., ThO24and Pu(OH)
4 21
) as potentially important transport vectors.3,4Recently, complexation of uranium and plutonium to iron oxides has been implicated in their migration in groundwater.22 Furthermore, uranates, among other U(VI) colloids, have been identified as a potential transport vector,23 and plutonium(IV) colloidal transport has been inferred at the Nevada Test Site, Nye County, NV, USA.24,25
Despite the widely recognized relevance of colloidal transport in radioactive waste disposal and the potential significance of U(VI) in waste disposal, few studies have focused on the formation of colloidal U(VI) nanoparticles. As a result, the aim of this study was to explore the potential for colloidal U(VI) nanoparticle formation in a hyperalkaline synthetic cement leachate (pH > 13) representative of the early stages of the evolution of a GDF. Additionally, where colloidal nanoparticles were found to be present, their characteristics and stability were then determined by conventional chemical and microscopy techniques combined with synchrotron based in situsmall-angle X-ray scattering (SAXS) and X-ray adsorption spectroscopy (XAS).
■
METHODSTo investigate the speciation of U(VI) in conditions relevant to cementitious GDFs, a synthetic cement leachate (pH ∼ 13.1) was prepared by dissolving KOH (0.19 mol), NaOH (0.19 mol), and
equilibrium concentrations of U(VI) in the synthetic cement leachate when a single U(VI) phase precipitated. These phases included the minerals clarkeite (Na(UO2)O(OH)·(H2O)0−1), becquerelite (Ca-(UO2)6O4(OH)6·(H2O)8), compreignacite (K2(UO2)6O4(OH)6· (H2O)7), and several Ca/Na uranate phases. The PHREEQC calculations were performed using the SIT (specific ionic theory) database, which includes thermodynamic information on clarkeite, becquerelite, and compreignacite from Gorman-Lewis et al.12 and sodium and calcium uranates from O’Hare et al.27The thermodynamic equilibrium constants of uranyl hydroxide complexes as determined by Zanonato et al.28were also included.
Small Angle X-ray Scattering. SAXS was used to characterize suspended/colloidal particles in the 42 μM U(VI) experiments, as described earlier, using beamline I22 at Diamond Light Source. All analyses were performed using a monochromatic X-ray beam at 12 keV and a 4 or 10 m camera length. Scattering patterns were collected using a 2D PILATUS 2 M detector.29Two sets of experiments were performed. First, samples aged for 1 week, 20 months, and 32 months were characterized. Here, the samples were injected into a quartz capillary in line with the X-ray beam and SAXS patterns were collected. Second,in situtime-resolved SAXS analyses were performed to study the formation of colloidal U(VI) nanoparticles. These experiments were performed at the I22 experimental hutch by spiking the synthetic cement leachate to afinal concentration of 42μM U(VI). The solution was then stirred for∼15 s, injected into a quartz capillary in-line with the X-ray beam, and sealed. SAXS measurements were started concurrently to the U(VI) spike. Typically, the first full scattering frame was acquired at ∼2 min after the injection of the U(VI) spike. Scattering patterns were collected for up to 7 h at a 1−10 s/frame collection rate.
SAXS Data Analyses. The scattering patterns from the aged samples, collected using the 4 and 10 m camera lengths, were combined to form a single scattering pattern with a large scattering vector (q) range. All SAXS patterns were modeled using the Irena macro for Igor Pro.30Additionally, the SAXS patterns from thein situ time-resolved experiments were analyzed to determine the invariant (Q) andI(0),31described in detail in the Supporting Information (SI). In short,QandI(0) are a function of the scattering volume and the density of the scatterers and I(0)/Q is a function of the particle volume (eq 1, Vp is the particle volume in Å3).31−33 Additionally, separateQ andI(0), and thusI(0)/Q, can be estimated for particle populations with different particle volumes in a dilute suspension34to track the evolution of different particle populations.
≈
I
Q V
(0)
p
(1)
software. TEM images were analyzed using image processing software ImageJ.35
X-ray absorption spectroscopy (XAS) analyses were performed at beamline B18 at Diamond Light Source, at the U LIII-edge using a Si(111) monochromator at liquid nitrogen temperature. Two samples were analyzed; first, a solid sample from the 252 μM U(VI) experiment was prepared by centrifuging at 2600g. The residue was then analyzed in transmission mode. Second, a 1 mL solution aliquot of the 42μM U(VI) experiment aged for 1 month was analyzed in
fluorescence mode. XAS data analyses were performed using Athena and Artemis from the Demeter software package using FEFF6.36
■
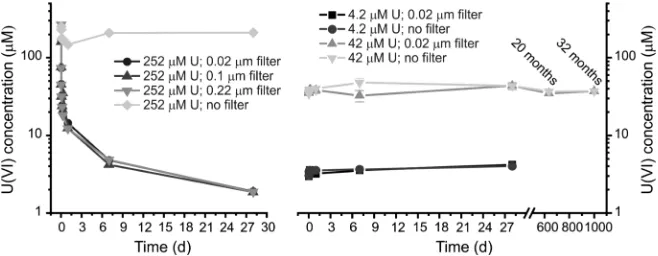
RESULTS AND DISCUSSIONDuring the 252 μM U(VI) experiments a yellow precipitate formed and solution analyses showed that the U(VI) concentration in all of the filtered samples decreased to 1.4 μM (Figure 1a) over 28 days. Conversely, the unfiltered (and undisturbed) solution samples only showed a minor decrease in the U(VI) concentration to ∼200 μM U(VI) (Figure 1a) suggesting the presence of a colloidal U(VI) component with particle size > 0.22 μm in the 252 μM U(VI) experiment. Interestingly, the 42 and 4.2 μM U(VI) experiments did not show any visible precipitation or removal of U(VI) from solution duringfiltration up to 32 months (Figure 1b). This is in contrast to the thermodynamic modeling using PHREEQC,26 which showed the solutions were (highly) supersaturated with respect to several calcium and sodium uranate phases (Table 1). It is worth noting that the introduction of carbonate (including Ca−UO2−CO3 com-plexes19) due to the dissolution of calcite had no significant effect on the equilibrium concentrations in Table 1. These results indicated that, in the 42 and 4.2μM systems, U(VI) was either dissolved in a supersaturated metastable state or that stable colloidal U(VI) nanoparticles (≤0.02μm) were present.
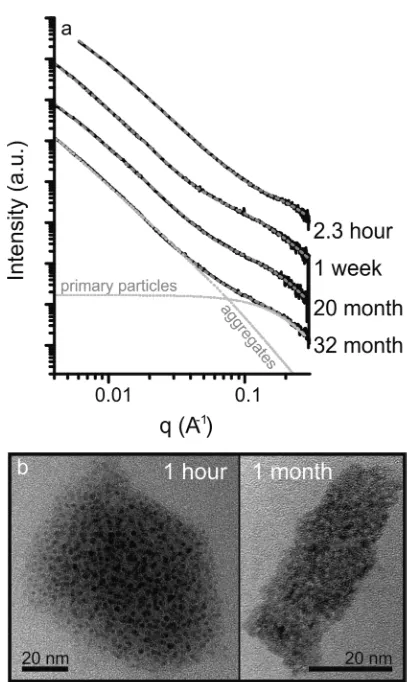
Small Angle X-ray Scattering.SAXS patterns of the aged solutions from the 42μM U(VI) experiments are presented in
[image:3.625.148.477.68.196.2]Figure 2a. The observed scattering intensity suggests that colloidal U(VI) was present in the 42μM U(VI) experiments. The bestfit to the SAXS patterns using the Irenafitting package consisted of a two particle population model: Smaller/primary particles (highqvalues) were modeled using a form factor for spherical particles, and larger particles (low q values), presumptively aggregates of the primary particles, were modeled using the form factor for algebraic globules.37,38 In all cases the scattering patterns were modeled as dilute systems reflecting the (relatively) low concentration of U(VI). Fits to the respective scattering patterns are shown in Figure 2a, and thefit parameters are given in Table 2. Briefly, by 2.3 h, the primary particles reached a mean diameter of 1.54±0.05 nm and 57±12% of the scattering solids formed aggregates with a mean diameter of 22.4±2.8 nm (Table 2). Beyond 2.3 h, there was little significant change in the particle populations over 32 months, with a primary particle diameter of 1.60−1.82 nm and between 33−57% of the scattering solids within aggregates of 42.2−60.0 nm. The only significant change in the particles over the observation period was an increase in the mean aggregate diameter from 22.4 to 56.0 nm between 2.3 h and 1 week. The results from the SAXS patterns were supported by TEM images of 1 h and 1 month samples from parallel experiments, with evidence for 1−2 nm primary particles which formed aggregates to 20−60 nm in size (Figure 2b). The aggregate morphology observed by TEM was consistent with the algebraic globules form factor used in the SAXS modeling approach. It should however be noted that air drying nanoparticle suspensions for TEM analysis could alter aggregate morphology;39 however, due to the consistency between the SAXS and TEM analyses we are confident that the TEM images are a representation of the in situ colloidal nanoparticles. Overall, the SAXS analyses indicate that the U(VI) in this system was present as colloidal U(VI) nanoparticles and underwent very little change from 2.3 h up
[image:3.625.73.564.278.336.2]Figure 1.Solution data from the 252μM U(VI) experiment (a) and the 42 and 4.2μM U(VI) experiments (b). The error bars on the data from the 42μM U(VI) experiment are the standard deviation of triplicate experiments; the results fromfiltering the solutions through 0.1 and 0.22μmfilters from the 42 and 4.2μM U(VI) experiments showed no differences compared to the plotted results and are given in Figure 2 in the SI.
Table 1. PHREEQC26Calculations on the Concentration of U(VI) in Equilibrium with Selected Phases in the Cement Leachatea
U(VI) concn (μM) in equilibrium with solid phase
exp (μM U(VI)) measd U(VI) concn (μM) Compb CaUO4 CaU2O7c Becqd clarkeitee
252 1.88±0.02f 180 131 35.8 50.4 0.00935
42 44.7±2.9 42.0 9.15×10⁻⁶ 13.4 42.0 0.00926
4.2 4.27±0.05 4.20 6.21×10⁻⁶ 4.20 4.20 0.00925
aNote that when the concentrations calculated are identical to the input concentrations, these phases are below saturation in the corresponding
to 32 months. Interestingly, the 0.02μmfiltration samples from the 42μM U(VI) experiment showed no removal from solution (Figure 1) even though TEM and SAXS analysis suggest the presence of aggregates > 20 nm (Figure 2 and Table 2). This suggests artifacts fromfiltration and/or facile disaggregation of colloidal nanoparticles upon forced filtration through 20 nm pores.
Time-resolved I(0) data from the in situ 42 μM U(VI) experiments (4 and 10 m camera length) are shown in Figure 3a. The above background I(0) in the first scattering pattern collected (at∼2 min; Figure 3a) suggested particle formation prior to∼2 min. Between 2 min and 2.3 h,I(0) increased
10-the size determined using Irena. The aggregate volume (Irena) andI(0)/Qvalues as a function of time are consistent (Figure 3b), giving confidence that I(0)/Q reflects particle volume trends in the 42μM U(VI) experiment. The aggregate diameter increased up to∼22.4 nm (Figure 3b and Table 2) during the
first 1.5 h of the experiment (Figure 3b, vertical line) and then remained constant. This initial growth of the aggregates was presumably due to primary particle aggregation and/or nucleation of particles on the aggregate surface. Between
∼1.5 and∼2.3 h the aggregate size did not increase, whileI(0) increased about 3-fold (Figure 3). This indicates that continuous formation of colloidal nanoparticles/aggregates occurred after the aggregate size reached a maximum. The
I(0)/Qfor the primary particles remained constant (Figure 3b), indicating that the primary particles formed at∼1.5 nm (Table 2) in diameter and did not change in size. Thus, the formation mechanism of the primary particles was likely nucleation dominated, with no significant particle growth occurring (e.g., ripening).40,41
The persistence of a significant fraction of unaggregated primary particles (Table 2) could have been caused by the high pH. The pH at the point of zero charge for several uranyl oxy-hydroxides is 4−4.5.42It is thus clear that U(VI) (oxyhydr)-oxide nanoparticles would have a highly negative surface charge at pH 13.1. Thus, electrostatic repulsion would minimize (further) particle aggregation consistent with our observations and potentially reduce the interaction of U(VI) with materials present in a cementitious GDF system.
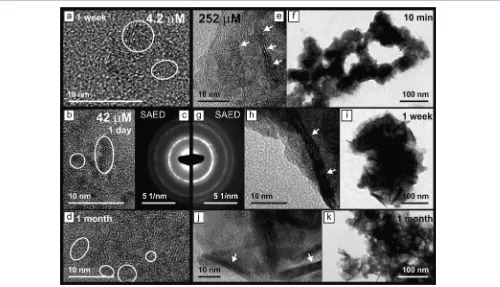
[image:4.625.77.281.61.402.2]Solid Characterization.HR-TEM images of the colloidal nanoparticles (1 day and 1 month) from the 42 μM U(VI) experiment are shown in Figure 4b,d. The 1−2 nm particles collected after 1 h (Figure 2b) lacked any resolvable lattice fringes, suggesting an amorphous character. By contrast, the nanoparticles from 1 day to 1 month had visible lattice fringes (emphasized by circles, Figure 4b,d) which were spaced at 3.0− 3.3 Å. Reflecting on this, the primary particles in the 42 μM U(VI) experiments initially formed as amorphous nano-particles, potentially due to the aggregation of stable prenucleation clusters akin to the observed dynamically ordered liquid-like oxy-anion polymers (DOLLOP) observed during the
Figure 2.(a) Small angle X-ray scattering patterns from the 42μM U(VI) experiments (continuous black lines) including thefits (dashed gray lines). Thefit to the pattern collected from the 32 month sample has also been divided between the scattering from the primary particles and the aggregates (dotted gray lines). (b) TEM images of the colloidal U(VI) nanoparticle 1 h and 1 month after spiking the cement leachate with U(VI).
Table 2. Results of the Fits from the SAXS Patterns from the 42μM U(VI) Experiments
primary particles aggregates fraction of aggregated particles
sample name mean diam (nm)a polydispersitya,b mean diam (nm)a polydispersitya,b [V
aggr/(Vaggr+ Vprim)]×100 (%)a,c
2.3 h 1.54±0.05 0.20±0.20 22.4±2.8 1.62±0.25 57±12
1 week 1.60±0.26 0.63±0.11 56.0±18.2 1.06±0.23 33±15
20 month 1.82±0.22 0.48±0.15 42.2±11.6 1.48±0.86 44±16
32 month 1.75±0.16 0.47±0.11 60.0±30.0 2.44±0.17 57±14
[image:4.625.60.566.662.734.2]formation of amorphous calcium carbonate.43,44 Furthermore, the amorphous uranium nanoparticles became nanocrystalline during the course of a day. The crystallinity of the nanoparticles is also emphasized by visible polycrystalline rings in the selected area electron diffraction patterns (SAED, Figure 4c) collected from the 1 day sample. Additionally, the EDX analyses of the nanoparticles formed during the 42 μM U(VI) experiments show that the particles consisted of U, Na, K, and Ca (Figure 5).
HR-TEM image from a 1 week sample collected from the 4.2 μM U(VI) experiment shows crystalline nanoparticles of 2−5
nm within a∼10 nm aggregate (Figure 4a). This confirms that U(VI) colloids also formed in the 4.2μM U(VI) experiment and were of a similar size and aggregation state to those formed
in the 42 μM U(VI) experiment. Furthermore, TEM
[image:5.625.145.478.66.235.2]characterization shows that the crystallinity (lattice fringes spaced at 3.0−3.3 Å, emphasized by circles in Figure 4a) and composition (U, Na, K, and Ca, Figure 5) of the nanoparticles were also similar to those from the 42μM U(VI) experiment. High-resolution TEM (HR-TEM) images of the particles throughout the 252 μM experiments show small crystalline platelets with lattice fringes spaced at 5.9−6.2 Å (arrows, Figure
Figure 3.a)I(0) for the 42μM U(VI) experiments collected using a 4 and 10 m camera length; the data from both experiments were aligned for clarity; b)I(0)/Q(particle volume; eq 1 and SI) for the aggregates and the primary particles calculated from the experiment performed using the 4m camera length including the aggregate volume calculated from thefitting results using the Irena macro.
[image:5.625.64.564.278.565.2]4e,h,j) and 3.0−3.3 Å. These particles formed part of larger aggregated structures (Figure 4f,I,k). At 10 min, these platelets were 2−10 nm in size and the 5.9−6.2 Å lattice fringes were aligned in some adjacent particles, indicating that the particle size may be increasing via oriented attachment.45 After 1 month, the crystalline domains with 5.9−6.2 Å lattice fringes grew to about 25 nm in diameter with a width of ∼4 nm (arrows, Figure 4j). These observations confirm that initially nanocrystalline particles formed from solution and grew through oriented attachment.45
The SAED patterns from the 42 and 252 μM U(VI) experiments (Figure 4c,g) and EDX spectra (Figure 5) from the aggregates from the 4.2, 42, and 252 μM U(VI) experiments
fringes in the particles from the 4.2 and 42 μM U(VI) experiments is likely caused by the limited size of the nanoparticles or limited order between adjacent U layers. Finally, TEM analyses suggest that in all experiments, initially nanoparticles formed (1−5 nm) from solution which then aggregated. In the 252 μM experiment the freshly formed nanoparticles crystallized presumably via oriented attachment to form larger platelets.
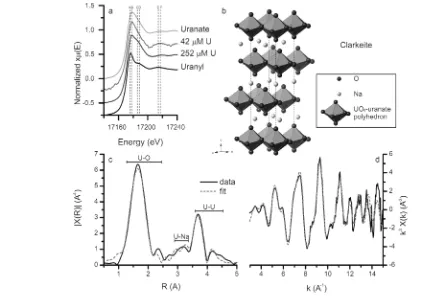
The U LIII-edge XANES spectra from the 252 μM U(VI) experiment precipitate and a solution aliquot from the 42μM U(VI) experiments are plotted in Figure 6a. Also plotted are the XANES from uranate17,48 and uranyl standard (Figure 6a) compounds. Both spectra from the experimental samples show relatively broad white lines at ∼17.178 keV (dashed line B, Figure 6a) similar to the uranate standard, while the uranyl standard has a sharper white line at∼17.176 keV (dashed line A, Figure 6a). In addition, the positions of the resonance features in both experimental XANES spectra match those of chemical symbol (for uranium theLandMlines were observed; only
[image:6.625.95.264.69.169.2]the latter are shown), the copper in the EDX spectra is caused by the TEM grids, and the silicon is likely caused by contamination from the TEM grid box.
[image:6.625.72.494.404.700.2]the uranate standard (dashed lines C−F, Figure 6a).49 This indicates that, in the 42 μM U(VI) experiment, uranium is predominantly present as colloidal uranate nanoparticles, rather than as dissolved uranyl or a solid uranyl compound.
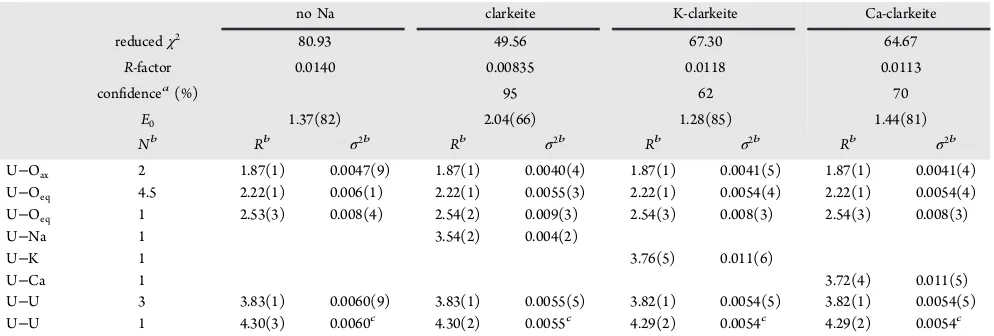
The extended X-ray adsorption fine structure (EXAFS) spectrum and corresponding Fourier transform for the 252μM U(VI) precipitate are shown in Figure 6c,d. Four consecutive
fits were performed on the EXAFS spectrum. Thefirstfit was calculated using only U−O and U−U bonds from clarkeite.47,51 As observed in the TEM-EDX analyses, the composition of the precipitated phase included Na, Ca, and K (Figure 5). Thus, three subsequentfits were refined by including Na, K, or Ca.47 The U−Oaxialbond length of 1.87 Å corresponds to the U− Oaxialbond lengths in uranate phases (1.86−1.97 Å)17,51,52and is longer than the U−Oaxial bond lengths in uranyl phases (1.70−1.82 Å).52,53 Furthermore, the U−Oeq1 of 2.22 Å is comparable to U−Oeq1distances calculated for several layered metal uranate phases at 2.15−2.30 Å17,51,52 while U Oeq1 distances in uranyl phases are 2.27−2.49 Å.51,53 Combined with the SAED (Figure 4g) and the XANES (Figure 6a), this confirms the formation of an alkali/alkaline-earth uranate phase in the 252μM U(VI) experiments (and, by extension, in the 4.2 and the 42μM U(VI) experiments). Furthermore, adding Na, K, or Ca to the EXAFS model significantly improved the overall
fit (Table 3) with the result resembling the structure of clarkeite ((Na,K,Ca)UO2O(OH)·(H2O)0−1, Table 4 and Figure 6b−d).47,51 However, in relation to the structure previously determined,47 the oxygen coordination around uranium appears distorted; the U − Oeq distances were split between bond lengths of 2.22 and 2.54 Å (Table 3) instead of only at 2.30 Å (Table 4). This is similar to the observation of Catalano and Brown51 (Table 4) who explained this by suggesting clarkeite is not truly hexagonal, and variable hydration of clarkeite could cause multiple uranium crystallo-graphic positions and changes in the cation occupation. Furthermore, the U−Na distance is ∼5% shorter than previously determined,47,51 which could be caused by distortions induced by variable hydration or the incorporation of foreign elements such as Ca and K in the interlayer (Figure 5).51Interestingly, the EXAFSfits were also improved by the addition of K and Ca (Table 3), indicating that these may be
replacing some of the Na in the interlayer of clarkeite, which has been observed previously in natural samples.47 Thus, the identification of a clarkeite-type phase containing a mixture of Na, K, and Ca is confirmed, which is consistent with the formation of similar phases in other high-pH systems.54,55
Nanoparticle Solubility.As discussed previously uranium in the 4.2 and 42 μM U(VI) experiments (Figure 6a) was present as colloidal clarkeite nanoparticles. Additionally, the PHREEQC calculations show that if the solutions were in equilibrium with clarkeite, 100.0 and 99.8% of the U(VI) would be in the solid phase in the 42 and 4.2μM U(VI) experiments, respectively. However, because reducing the size of nano-particle tends to increase their solubility,56a smaller proportion of U(VI) could be in the solid phase. The solubility of a phase tends to increase with decreasing nanoparticle size as described (increasing specific surface area, A(m2/mol)) via eq 2,57−59
σ
= +
K K A
RT
log[ ] log[ ] 2
3
sp,nano sp (2)
[image:7.625.69.566.95.263.2]where Ksp and Ksp,nano are the ion activity products at equilibrium with a bulk and nanoparticulate phase, respectively (Ksp= 109.4),12Tis the absolute temperature (239 K),Ris the universal gas constant (8.3145 J/K), andσ is the surface free energy (J/m2). However, the surface free energy of clarkeite is Table 3. Summary of the EXAFS Parameters Fitted for a Uranium Phase without Na, for Clarkeite (NaUO2O(OH)·(H2O)0−1) and for Clarkeite Where Sodium Was Substituted for Potassium and Calcium (K-Clarkeite and Ca-Clarkeite, Respectively)
no Na clarkeite K-clarkeite Ca-clarkeite
reducedχ2 80.93 49.56 67.30 64.67
R-factor 0.0140 0.00835 0.0118 0.0113
confidencea(%) 95 62 70
E0 1.37(82) 2.04(66) 1.28(85) 1.44(81)
Nb Rb σ2b Rb σ2b Rb σ2b Rb σ2b
U−Oax 2 1.87(1) 0.0047(9) 1.87(1) 0.0040(4) 1.87(1) 0.0041(5) 1.87(1) 0.0041(4)
U−Oeq 4.5 2.22(1) 0.006(1) 2.22(1) 0.0055(3) 2.22(1) 0.0054(4) 2.22(1) 0.0054(4)
U−Oeq 1 2.53(3) 0.008(4) 2.54(2) 0.009(3) 2.54(3) 0.008(3) 2.54(3) 0.008(3)
U−Na 1 3.54(2) 0.004(2)
U−K 1 3.76(5) 0.011(6)
U−Ca 1 3.72(4) 0.011(5)
U−U 3 3.83(1) 0.0060(9) 3.83(1) 0.0055(5) 3.82(1) 0.0054(5) 3.82(1) 0.0054(5)
U−U 1 4.30(3) 0.0060c 4.30(2) 0.0055c 4.29(2) 0.0054c 4.29(2) 0.0054c
aConfidence level whether thefit was significantly improved by adding the Na, K, or Ca shell compared to the uranium phase without Na; calculated
[image:7.625.322.566.344.483.2]using theF-test for EXAFS.50bNis the coordination number,Ris the distance between uranium and the scatterer, andσ2is the Debye−Waller factor.cConstrained parameter.
Table 4. Clarkeite Uranium Coordination Environment Obtained from Literature, Modeled from an XRD Pattern and an EXAFS Spectrum
clarkeite N R
XRD47 U−Oax 2 1.888
U−Oeq 6 2.299
U−Na 6 3.725
U−U 6 3.954
EXAFS51 U-Oax 2 1.868
U-Oeq 3.3 2.28
U-Oeq 1.7 2.51
U−Na 2 3.71
U−U 2 3.73
U−U 2 3.88
(a third of the unit cell of clarkeite, 0.0797 nm3).12,47
It is noteworthy that the nanoparticles nucleate as an amorphous phase. However, no thermodynamic information is available on amorphous uranate phases. Thus, we assumed that the thermodynamic properties of the amorphous phase are close to clarkeite. As discussed earlier, the SAXS and TEM analyses indicate that the U(VI) nucleated as∼1.5 nm particles (r*≈
0.75 nm); therefore this value was used as an upper limit for the critical nucleus size. The clarkeite unit cell size was used as the lower limit of the critical nucleus size (r* ≈ 0.4 nm). Using these values resulted in a σ for clarkeite of 0.085−0.16 J/m2, which is low compared to theσof metaschoepite (0.94 J/m2) and uraninite (0.47 J/m2).57,61
The rate of crystal growth and ripening (e.g., Ostwald ripening) are proportional to σ;58,59 therefore, such a low σ could explain the lack of significant ripening of the primary particles following nucleation. Combined with the inhibition of aggregation caused by a highly negative surface charge, this explains the long-term stability (>32 months) of the colloidal U(VI) nanoparticles.
The σ of 0.085−0.16 J/m2 can now be used in eq 2 to estimate the solubility of clarkeite nanoparticles with a diameter of 1.5 nm (A ≈ 1.9 × 10⁴ m2/mol). The resulting Ksp,nano (109.8−1010.2) was included in the PHREEQC calculations on U(VI) equilibrium concentrations in the experimental solutions (95 mM Na, 95 mM K, and 0.14 mM Ca) with 42 and 4.2μM U(VI) experiments. This predicted equilibrium concentrations of ≤0.07 μM U(VI), and as described previously, the equilibrium concentration changed minimally (∼0.074 μM U(VI)) when equilibrium with calcite was added to the PHREEQC calculations. These values would mean that 99.8 and 98.3% of the U(VI) would be in the solid phase in the 42 and 4.2μM U(VI) experiments, respectively. This supports our interpretation that U(VI) is predominantly colloidal in all experiments rather than dissolved uranyl.
■
CONCLUDING REMARKSThis study has identified the formation of nanoparticulate, stable U(VI) clarkeite-type colloids at high-pH conditions relevant to geological disposal and contaminated land.8,9,23,55 Time-resolved scattering data and TEM images showed that these particles nucleate as amorphous nanoparticles (o.d. = 1.5−1.8 nm) within a few minutes and that ∼50% of the colloids are present as aggregates 20−60 nm in size, which is stable for over 2.5 years. Within 1 day the nanoparticles crystallize and exhibit a clarkeite-type crystal structure.
The long-term stability of U(VI) as a nanoparticulate phase at high-pH conditions is a significant new observation. Thermodynamic calculations show that clarkeite-type U(VI) nanoparticles are oversaturated at very low concentrations (> 0.07 μM) even when including equilibrium with calcium carbonate into the system. This suggests that these clarkeite
ing references, figures showing SAXS pattern simulation and the corresponding Kratky plot, uranium solution analyses from 42 and 4.2μM U(VI) experiments, and a selected area electron diffraction image from the clarkeite nanoparticle, and a table listing simulated SAXS pattern calculations. This material is available free of charge via the Internet at http://pubs.acs.org.
■
AUTHOR INFORMATIONCorresponding Author
*E-mail: sam.shaw@manchester.ac.uk. Tel.: +44 (0) 161275 3826.
Notes
The authors declare no competingfinancial interest.
■
ACKNOWLEDGMENTSThis project has been funded as part of the U.K. Natural Environment Research Council (NERC) BIGRAD consortium through Grant No. NE/H007768/1. Diamond Light Source is thanked for providing beamtime Grants SP5975 (SAXS) and SP8544 (XAS) and Dr. Steve Parry and Richard Doull for assistance at Diamond. We also thank Paul Lythgoe for his assistance with the ICP-MS analyses.
■
REFERENCES(1) Defra; BERR; Devolved Administrations for Wales and Northern IrelandManaging Radioactive Waste Safely: A Framework for
Implement-ing Geodisposal, A White Paper; The Stationary Office (TSO):
Norwich, U.K., 2008.
(2) Morris, K.; Law, G. T. W.; Bryan, N. D., Geodisposal of Higher Activity Wastes.Nuclear Power and the Environment; The Royal Society of Chemistry: Cambridge, U.K., 2011; pp 129−151.
(3) Silva, R. J.; Nitsche, H. Actinide environmental chemistry.
Radiochim. Acta1995,70-1, 377−396.
(4) Walther, C.; Denecke, M. A. Actinide Colloids and Particles of Environmental Concern.Chem. Rev.2013,113(2), 995−1015.
(5) Geological DisposalAn overview of the generic Disposal System
Safety Case December 2010, NDA Report No. NDA/RWMD/010;
Nuclear Decommissioning Authority: Oxon, U.K., 2010.
(6) Wieland, E.; Spieler, P. Colloids in the mortar backfill of a cementitious repository for radioactive waste.Waste Manage.2001,21 (6), 511−523.
(7)Geological Disposal; Generic Post-closure Safety Assessment, NDA
Report No. NDA/RWMD/030; Nuclear Decommissioning Authority: Oxon, U.K., 2010; http://www.nda.gov.uk/publication/geological-disposal-generic-post-closure-safety-assessment-december-2010/.
(8) Wieland, E.; Bonhoure, I.; Fujita, T.; Tits, J.; Scheidegger, A. M. Combined wet chemistry and EXAFS studies on the radionuclide immobilisation by cement and calcium silicate hydrates. Geochim.
Cosmochim. Acta2003,67(18), A532−A532.
(10) Gaona, X.; Kulik, D. A.; Mace, N.; Wieland, E. Aqueous-solid solution thermodynamic model of U(VI) uptake in C-S-H phases.
Appl. Geochem.2012,27(1), 81−95.
(11) Yamamura, T.; Kitamura, A.; Fukui, A.; Nishikawa, S.; Yamamoto, T.; Moriyama, H. Solubility of U(VI) in highly basic solutions.Radiochim. Acta1998,83(3), 139−146.
(12) Gorman-Lewis, D.; Fein, J. B.; Burns, P. C.; Szymanowski, J. E. S.; Converse, J. Solubility measurements of the uranyl oxide hydrate phases metaschoepite, compreignacite, Na−compreignacite, becquer-elite, and clarkeite.J. Chem. Thermodyn.2008,40(6), 980−990.
(13) Waite, T. D.; Davis, J. A.; Payne, T. E.; Waychunas, G. A.; Xu, N. Uranium(VI) adsorption to ferrihydrite: Application of a surface complexation model.Geochim. Cosmochim. Acta1994,58(24), 5465− 5478.
(14) Davis, J. A.; Meece, D. E.; Kohler, M.; Curtis, G. P. Approaches to surface complexation modeling of uranium(VI) adsorption on aquifer sediments.Geochim. Cosmochim. Acta2004,68(18), 3621− 3641.
(15) Duff, M. C.; Coughlin, J. U.; Hunter, D. B. Uranium co-precipitation with iron oxide minerals. Geochim. Cosmochim. Acta 2002,66(20), 3533−3547.
(16) Sylwester, E. R.; Hudson, E. A.; Allen, P. G. The structure of uranium (VI) sorption complexes on silica, alumina, and montmor-illonite.Geochim. Cosmochim. Acta2000,64(14), 2431−2438.
(17) Macé, N.; Wieland, E.; Dahn, R.; Tits, J.; Scheinost4, A. C.̈ EXAFS investigation on U(VI) immobilization in hardened cement paste: Influence of experimental conditions on speciation.Radiochim. Acta2013,101(6), 379−389.
(18) Tits, J.; Geipel, G.; Mace, N.; Eilzer, M.; Wieland, E. Determination of uranium(VI) sorbed species in calcium silicate hydrate phases: A laser-induced luminescence spectroscopy and batch sorption study.J. Colloid Interface Sci.2011,359(1), 248−256.
(19) Dong, W.; Brooks, S. C. Determination of the Formation Constants of Ternary Complexes of Uranyl and Carbonate with Alkaline Earth Metals (Mg2+, Ca2+, Sr2+, and Ba2+) Using Anion Exchange Method.Environ. Sci. Technol.2006,40(15), 4689−4695.
(20) Li, D.; Kaplan, D. I.; Roberts, K. A.; Seaman, J. C. Mobile Colloid Generation Induced by a Cementitious Plume: Mineral Surface-Charge Controls on Mobilization.Environ. Sci. Technol.2012, 46(5), 2755−2763.
(21) Parry, S. A.; O’Brien, L.; Fellerman, A. S.; Eaves, C. J.; Milestone, N. B.; Bryan, N. D.; Livens, F. R. Plutonium behaviour in nuclear fuel storage pond effluents.Energy Environ. Sci.2011,4(4), 1457−1464.
(22) Novikov, A. P.; Kalmykov, S. N.; Utsunomiya, S.; Ewing, R. C.; Horreard, F.; Merkulov, A.; Clark, S. B.; Tkachev, V. V.; Myasoedov, B. F. Colloid Transport of Plutonium in the Far-Field of the Mayak Production Association, Russia.Science2006,314(5799), 638−641.
(23) Utsunomiya, S.; Kersting, A. B.; Ewing, R. C. Groundwater nanoparticles in the far-field at the nevada test site: Mechanism for radionuclide transport.Environ. Sci. Technol.2009,43(5), 1293−1298. (24) Kersting, A. B.; Efurd, D. W.; Finnegan, D. L.; Rokop, D. J.; Smith, D. K.; Thompson, J. L. Migration of plutonium in ground water at the Nevada Test Site.Nature1999,397(6714), 56−59.
(25) Powell, B. A.; Dai, Z.; Zavarin, M.; Zhao, P.; Kersting, A. B. Stabilization of Plutonium Nano-Colloids by Epitaxial Distortion on Mineral Surfaces.Environ. Sci. Technol.2011,45(7), 2698−2703.
(26) Parkhurst, D. L.; Appelo, C. A. J.User’s guide to PHREEQC
(version 2)A computer program for speciation, batch-reaction,
one-dimensional transport, and inverse geochemical calculations; U.S.
Geological Survey: Denver, CO, USA, 1999; p 312.
(27) O’Hare, P. A. G.; Boerio, J.; Hoekstra, H. R. Thermochemistry of uranium compounds VIII. Standard enthalpies of formation at 298.15 K of the uranates of calcium (CaUO4) and barium (BaUO4). Thermodynamics of the behavior of barium in nuclear fuels.J. Chem.
Thermodyn.1976,8(9), 845−855.
(28) Zanonato, P. L.; Di Bernardo, P.; Grenthe, I. A calorimetric study of the hydrolysis and peroxide complex formation of the uranyl(VI) ion.Dalton Trans.2014, 43.
(29) Kraft, P.PILATUS 2M; A detector for small angle X-ray scattering; ETH Zürich, Zurich, Switzerland, 2010.
(30) Ilavsky, J.; Jemian, P. R. Irena: Tool suite for modeling and analysis of small-angle scattering. J. Appl. Crystallogr. 2009,42 (2), 347−353.
(31) Liu, J.; Pancera, S.; Boyko, V.; Shukla, A.; Narayanan, T.; Huber, K. Evaluation of the Particle Growth of Amorphous Calcium Carbonate in Water by Means of the Porod Invariant from SAXS.
Langmuir2010,26(22), 17405−17412.
(32) Glatter, O.; Kratky, O.Small Angle X-ray Scattering; Academic Press: London, 1982.
(33) Porod, G. Die Rontgenkleinwinkelstreuung Von Dichtgepackten Kolloiden Systemen.1.Kolloid Z. Z. Polym.1951,124(2), 83−114.
(34) Rose, A. L.; Bligh, M. W.; Collins, R. N.; Waite, T. D. Resolving early stages of homogeneous iron(III) oxyhydroxide formation from iron(III) nitrate solutions at pH 3 using time-resolved SAXS.Langmuir 2014,30(12), 3548−3556.
(35) Abràmoff, M. D.; Magalhaes, P. J.; Ram, S. J. Image Processing̃ with ImageJ.Biophotonics Int.2004,11(7), 36−42.
(36) Ravel, B.; Newville, M. ATHENA, ARTEMIS, HEPHAESTUS: Data analysis for X-ray absorption spectroscopy using IFEFFIT. J.
Synchrotron Radiat.2005,12, 537−541.
(37) Allen, A. J.; Livingston, R. A. Relationship between differences in silica fume additives and fine-scale microstructural evolution in cement based materials.Adv. Cem. Based Mater.1998,8(3−4), 118− 131.
(38) Reidy, R. F.; Allen, A. J.; Krueger, S. Small angle neutron scattering characterization of colloidal and fractal aerogels. J.
Non-Cryst. Solids2001,285(1−3), 181−186.
(39) Hondow, N.; Brydson, R.; Wang, P.; Holton, M. D.; Brown, M. R.; Rees, P.; Summers, H. D.; Brown, A. Quantitative characterization of nanoparticle agglomeration within biological media. J. Nanopart. Res.2012,14(7), No. 977.
(40) Bots, P.; Benning, L. G.; Rodriguez-Blanco, J.-D.; Roncal-Herrero, T.; Shaw, S. Mechanistic Insights into the Crystallization of Amorphous Calcium Carbonate (ACC).Cryst. Growth Des.2012,12 (7), 3806−3814.
(41) Tobler, D. J.; Shaw, S.; Benning, L. G. Quantification of initial steps of nucleation and growth of silica nanoparticles: An in-situ SAXS and DLS study.Geochim. Cosmochim. Acta2009,73(18), 5377−5393. (42) Vochten, R.; Van Haverbeke, L.; Sobry, R. Transformation of schoepite into uranyl oxide hydrates of the bivalent cations Mg2+, Mn2+and Ni2+.J. Mater. Chem.1991,1(4), 637−642.
(43) Demichelis, R.; Raiteri, P.; Gale, J. D.; Quigley, D.; Gebauer, D. Stable prenucleation mineral clusters are liquid-like ionic polymers.
Nat. Commun.2011,2, No. 590.
(44) Gebauer, D.; Völkel, A.; Cölfen, H. Stable Prenucleation Calcium Carbonate Clusters.Science2008,322(5909), 1819−1822.
(45) Van Driessche, A. E. S.; Benning, L. G.; Rodriguez-Blanco, J. D.; Ossorio, M.; Bots, P.; Garcia-Ruiz, J. M. The Role and Implications of Bassanite as a Stable Precursor Phase to Gypsum Precipitation.Science 2012,336(6077), 69−72.
(46) Loopstra, B.; Rietveld, H. The structure of some alkaline-earth metal uranates.Acta Crystallogr., Sect. B: Struct. Crystallogr. Cryst. Chem. 1969,25(4), 787−791.
(47) Finch, R. J.; Ewing, R. C. Clarkeite: New chemical and structural data.Am. Mineral.1997,82(5), 607−619.
(48) Scheinost, A. C.; Schmeisser, N.; Banerjee, D.; Rossberg, A.; Denecke, M.; Dardenne, K.; Rothe, J.; Daehn, R. AcXAS An Actinide Reference X-ray Absorption Spectroscopy Database. https://www. hzdr.de/acxas 2013.
(49) Connelly, A. J.; Hyatt, N. C.; Travis, K. P.; Hand, R. J.; Stennett, M. C.; Gandy, A. S.; Brown, A. P.; Apperley, D. C. The effect of uranium oxide additions on the structure of alkali borosilicate glasses.
J. Non-Cryst. Solids2013,378(0), 282−289.
Ions and Hydrogen Peroxide. Environ. Sci. Technol. 2009, 43 (7), 2355−2361.
(55) Cantrell, K. J.; Um, W.; Williams, B. D.; Bowden, M. E.; Gartman, B.; Lukens, W. W.; Buck, E. C.; Mausolf, E. J. Chemical stabilization of Hanford tank residual waste.J. Nucl. Mater.2014,446 (1-3), 246−256.
(56) Navrotsky, A. Energetic clues to pathways to biomineralization: Precursors, clusters, and nanoparticles.Proc. Natl. Acad. Sci. U. S. A. 2004,101(33), 12096−12101.
(57) Giammar, D. E.; Hering, J. G. Influence of Dissolved Sodium and Cesium on Uranyl Oxide Hydrate Solubility.Environ. Sci. Technol. 2004,38(1), 171−179.
(58) Lifshitz, I. M.; Slyozov, V. V. The kinetics of precipitation from supersaturated solid solutions.J. Phys. Chem. Solids 1961, 19(1-2), 35−50.
(59) Wagner, C. Theorie der Alterung von Niederschlägen durch Umlösen (Ostwald-Reifung). Z. Elektrochem.1961,65(7−8), 581− 591.
(60) De Yoreo, J. J.; Vekilov, P. G. Principles of crystal nucleation and growth.Rev. Mineral. Geochem.2003,54(1), 57−93.