Article
The Interplay between Cell Wall Mechanical Properties and the Cell Cycle in
Staphylococcus aureus
Richard G. Bailey,1,2,3Robert D. Turner,2,3Nic Mullin,1,3Nigel Clarke,1Simon J. Foster,2,3and Jamie K. Hobbs1,3,*
1
Department of Physics & Astronomy,2Department of Molecular Biology and Biotechnology, and3Krebs Institute, University of Sheffield, Sheffield, UK
ABSTRACT The nanoscale mechanical properties of liveStaphylococcus aureuscells during different phases of growth were studied by atomic force microscopy. Indentation to different depths provided access to both local cell wall mechanical properties and whole-cell properties, including a component related to cell turgor pressure. Local cell wall properties were found to change in a characteristic manner throughout the division cycle. Splitting of the cell into two daughter cells followed a local softening of the cell wall along the division circumference, with the cell wall on either side of the division circumference becoming stiffer. Once exposed, the newly formed septum was found to be stiffer than the surrounding, older cell wall. Deeper indentations, which were affected by cell turgor pressure, did not show a change in stiffness throughout the division cycle, implying that enzymatic cell wall remodeling and local variations in wall properties are responsible for the evolution of cell shape through division.
INTRODUCTION
Staphylococcus aureusis a roughly spherical Gram-positive bacterium. positive bacteria, as opposed to
Gram-negative bacteria such asEscherichia coli, have a relatively
thick peptidoglycan layer surrounding a single membrane that encapsulates the cytoplasm (where the internal pro-cesses of the cell, such as protein synthesis and DNA repli-cation, take place). A key role of the cell wall is to provide a strong outer layer for the cell, preventing rupture by sup-porting the cell membrane against the large osmotic turgor pressure caused by the high internal concentration of osmo-lytes. Peptidoglycan has been biochemically analyzed and consists of a network of glycan chains of alternating
N-acetylglucosamine (GLcNAc) andN-acetylmuramic acid
(MurNAc) residues interconnected by peptide cross-links
(1). InS. aureus, the glycan polymers are on average 6–12
disaccharides long (2) and the peptide cross-links contain
an extra pentaglycine bridge that is not commonly present in other bacteria.
The molecular organization of peptidoglycan has yet to
be comprehensively resolved in any species (3), but several
architectural features have been identified inS. aureus(4).
These include ring or spiral surface features associated with new growth, knobby surfaces associated with older material, and rib and pie-crust features associated with
division planes. In S. aureus, the peptidoglycan layer is
20–35 nm thick (5). Methicillin-resistant and
vancomycin-tolerant strains of S. aureus are threats to human health.
Peptidoglycan and its synthesis are the targets for antibi-otics, so understanding its architecture and remodeling
dur-ing cell growth would lay a foundation for elucidatdur-ing the action of these drugs and defining the processes that might be disrupted with new therapies in the future.
During the division process,S. aureuscreates a septum of
new wall material that grows inward toward the center of the
cell, splitting the cell into two (4). The two hemispherical
daughter cells then separate, and the initially flat septal wall expands to complete the sphere required for the fully formed cells, without any apparent synthesis of new cell
wall material (2,6). We suggest that there is an interplay
among cell wall mechanical properties, stresses caused by turgor pressure, and active processes such as wall synthesis and enzymatic degradation, but how these factors control cell shape through the division cycle is currently unknown. Some information that can be used to define the dynamics of cell morphology and connect it with enzyme activity is
available. Studies in S. aureus (4,5) have followed the
gradual rupture of the cell wall during division in situ, showing the formation of holes followed by widening to leave fibrils connecting the daughter cells, which break apart in sudden jumps and thus expose the newly formed septal cell wall. It is currently unclear whether the daughter cells are actively forced apart from each other or whether the pro-cess is dominated by the activity of enzymes digesting the old material. It has been shown that the region in which these ruptures form is the location of potent cell wall hydrolases
(7,8) and perhaps murosomes (9). If the cells are forced
apart, changes in turgor pressure through the division cycle would provide a potential source for that force. Any changes in the measured stiffness of the cell wall could also provide clues about the processes involved and how the cell manages to expand from a hemisphere to a full sphere without the manufacture of any new cell wall material.
Submitted April 28, 2014, and accepted for publication October 8, 2014.
*Correspondence:[email protected]
Editor: Jochen Guck.
Atomic force microscopy (AFM) can be used for imaging as well as to measure forces acting on the probe, which allows one to map mechanical properties over a surface with nanoscale spatial accuracy. AFM force measurements have been used to study several species of bacteria,
includingS. aureus(4,10),E. coli(11),Streptococcus
sali-varius(12),Bacillus subtilis,Micrococcus luteus, Magneto-spirillum gryphiswaldense, and Pseudomonas putida(13).
Information about cell growth (10,14), surface properties
(15), extracted cell wall morphology and mechanical
prop-erties (12), morphological changes accompanying cell wall
degradation (16), and cell attack by antimicrobials (16) can
be gathered. These measurements of cell mechanics by AFM can be combined with imaging to record mechanical
properties over time (17) or during the relevant stage of
the division cycle, allowing comparison of different stages of the cell life cycle. However, when a force is exerted on the cell surface by an AFM probe, the reaction force acting against it is some combination of local indentation, wider-reaching deformation of the cell wall, and overall compres-sion of the cell. Therefore, it is challenging to separate the
contributions of each component (18,19).
In this study, we obtained data on live cells trapped in etched silicon wafers, measured by AFM in growth medium. We introduce a simple model to discriminate between forces resulting from local indentation and those resulting from global deformation and compression of the cell. With this believed-new analysis technique, we show that mechanical properties change with aging of the cell wall, and relate these measurements to cell wall architectural features. Based on our findings, we are able to suggest how
S. aureusmay have evolved to modulate cell wall mechan-ical properties to enable growth.
MATERIALS AND METHODS
Cell culture
S. aureus(SH1000) cells were grown overnight from a single colony in brain-heart infusion broth (BHI; Sigma-Aldrich, Dorset, UK) at 37!C on
a shaker at 250 rpm, resulting in a stationary phase culture. Subcultures were then inoculated to an optical density at 600 nm (OD600) of 0.05 and
grown in the same conditions until they reached an OD600z0.8 (late
expo-nential phase). The cells were harvested by centrifugation at 13,200 rpm for 3 min and then washed three times in PBS before they were attached to sub-strates for AFM.
Substrate preparation
Cells were immobilized on etched silicon wafer substrates for AFM under liquid, according to the method developed by Kailas et al. (10). Here, the substrates were formed as follows: clean silicon wafers were spin coated with MaN 1410 positive photoresist and then exposed to UV light with a Suss MJB mask aligner through a striped mask. The sample was then rotated through 90! and exposed again, creating a grid of micron-sized
squares in the photoresist. MF26A was used to develop the photoresist before etching in an OPT 100 ICP etcher with a plasma of SF6, O2, and
Ar. The substrates created by this process consisted of a grid of holes
measuring 1–1.2mm inxandywith a depth of ~750 nm. Finally, the surface was coated with a thin layer of polystyrene by dropping 10ml of a 1 mg/ml concentration solution in toluene of 35,000 MW atactic polystyrene (Sigma) and allowing the toluene to evaporate in a fume hood to obtain coverage of a few nanometers thickness (depending on the location in the highly topographic substrate). This left the surface of the grids relatively inert but hydrophobic, aiding cell attachment under liquid.
A 20ml drop of the washed bacterial suspension was deposited on the surface and allowed to settle for 20–30 min, which gave the cells time to drop out of suspension and fill the holes on the substrate surface. This sub-strate was then placed in a liquid cell and flooded with BHI for AFM studies.
AFM
Cells were studied with a JPK NanoWizard 3 atomic force microscope in growth medium (BHI). The surface was imaged in contact mode, with an imaging force of ~120 pN, to allow for location of a suitable area containing well-adhering cells of the expected near-spherical shape before force mea-surements were taken using either the force spectroscopy or force-mapping modes of the atomic force microscope. Four different triangular cantilevers from the Bruker MLCT chip were used, with nominal stiffness ranging from 0.01 to 0.1 Nm"1. Actual cantilever spring constants were calibrated
according to the thermal method (20), using the calibration routine in the JPK software, with corrections applied for the 10! cantilever tilt only
(21). The inverse optical lever sensitivity was obtained by performing force curves on a bare mica substrate placed next to the substrate used for bacte-rial trapping, to avoid issues with deposited matebacte-rial interfering with the measurement. During force measurements, the tip velocity in z was 1.0mm s"1
for both individual force-curve measurements and whole-force maps, with an indentation between 10 and 50 nm (130 pN and 1.3 nN, respectively) depending on the depth required for a particular data set. All force maps were carried out using the standard JPK force-map software with zero dwell times. This allowed us to complete a 32#32 force map in ~15 min, and we found that moving any faster created a large hydrodynamic drag on the cantilever, compromising the quality of the data. The total time between harvesting of cells and the start of AFM measurements was in the range of 30–45 min. The MLCT tips used had a nominal radius of 20 nm. When larger-radius tips were required, the tip was first scanned at high force over the bare silicon grid, blunting the tip end. The tip radius was esti-mated according to the blind reconstruction method, using TNT-1 calibra-tion grids from NTMDT. This approach gave a tip radius of (2553) nm for the standard tips used, and values in the range of 30–53 nm were obtained for the blunted tips.
Detergent treatment
Cells were treated with SDS while being examined by AFM. This involved the addition of SDS to the PBS buffer in which the cells were being exam-ined, to a final concentration of 1% by mass. The cells could then immedi-ately be force probed to track changes in the mechanical properties brought about by this addition.
Cell wall extraction
RESULTS AND DISCUSSION
Determination of the appropriate force-curve model
As described by Kailas et al. (10), the use of holes etched
in silicon wafers was found to provide a robust method for
trappingS. aureusfor both imaging and force measurement
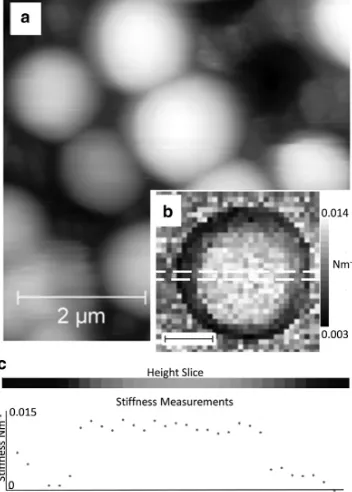
(Fig. 1a).
To determine the average mechanical properties of the
cell walls, we obtained force curves in a 32 # 32 grid
over a single bacterium (Fig. 1b).S. aureushas a curved
surface and the angle of the surface will affect the measured
properties when the cantilever is moved vertically.Fig. 1c
shows the measured sample stiffness (i.e., tangent to the curve at the point of maximum indentation) in a line of force data taken across the cell. It is clear that over the central re-gion there is a high degree of repeatability between mea-surements, with lower values obtained at the periphery of the cell where the surface is more highly sloped. To avoid
this slope-induced artifact, we selected curves in a 5#5
or 6#6 grid from the central region of the bacterium for
analysis, using the approach part of the force curves. Measurements were performed on live cells with four different cantilever types, with spring constants in the range
of 0.009–0.112 Nm"1.Fig. 2ashows an example
force-sep-aration curve (z-position corrected for cantilever deflection)
with one of the stiffest cantilevers. The stiffer cantilevers allowed deeper indentation at the expense of sensitivity to low forces, but all of the curves reproduced the same general behavior. A number of example indentation and retract
curves are given inFig. S1in theSupporting Material.
Models of contact mechanics can be used to extract mechanical-property information from data such as these by fitting a model curve to a measured one. Several such models have been applied to AFM data, but each involves assumptions that may not be valid in our particular case. With increasing indentation depth, the contact area between the approximately spherically ended pyramidal tip will in-crease continuously, giving a nonlinear force curve, with the form of the curve depending on the exact nature of the contact mechanics. Typically, the contact models that describe different physical situations (e.g., Hertz, Sneddon, Derjaguin-Muller-Toporov, and Johnson-Kendall-Roberts
(22)) have a different power law dependence of force on
[image:3.595.328.510.86.423.2]indentation depth. For a homogeneous sample, one would
FIGURE 1 (a) Contact-mode AFM height image of S. aureus cells immobilized in liquid in holes etched into a silicon wafer. Z scale is 1.5mm. (b) Force map (32#32) on an individual cell; grayscale range: 0.003–0.014 Nm"1; black inset scale bar represents 500 nm. The white
[image:3.595.88.264.404.650.2]box represents the slice taken out for panelc. (c) The measured sample stiff-ness in a 1.5mm line of force data taken across the cell force map, showing little variation across the top surface in the central part.
FIGURE 2 (a) Force curve on a liveS. aureuscell, showing the shape of the curve at high indentation. (b) Log-log plot of 0.074 Nm"1measured
expect a particular model to apply, giving a single straight line of nonzero gradient if the force curve were presented on a log-log plot, i.e., the gradient of the log(force) versus log(indentation) plot would be a constant that depends on the tip-sample contact mechanics. We used this to test whether a single model could be applied to our data. We
found that log-log plots of curves obtained on S. aureus
gave not one but two straight lines of nonzero gradient (Fig. 2 b), implying a change of behavior between low indentation and high indentation. The intercept between these two lines, which have slopes of ~2 at low indentation and ~4 at high indentation, occurs at an ~25 nm indentation depth. This shows that there are two deformation regimes present in our data, depending on the indentation depth: an initial slowly changing stiffness at low indentation depths and then a more rapidly increasing stiffness at high depth. This information can be extracted independently of the fact that force is inevitably higher at higher indentations and is expected to increase more rapidly with increasing depth because of the constantly increasing contact area be-tween the tip and the sample.
From this analysis, it is clear that we cannot apply existing contact-mechanics models (such as the commonly used Hertz model) to the whole of any one force-indentation curve. Furthermore, the commonly applied models are only strictly valid for an infinite elastic half space, and considering that the known thickness of the bacterial cell wall is in the range of 20–35 nm and the cell as a whole is deformable, we do not expect such a model to be valid for this system when indenting to depths of more than a few nanometers. Having determined that no applicable contact-mechanics model was available, to further analyze the data, we obtained
simple linear stiffness values (k, Nm"1) from tangents to the
curves at the required indentation depth (~10 nm and 50 nm for the low- and high-stiffness regions, respectively).
The range of stiffness seen here between the two indenta-tion depth regimes is too large to be measured with a single cantilever with high accuracy (a cantilever is best suited to measure stiffnesses approximately equal to the cantilever stiffness). Therefore, to simplify the analysis, we obtained
measurements with either ~0.01 or ~0.07 Nm"1cantilevers,
with the trigger point chosen to be in either the softer or
stiffer region, respectively. A ~0.07 Nm"1 cantilever was
chosen for the higher-stiffness measurements because this cantilever is still sufficiently soft to accurately determine the contact point, considering the initially low stiffness of the indentation. Stiffness values were obtained for a total
sample of 100 differentS. aureuscells, with 25–36
indepen-dent measurements per cell and 50 cells being measured
with each of the two cantilever stiffnesses.Fig. 2cshows
the resulting stiffness data, which yield results of
(0.013450.0068) Nm"1
for the low-stiffness measurement
and (0.20625 0.0039) Nm"1
for the high-stiffness mea-surement, with the pyramidal silicon nitride tips used here. All errors are 1 standard deviation.
Cell wall and whole-cell mechanical properties are separable
Since the force-curve gradient (Fig. 2b) changes at 25 nm,
which is approximately the thickness of theS. aureuscell
wall (5), it is possible that the first part of the indentation
force curves measures primarily the stiffness of the cell wall, and the second part is indenting and deforming the whole cell, receiving a higher force due to either the turgor pressure within the cell or larger-scale deformation of the spherical cell wall, or a combination of both. We tested this in three ways: 1), by studying cell walls that had been extracted from live cells and hence had no turgor pressure, allowing measurements of the cell wall alone; 2), by moni-toring cells in the presence of SDS, a detergent that irrevers-ibly damages the cell membrane, eliminating the turgor pressure; and 3), by repeating the experiment with AFM tips that had been blunted so as to increase their radius of curvature.
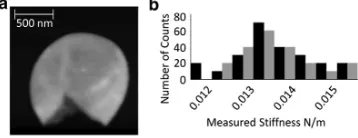
Due to issues involving sample movement in liquid, we carried out measurements on the extracted cell walls in air. These measurements revealed a stiffness value of
(0.01375 0.0010) Nm"1, from 20 individual sacculi, in
agreement with the low stiffness values measured on the
whole cells (seeFig. 3). The significance of this agreement
is unclear, as the cell wall most likely was not as fully hy-drated as it was when measured under medium in live bac-teria, so it might be expected to be stiffer, and the thin cell wall was lying on top of a very stiff substrate, which would influence (increase) the measured stiffness. However, the data do show good agreement with the low stiffness (i.e., initial indentation) value obtained in live cells. Measure-ments of the cell wall thickness taken from topographic
images of these sacculi gave a thickness of (2753) nm,
in good agreement with literature values for cell wall thickness.
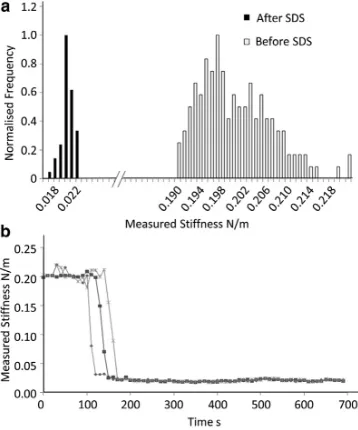
[image:4.595.330.509.611.680.2]When SDS was added to live cells, force curves were taken at 10 s intervals on three different cells close to each other on the silicon grid. Individual force curves were obtained consecutively in the approximate center of each cell repeatedly throughout the experiment. The value of the high-indentation part of the force curve was moni-tored and plotted over time. After a short time, this measure-ment rapidly decreased for all three cells to a value only
slightly higher than the measured stiffness of the cell walls
and the stiffness measured on initial indentation (Fig. 4).
This drop corresponds to the expected loss in pressure of live cells during this treatment as the membrane was degraded by the SDS. This experiment was repeated on five separate occasions, with similar results. During these experiments, the cell wall appeared to stiffen slightly, possibly due to the agglomeration of proteins on the inside
of the cell wall, similar to a previously observed effect (17).
Finally, cells were indented in both low- and high-force regimes with tips of varying bluntness. A blunter tip should lead to a higher stiffness upon indentation due to the increased contact area, but should make little difference when the resistance is due primarily to deformation of the whole cell or to turgor pressure. These experiments revealed that at low forces a reduction in tip sharpness caused an in-crease in the measured stiffness, but for the high-force
regime there was no measurable increase (Fig. S2 and S3).
We also found that the distance between the contact point and the regime change, as measured on log-log curves, was reduced with increasing tip size. Again, this is in line with the suggested assignment of the different regimes, as a threshold force for deforming the entire cell will be reached at a smaller indentation depth for a blunter tip that hence feels a higher wall stiffness.
Based on these considerations, we propose that the first 25 nm of these force curves is primarily dependent on the local cell wall stiffness, and the part after that depth indents and deforms the whole cell, giving a measurement with a contribution from the cellular turgor pressure. In this
mea-surement, with the particular AFM tips used, the stiffness measured at low indentation is more than an order of magni-tude lower than the stiffness at high indentation; therefore, there is minimal cross-talk between the two measurements. Hereafter, we refer to the low- and high-stiffness regimes as the cell wall stiffness and whole-cell stiffness, respectively, for the sake of clarity. In subsequent experiments, we were able to select cantilevers and indentation forces such that we could selectively measure either the cell wall or the whole-cell compression with turgor pressure component during an experiment.
Previous studies on Gram-negative bacteria found either
two force regimes (23,24) or a single linear regime at high
indentation (25). Gaboriaud et al. (23) showed that the
low-indentation regime is due to a diffuse gel-like outer layer, consistent with the known structure of the Gram-nega-tive cell envelope, and in contrast to the more abrupt
inter-face found in some Gram-positive bacteria such asS. aureus
(26). The linear regime occurs at very high indentation
(100s nm), and it was thought that going to this level of deformation would potentially compromise cell viability as well as degrade the ability to obtain subcellular spatial resolution. We suggest that the approach used here is likely to be applicable to other Gram-positive bacteria that lack an extensive envelope beyond the peptidoglycan cell wall, such asB. subtilis, and potentially for other cell types with an outer wall but no diffuse extracellular envelope, including certain yeast and plant cells.
Live cells were force mapped for the cell wall and whole-cell indentation properties during both stationary and expo-nential growth phases. Examples of the stationary growth
phase stiffness maps are shown in Fig. 5, with the wall
maps (a–c) and the whole-cell indentation maps (d–f) all
showing little variation across each cell and other similar maps on different cells. Quantitative data taken from these
force maps gave values of (0.0132 5 0.0021) Nm"1 for
the cell wall and (0.202 5 0.019) Nm"1 for the whole
[image:5.595.86.265.456.671.2]cell, in good agreement with data obtained using conven-tional force curves (i.e., not mapping). Similar values
FIGURE 4 (a) Histogram of whole-cell compression measurements taken on cells before and after exposure to SDS, showing a large decrease from the equivalent measurements on untreated cells (bin size¼0.001 Nm"1). (b) Time dependency of three example data sets when SDS was
[image:5.595.308.533.561.688.2]added to cells at time¼0 s.
were found for stationary (Student’st-test,p¼0.63 for cell
wall and 0.42 for whole cell) and exponential (p¼0.76 for
cell wall and 0.49 for whole cell) phase cells.
Cell wall mechanical properties vary spatially with the cell cycle
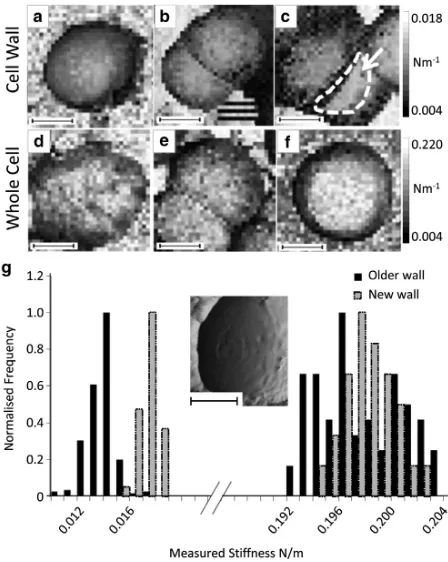
Examples of force maps taken on live cells in exponential
phase are shown in Fig. 6. From these maps, we found
that there was no measurable change in the whole-cell indentation stiffness at different growth stages. The existing cell walls around the outside of the dividing cells also showed no change from the values taken at stationary phase. However, we found that the newly exposed, less curved,
septal cell wall (such as that indicated by thewhite arrow
and dotted line in Fig. 6 c) was slightly stiffer than the rest of the cell wall before the cell completely expanded into a hemisphere. The dark stripe to the left on this region
(under thedotted line) reflects a steep edge at this point, as a
result of which the tip slipped and twisted on the surface and did not indent the sample in the required manner. Due to fea-tures such as this appearing on cells that were not fully
sepa-rated, data were taken from 10 separated cells that showed new cell wall on their top surface, as identified by the char-acteristic concentric ring pattern visible by AFM on the
sur-face of the septum resulting from its formation (4).Fig. 6g
shows an example image and the histogram of data obtained from the 10 cells, giving an average value of the stiffness of
this new cell wall of (0.01575 0.0012) Nm"1, which is
significantly higher than that for the rest of the cell wall.
Student’st-test on the two data sets givesp¼4.5#10"21.
Variations in cell surface properties are related to cell wall architecture
Local variations in cell wall stiffness within a single bacte-rial cell can give us new insights into the growth process.
S. aureus is known to grow in a unique manner, in that new cell wall is apparently only deposited in the growing septum, and the rest of the hemispherical cell wall of a sin-gle daughter cell is composed of components that grew dur-ing the previous division cycle and division cycles previous
to that (4). Here, we show that the newly deposited cell wall
that formed the septum in the most recent division cycle was stiffer than the rest of the cell wall until it fully expanded into its half-sphere shape. Expansion of the cell wall from a flat septum to a hemisphere cannot occur through simple stretching, as this would require the new planar septum to be softer (though thicker) during its initial formation than the rest of the cell wall. It is possible that the cell wall is highly viscoelastic, so that expansion could occur through viscoelastic creep of the material. Again, this would predict that the final measured stiffness would be higher than the initial stiffness before extensive creep occurs. Instead, our data suggest that the new septum is most likely denser and perhaps more cross-linked than the rest of the cell wall, and that the change in shape from a circle to a hemisphere involves a reorganization or remodeling of the cell wall that is probably accomplished by partial enzymatic degrada-tion of the peptidoglycan. Further evidence to support this view comes from the lack of variation in the whole-cell indentation data, which show no difference between different phases of growth, implying that the turgor pressure is approximately constant throughout the division cycle.
During the division process, the new cell wall must change shape from the initial planar disk to a hemispherical
shape. According to continuum plate theory (27), a flat cell
wall that is circular and homogeneous is subject to a maximum stress at the center of the circle due to the turgor
pressure,p, of orderp(R/t)2, whereRandtare the radius and
thickness of the cell and cell wall, respectively. This flat cell wall is subject to a compressive stress on its inner surface and tensile stress of equal magnitude on its outer surface. In contrast, a spherical cell (and the curved part of a hemi-spherical cell) is subject to a uniform tensile stress of the
order ofp(R/t), so that the ratio of the maximum stress in
[image:6.595.63.287.361.642.2]a flat cell wall to that in a curved cell wall is of the order
ofR/t. This simple analysis of the peak stress in a cell that is strictly hemispherical compared with a cell that is spherical
shows a>10-fold reduction in stress for the spherical cell.
We suggest that the very high stress in the flat cell wall causes some deformation toward the spherical shape. As the originally flat cell wall deforms, the stress reduces grad-ually toward the value for a perfect sphere. Hence, the cell will stop deforming once a shape that can be maintained by the higher wall stiffness in these areas is reached.
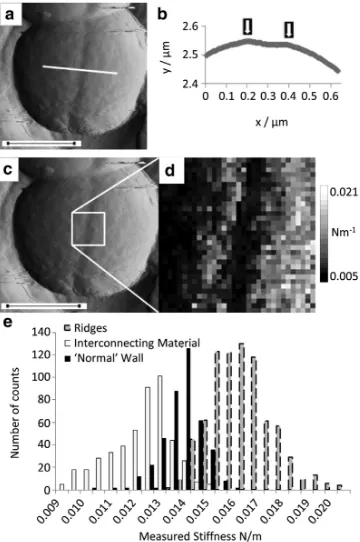
Previous morphological studies of S. aureus cell walls
have shown structures associated with the division process, and in particular the existence of a pie crust of thick cell wall
around the circumference that is about to divide (4).
Small-scale force maps (300 nm2) were taken over regions
encom-passing the line of incipient division in exponential phase cells. At this stage in the cell cycle, a depressed ring encir-cles the cell. This is caused by either a combination of stretching and expansion of the old cell wall or the commencement of separation of daughter cells. In this situ-ation, the pie crust is either split and its remnants remain beneath the ridges on either side of the depression or it is
intact at the base of the depression (Fig. 7). Force maps
were taken on 10 cells at this growth stage, where the
depression was easily visible on the outside of the cell. These maps showed that the ridges on either side of the depression were slightly stiffer than the rest of the cell wall, with the interconnecting material in the depression it-self, between the two ridges, appearing softer than the older
material.Fig. 7eshows a histogram of the data obtained,
giving average values of (0.016250.0020) Nm"1for the
ridge stiffness and (0.011850.0023) Nm"1for the
inter-connecting material in the depression. This could be due to the interconnecting material being patchy and fibrillar, and may be conflated with the potential for tip artifacts due to the angle of indentation (although we note from the
profile inFig. 7bthat the topographic variation is minimal).
Comparing both of these data sets with the regular cell wall
measurements gives p-values of 3.0 # 10"12 and 1.3 #
10"5, respectively, showing that they are significantly different. We propose that the higher stiffness at the ridges could be due to either the buildup of proteins on the inside of the wall where the septum starts to grow or, more likely, to the septal material itself, since the stiffness of the crust and that of the septal material are very similar. Such a stiff zone of material is required to support the increased stress caused by the high curvature in this region. The drop in stiff-ness of the interconnecting material is likely to be due to the activity of enzymes degrading this part of the cell wall to allow the separation of the two daughter cells.
These data support a model of cell wall architecture in which the two septal plates of the two daughter cells are bridged by a ring of material that is degraded as the final process in splitting the two cells apart. We propose it is this degraded material that is seen to be deformed and crazed in
the AFM images of dividingS. aureuscells (10). Electron
microscopy data obtained from sections through dividing
S. aureuscells support a similar picture (28).
CONCLUSIONS
In this work, we studiedS. aureuscells by AFM and
ob-tained highly repeatable mechanical measurements. The use of custom silicon supports enabled routine measure-ments on large numbers of cells, providing a route to
mechanical assays of cellular processes in S. aureus. We
studied cells at different growth phases to quantify any changes in these properties as the cells grew and divided.
Upon indentation ofS. aureus, we identified two regions
[image:7.595.87.267.379.650.2]with different deformation behaviors, one occurring at indentation depths up to 20–30 nm and one occurring at indentation depths of 40–60 nm, which we identify with deformation primarily of the cell wall and the whole cell, respectively. The latter measurement was found to be strongly influenced by the turgor pressure of the cell. From our measurements, the whole-cell compression gave stiffness values that showed no measurable change throughout the division cycle, implying a minimal change in the cells’ turgor pressure. Measurements of cell wall
FIGURE 7 (a) Vertical deflection image of a live cell in exponential phase showing early signs of septal cleavage. (b) Height profile of the line shown ina; arrows indicate ridges. (c) Image from panela, showing the area selected for force mapping. (d) Force map (300 nm2). (e)
Histo-gram of stiffness measured on the ridges, the interconnecting material, and the older cell wall (bin size¼0.0005 Nm"1). Black inset scale bars
stiffness showed that the outer, older cell wall also did not measurably change during the growth cycle. However, the newly exposed material of the septum was found to be stiffer than the older cell wall, implying that the change in shape from hemisphere to sphere is accompanied by enzymatic degradation or other remodeling of the new cell wall.
Measurements on the ring of material adjoining the septum (the pie crust) revealed a higher stiffness. The mate-rial between the two ridges appeared softer than the rest of the cell wall, most likely due to enzymatic activity breaking down the wall to facilitate the separation of the two daughter cells.
These observations support a mechanical model of
S. aureusdivision in which it is primarily the wall proper-ties, rather than expansive forces, that vary throughout the cell cycle.
SUPPORTING MATERIAL
Three figures are available at http://www.biophysj.org/biophysj/ supplemental/S0006-3495(14)01119-9.
We thank Ken Kennedy at the Kroto Research Institute, University of Shef-field, for his help in creating the etched silicon wafers, and Andrew Narra-cott for useful discussions.
This work was supported by the Biotechnology and Biological Sciences Research Council, and the Engineering and Physical Sciences Research Council.
REFERENCES
1. Vollmer, W., D. Blanot, and M. A. de Pedro. 2008. Peptidoglycan struc-ture and architecstruc-ture.FEMS Microbiol. Rev.32:149–167.
2. Boneca, I. G., Z. H. Huang,., A. Tomasz. 2000. Characterization of
Staphylococcus aureuscell wall glycan strands, evidence for a new beta-N-acetylglucosaminidase activity.J. Biol. Chem.275:9910–9918. 3. Turner, R. D., W. Vollmer, and S. J. Foster. 2014. Different walls for rods and balls: the diversity of peptidoglycan. Mol. Microbiol.
91:862–874.
4. Turner, R. D., E. C. Ratcliffe,., S. J. Foster. 2010. Peptidoglycan ar-chitecture can specify division planes inStaphylococcus aureus.Nat. Commun.1:26.
5. Matias, V. R. F., and T. J. Beveridge. 2006. Native cell wall organiza-tion shown by cryo-electron microscopy confirms the existence of a periplasmic space inStaphylococcus aureus.J. Bacteriol.188:1011– 1021.
6. Pinho, M. G., and J. Errington. 2003. Dispersed mode of Staphylo-coccus aureuscell wall synthesis in the absence of the division machin-ery.Mol. Microbiol.50:871–881.
7. Foster, S. J. 1995. Molecular characterization and functional analysis of the major autolysin ofStaphylococcus aureus8325/4. J. Bacteriol.
177:5723–5725.
8. Yamada, S., M. Sugai,., H. Suginaka. 1996. An autolysin ring asso-ciated with cell separation ofStaphylococcus aureus.J. Bacteriol.
178:1565–1571.
9. Giesbrecht, P., T. Kersten,., J. Wecke. 1998. Staphylococcal cell wall: morphogenesis and fatal variations in the presence of penicillin.
Microbiol. Mol. Biol. Rev.62:1371–1414.
10. Kailas, L., E. C. Ratcliffe,., J. K. Hobbs. 2009. Immobilizing live bacteria for AFM imaging of cellular processes.Ultramicroscopy.
109:775–780.
11. Beckmann, M. A., S. Venkataraman, ., D. P. Allison. 2006. Measuring cell surface elasticity on enteroaggregative Escherichia coli wild type and dispersin mutant by AFM. Ultramicroscopy.
106:695–702.
12. van Der Mei, H. C., H. J. Busscher,., Y. F. Dufreˆne. 2000. Direct probing by atomic force microscopy of the cell surface softness of a fibrillated and nonfibrillated oral streptococcal strain. Biophys. J.
78:2668–2674.
13. Volle, C. B., M. A. Ferguson,., M. E. Nu´n˜ez. 2008. Spring constants and adhesive properties of native bacterial biofilm cells measured by atomic force microscopy.Colloids Surf. B Biointerfaces.67:32–40. 14. Touhami, A., M. H. Jericho, and T. J. Beveridge. 2004. Atomic force
microscopy of cell growth and division inStaphylococcus aureus.
J. Bacteriol.186:3286–3295.
15. Dupres, V., D. Alsteens,., Y. F. Dufreˆne. 2010. Microbial nanoscopy: a closer look at microbial cell surfaces.Trends Microbiol.18:397–405. 16. Francius, G., O. Domenech,., Y. F. Dufreˆne. 2008. Direct observation of Staphylococcus aureus cell wall digestion by lysostaphin.
J. Bacteriol.190:7904–7909.
17. Longo, G., L. M. Rio,., S. Kasas. 2013. Antibiotic-induced modifi-cations of the stiffness of bacterial membranes.J. Microbiol. Methods.
93:80–84.
18. Arnoldi, M., M. Fritz,., A. Boulbitch. 2000. Bacterial turgor pressure can be measured by atomic force microscopy.Phys. Rev. E Stat. Phys. Plasmas Fluids Relat. Interdiscip. Topics.62 (1 Pt B):1034–1044. 19. Arnoldi, M., C. M. Kacher,., M. Fritz. 1998. Elastic properties of the
cell wall ofMagnetospirillum gryphiswaldenseinvestigated by atomic force microscopy.Appl. Phys. A.66:613–617.
20. Hutter, J. L., and J. Bechhoefer. 1993. Calibration of atomic-force mi-croscope tips.Rev. Sci. Instrum.64:1868.
21. Hutter, J. L. 2005. Comment on tilt of atomic force microscopy cantilevers: effect on spring constant and adhesion measurements.
Langmuir.21:2630–2632.
22. Butt, H.-J., B. Cappella, and M. Kappl. 2005. Force measurements with the atomic force microscope: technique, interpretation and applica-tions.Surf. Sci. Rep.59:1–152.
23. Gaboriaud, F., M. L. Gee,., J. F. Duval. 2008. Coupled electrostatic, hydrodynamic, and mechanical properties of bacterial interfaces in aqueous media.Langmuir.24:10988–10995.
24. Gaboriaud, F., B. S. Parcha, ., R. A. Strugnell. 2008. Spatially resolved force spectroscopy of bacterial surfaces using force-volume imaging.Colloids Surf. B Biointerfaces.62:206–213.
25. Gaboriaud, F., S. Bailet,., F. Jorand. 2005. Surface structure and nanomechanical properties of Shewanella putrefaciens bacteria at two pH values (4 and 10) determined by atomic force microscopy.
J. Bacteriol.187:3864–3868.
26. Cabeen, M. T., and C. Jacobs-Wagner. 2005. Bacterial cell shape.Nat. Rev. Microbiol.3:601–610.
27. Reddy, J. N. 1999. Theory and Analysis of Elastic Plates. Taylor and Francis, Philadelphia.