Ontogenic differences in sexual size dimorphism
across four plover populations
NATALIE DOS REMEDIOS,1,2* TAMAS SZ EKELY, 1CLEMENS KUPPER,€ 2PATRICIA L. M. LEE3,4& ANDRAS KOSZTOL ANYI 5
1
Department of Biology and Biochemistry, University of Bath, Claverton Down, Bath BA2 7AY, UK 2
NERC-Biomolecular Analysis Facility, Department of Animal and Plant Sciences, University of Sheffield, Western Bank, Sheffield, S10 2TN, UK
3
Centre for Integrative Ecology, School of Life and Environmental Sciences, Deakin University, Warrnambool, Victoria 3280, Australia
4Department of Biosciences, College of Science, Swansea University, Singleton Park, Swansea SA2 8PP, UK
5MTA-DE‘Lendulet€ ’Behavioural Ecology Research Group, Department of Evolutionary Zoology, University of
Debrecen, Egyetem ter 1., H-4032 Debrecen, Hungary
Sexual size dimorphism (SSD) among adults is commonly observed in animals and is considered to be adaptive. However, the ontogenic emergence of SSD, i.e. the timing of divergence in body size between males and females, has only recently received attention. It is widely acknowledged that the ontogeny of SSD may differ between species, but it remains unclear how variable the ontogeny of SSD is within species. Kentish Plovers Charadrius alexandrinus and Snowy Plovers C. nivosus are closely related wader species that exhibit similar, moderate (c. 4%), male-biased adult SSD. To assess when SSD emerges we recorded tarsus length variation among 759 offspring in four populations of these species. Tarsus length of chicks was measured on the day of hatching and up to three times on recapture before fledging. In one population (Mexico, Snowy Plovers), males and females differed in size from the day of hatching, whereas growth rates dif-fered between the sexes in two populations (Turkey and United Arab Emirates, both Kentish Plovers). In contrast, a fourth population (Cape Verde, Kentish Plovers) showed no significant SSD in juveniles. Our results suggest that adult SSD can emerge at differ-ent stages of developmdiffer-ent (prenatal, postnatal and post-juvenile) in differdiffer-ent populations of the same species. We discuss the proximate mechanisms that may underlie these developmental differences.
Keywords: Charadriiformes, development, growth, ontogeny, sexual size dimorphism, tarsus, waders.
Sex differences in the body size of males and females are prevalent across the animal kingdom and their adaptive significance has been under investigation for over a century (Darwin 1871). Across taxa, the evolution of sexual size dimor-phism (SSD) has been associated both with sexual selection for larger male body size (Szekely et al. 2000, Bertin & Cezilly 2003, Lislevandet al.2009) and with natural selection for larger female body size linked to increased fecundity (Blanckenhorn
2000, Blondel et al. 2002, Fairbairn 2007). How-ever, among birds, body size is not always strongly related to fecundity (Serrano-Meneses & Szekely 2006, Lislevand et al.2009) and the magnitude of SSD varies across bird species. To fully understand the evolution of SSD in birds, it is necessary to determine both how and when SSD develops among individuals at the proximate level (Price 1984).
Despite numerous studies focusing on patterns of adult SSD, research has only recently focused on the ontogenic development of SSD (Badyaev et al. 2001a, Blanckenhorn et al.2007, Dietrich-Bischoff *Corresponding author.
et al.2008, Hegyiet al.2011, Klenovsek & Kry stu-fek 2013). Identifying exactly when morphological divergence between males and females starts to develop is of central importance in determining the underlying mechanisms (Cox & John-Alder 2007, Stillwellet al.2014). SSD may emerge during three main stages: (i) prenatally, due to sex differences in embryonic growth rates resulting either from intrin-sic genetic differences (Godfrey & Farnsworth 1952, Sellier 2000) or from differences in maternal investment in male and female embryos (Muller€
et al.2012, Helle et al.2013); (ii) postnatally, due to sex differences in the rate or duration of growth of offspring (Leigh & Shea 1995, Blanckenhorn 2005, Hasumi 2010, Zhang & Liu 2013), which may be hormone-mediated (e.g. linked to differen-tial testosterone and activity levels; Klukowskiet al. 2004, Cox et al. 2009); or (iii) post fledging, due either to sex differences in continued growth, or to mortality differences between juvenile or adult males and females in relation to body size (Badyaev et al.2001a, Kersten & Brenninkmeijer 2008).
Comparative studies have revealed that variation in SSD often appears between closely related spe-cies. Even within a single species, variation in the extent of SSD can occur between different eco-morphs (Blanckenhorn et al. 2006, Dunham et al. 2013, Laiolo et al. 2013). For example, Blondel et al.(2002) found greater SSD in a mainland pop-ulation of Blue Tits Cyanistes caeruleus than in an island population, where environmental stress was suggested to limit the size of the larger sex (males). Ontogenic factors are important in generating such population differences (Badyaev et al. 2001b). However, it remains unclear whether population differences in the ontogenic growth patterns of males and females might occur in species where adult SSD is consistent across populations.
Here, we investigate sex differences in body size during development in four plover populations: three populations of Kentish Plover Charadrius alexandrinus(Fig. 1) and one population of Snowy Plover Charadrius nivosus. The Snowy Plover and Kentish Plover are phenotypically similar and were long considered to be the same species (Hayman et al.1988). Snowy Plovers are on average smaller than Kentish Plovers (tarsus length c. 25 and 29 mm, respectively; K€upper et al. 2009) but adults in these four populations exhibit very simi-lar, moderate, male-biased SSD (c. 1 mm, or 4%, difference in tarsus length, Kupper€ et al. 2009, T. Szekely unpubl. data). Plover chicks are
preco-cial, leaving the nest scrape a few hours after hatching, and feed for themselves throughout the postnatal growth period (Warriner et al. 1986, Szekely & Williams 1994). In waders (notably plo-vers and sandpipers), sexual selection appears to play a major role in the evolution of sexual size dimorphism and is associated with male display behaviour during courtship (Szekely et al. 2000,
2004). However, the proximate mechanisms
responsible for the emergence of SSD in this group are still unclear.
We aim to assess when SSD develops ontogen-tically among plovers (prenatally, postnatally or post-fledging), and whether SSD emerges during the same ontogenic period in different populations. We use tarsus length as a proxy for structural body size (Rising & Somers 1989, Senar & Pascual 1997), and compare hatchling size and growth up to fledging age (25 days) for males and females in each population.
METHOD S
Data collection
[image:2.595.310.531.82.260.2]We collected hatchling size and growth data from four plover populations (Table 1). At Bahıa de Ceuta, Mexico, we measured juvenile Snowy Plo-vers from May to July 2006–2009. Kentish Plover populations were investigated at Tuzla Lake, south-ern Turkey, from April to July 1996–1999 and in 2004; at Al Wathba Wetland Reserve, United Arab Emirates, between March and July 2005–2006;
and on Maio Island, Cape Verde, from September to November 2008–2010.
We followed standard protocols (Szekely et al. 2008) to search for nests by observation from a mobile hide, from a car or on foot. We predicted hatch dates based on the floating stage of eggs in lukewarm water, and visited nests daily as the expected hatch dates approached. On the day of hatching, chicks were captured and marked with a single metal ring, and in most cases (70%) with an additional colour ring. The length of the right tarsus (tarsometatarsal bone) was measured to the nearest 0.1 mm. Structural measurements such as bill or wing length were not available for all popu-lations as field workers aimed to minimize han-dling time for each chick and keep the stress for families at a minimum.
Measurement errors (% ME) were estimated for three of the four populations by comparison of variation within and between individuals. Within-individual differences were based on comparison of right tarsus with left tarsus measurements using the formula (Bailey & Byrnes 1990):
% ME¼ ½s2
within=ðs2amongþs2withinÞ 100
where s2within = MSwithin, and s2among =(MSamong –
MSwithin)/2. MSwithin and MSamong are the
within-individual and between-within-individual mean sum of squares of a Model II ANOVA. Measurement errors were estimated at 0.83% in Ceuta, 1.49% in Tuzla and 0.38% in Al Wathba, indicating that approximately 99% of the total variation was due
to differences in tarsus length between birds rather than measurement error.
A droplet of blood (25lL) was taken for molecular sex-typing, by puncturing the leg vein using a hypodermic needle (Oring et al. 1988). Blood was stored in Eppendorf tubes containing 1 mL of Queen’s lysis buffer (Seutin et al. 1991). In total, 103 chicks (29 Ceuta, 33 Tuzla, 18 Al Wathba, 23 Maio) with known hatch date and age were not captured on the day of hatching, but were captured, measured and blood sampled sub-sequently. These chicks were not included in the hatchling size dataset but were included in growth calculations. We monitored broods up to the age of 25 days, as most chicks fledge at (or shortly after) this point (Szekely & Cuthill 1999). We attempted to measure the tarsus length of chicks multiple times prior tofledging; chicks were recap-tured during opportunistic encounters in the field and their tarsus length was recorded (Table 1). Where any pair of parents produced multiple broods within or between breeding seasons, we included chicks from only one brood to avoid pseudoreplication. The included brood was chosen to be the one with most chicks at hatching, or the
first brood for which data were collected.
Molecular sex-typing
[image:3.595.64.536.108.288.2]DNA was extracted from blood samples using an ammonium acetate extraction method (Nicholls et al. 2000, Richardson et al. 2001). For molecu-lar sex-typing, two markers were amplified via
Table 1. Summary data and growth parameters for chicks sampled across four plover populations. Parameters of the linear tarsus growth model (see text for details) are: (a) size at hatching (mm) and (b) growth rate (mm/day).
Species
Ceuta, Mexico Tuzla, Turkey Al Wathba, UAE Maio, Cape Verde
Snowy Plover Kentish Plover Kentish Plover Kentish Plover
Location 23°540N, 106°570W 36°420N, 35°030E 24°15.50N, 54°36.20E 15°0.90N, 23°120W
No. of chicks measured on day of hatching, broods
262, 122 347, 144 70, 39 80, 51
Years of study 2006–2009 1996–1999, 2004 2005, 2006 2008–2010
No. of chicks measured between 1 and 25 days of age
126 115 33 41
Mean no. of captures per chick 2.2 2.3 2.0 1.6
Tarsus length (mm) at hatching*
Males 17.600.05 19.050.06 18.520.16 19.610.18
Females 17.350.05 18.920.05 18.090.17 19.470.14
Tarsus growth parameters
a 17.607 19.058 17.844 19.160
b 0.309 0.411 0.522 0.450
Fit of linear growth model:r2 0.830 0.870 0.873 0.812
polymerase chain reaction (PCR): thefirst marker Z-002B amplified homologous regions on the Z and W chromosome that differed in size (Z-002B; Dawson 2007) and the second marker was W-spe-cific and hence amplified only in females ( Calex-31; Kupper€ et al. 2007). PCR-amplification was conducted with a fluorescently labelled forward primer and unlabelled reverse primer on a DNA Engine Tetrad 2 Peltier Thermal Cycler under the following conditions: 95°C for 15 min, followed by 35 cycles of 94°C for 30 s, 56°C for 90 s, 72 °C for 60 s, and a final extension of 60 °C for 30 min. PCR amplicons were visualized on an ABI 3730 automated DNA analyser. For the Z-002B marker, the Z alleles did not differ in size (ZZ) so all males were homozygous, whereas in females (ZW) the Z and W alleles differed in size, appear-ing heterozygous (two differappear-ing hemizygous
ampli-cons). PCR of Calex-31 amplified a
W-chromosome fragment in females, whereas in males no product was amplified. Using two differ-ent marker systems overcomes the problem of mis-typing due to allelic dropout (Toouli et al. 2000) or Z polymorphism (Dawson et al. 2001, Dos Remedios et al. 2010). Alleles were scored using GENEMAPPER software version 4.1 (Applied Biosystems, MA, USA).
Statistical analysis
Hatchling size
Because broods usually contained more than one chick (modal clutch size is three in Kentish and Snowy Plovers; Szekely et al. 1994), we assessed variation in hatchling size using linear mixed models (LMMs) implemented in R version 3.0.2 (R Core Team 2013) using the package ‘lme4’ (version 1.0-5; Bates et al. 2013). Brood identity was included as a random grouping structure to analyse sex differences in tarsus length of chicks on the day of hatching. We ran separate analyses for each population, rather than a single cross-population model, as our aim was to monitor within-population SSD development across two species that differed in body size (Kupper€ et al. 2009). We used standardized tarsus length (z -values) as the response variable in LMMs for each population separately to provide a comparable measure of SSD across populations. Initial models included chick sex (two-level factor), year (fixed factor) and hatch date (fixed covariate) together with their pairwise interactions. Because the timing
and length of the breeding season differed between populations we also standardized hatch dates for each population using z-values. Chick sex was retained in all models. For all other terms we applied stepwise model simplification, removing non-significant terms one by one, until the ‘ mini-mum model’ with lowest Akaike information
cri-terion (AIC) value was reached for each
population. Likelihood ratio tests were then carried out to estimate the significance of terms in the minimum models.
Chick growth
Early-phase tarsus growth in plovers (aged
0–25 days) is well described by a linear equation (Szekely & Cuthill 1999):
T¼aþ ðbDÞ
whereTis tarsus length (in mm) at ageD(in days), andaandbare estimated parameters (size at hatch-ing and daily growth rate respectively; Table 1). Linear regression models werefitted for each popu-lation separately, including all tarsus length mea-surements of known-age chicks captured at least once after the day of hatching (see Supporting Information Fig. S1 for plots offitted lines).
factors. As the two model sets gave qualitatively the same results, we report only the results of models with social brood ID.
Cross-population analyses
Sex differences in hatchling size and chick growth were tested independently for each study popula-tion (Methods above). However, the results of independent tests may not be directly comparable if datasets differ in sample size or if there is additional structure caused by other explanatory variables. Therefore, to statistically combine mea-sures of effect for each independent test, to deter-mine the presence and magnitude of an overall effect, and to measure the degree of heterogeneity in the data between locations, we implemented meta-analytic methods in METAWIN version 2.0 (Rosenberg et al. 1999). The effect size estimates for sex differences in thefinal model in each popu-lation were calculated from likelihood ratio test Chi-squared statistics using Fisher’s z -transforma-tion. Negative values of Fisher’s z-transformation represent a negative effect, positive values repre-sent a positive effect, and a zero value reprerepre-sents no effect. A cumulative effect size (grand mean) weighted by sample sizes was then calculated to represent the overall magnitude of the effect across populations. Heterogeneity across sample sets was estimated (QT values) to evaluate the
likelihood that variance among effect sizes was greater than expected by sampling error. For both hatchling tarsus length and tarsus growth models, the ratio of the square root pooled variance to mean study variance (hatching ratio = 0.00; growth ratio= 0.81) indicated that cross-popula-tion analyses were appropriate without the need for further grouping.
R ES UL TS
Hatchling size
In Ceuta, male chicks had significantly larger tarsi
than females on the day of hatching (b =
0.263 0.099 (se); Table 2). In the other three populations, no significant sex differences in hatch-ling size were identified, although in all cases a non-significant trend emerged for larger male than female hatchlings (Fig. 2a). In Ceuta and Al Wathba, the tarsus length of hatchlings varied over time: in Ceuta, chicks hatching in 2008 had shorter tarsi than those hatching in other years of the study and in Al Wathba, tarsus length was shorter among those hatching later in the season (b = 0.631 0.120; Fig. 2a).
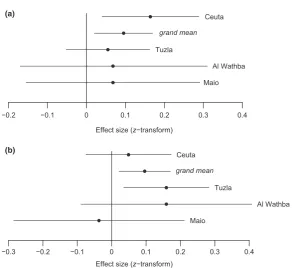
Meta-analytic results supported the existence of population differences in SSD at hatching. For Ceuta, the effect size for tarsus length exceeded the grand mean (Zr = 0.164, var(Zr)= 0.004; grand mean 0.095; Fig. 3) in contrast to the relatively lower effect sizes of the other three populations. Furthermore, no significant heteroge-neity among datasets emerged (QT = 1.874, 3 df,
P= 0.599).
Chick growth
In Tuzla, male chicks grew faster than females (b = 0.3860.146; Table 2). In contrast, no sig-nificant sex differences were identified in Ceuta, Al Wathba or Maio, based on independent testing. In Tuzla, chicks that hatched later in the season
grew faster than those hatching earlier on
[image:5.595.66.538.567.686.2](b = 0.1920.089; Table 2) and there was also a trend for faster growth among later chicks in Ceuta
Table 2. Tarsus length of plover chicks on the day of hatching and tarsus growth up to age 25 days. The significance of terms in
‘minimum’linear mixed models was assessed by likelihood ratio tests.
Response Predictor
Ceuta, Mexico Tuzla, Turkey Al Wathba, UAE
Maio, Cape Verde
v2(df) P
v2(df) P
v2(df) P
v2(df) P
Hatchling tarsus length Sex 6.94 (1) 0.008* 1.06 (1) 0.304 0.33 (1) 0.568 0.37 (1) 0.544
Hatch date 21.07 (1) <0.001*
Year 12.59 (3) 0.006*
Tarsus growth residuals Sex 0.66 (1) 0.418 6.67 (1) 0.010* 1.67 (1) 0.196 0.09 (1) 0.768
Hatch date 4.26 (1) 0.039*
Year9hatch date 8.36 (2) 0.015*
in two of three study years (2006 and 2009; year9hatch date interaction; Table 2, Fig. 2b).
After correcting for sample size, meta-analyses indicated that the magnitude of the effect size in Al Wathba (Zr = 0.159, var(Zr)= 0.016) was sim-ilar to that of Tuzla (Zr = 0.159, var(Zr)= 0.004; Fig. 3), suggesting a trend towards faster male than female growth in both populations, in contrast to Ceuta and Maio, where effect sizes were below the grand mean (0.096). No significant heteroge-neity among datasets emerged (QT = 3.027, 3 df,
P= 0.388), suggesting that the variance among effect sizes was within the range expected due to sampling error alone.
DISCUS SION
Our results suggest that despite very similar SSD in adults (4%, K€upper et al.2009, T. Szekely un-publ. data), the ontogeny of SSD differs among populations in two closely related plover species (Fig. 2). In Ceuta, male Snowy Plover chicks were larger than females on the day of hatching, but subsequent growth rates until fledging (age 25 days) did not differ between the sexes. This
suggests that SSD in the Ceuta population can largely be attributed to prenatal development. Conversely, in Tuzla, male and female Kentish Plover hatchlings did not differ significantly in size but male chicks grew faster than female chicks up to fledging, suggesting that SSD in this population developed largely postnatally. A simi-lar effect was identified at Al Wathba (Kentish Plover) in cross-population meta-analyses (though non-significant based on LMMs). Lastly, in the Maio Kentish Plover population, no significant sex differences in body size were identified among chicks at any stage, therefore the SSD previously observed among the adults of this pop-ulation is more likely to have emerged after fl edg-ing due to either sex differences in growth rate, growth duration, or differential survival relative to size.
Although minor differences in sampling were present among populations, these sampling biases cannot explain the observed results. Despite sam-ple sizes being lower for two of the four popula-tions (Al Wathba, Maio; Table 1), meta-analytic comparison of effect sizes enabled the identifi ca-tion of populaca-tion differences in sex-bias, and no
−
1.5
−
0.5
0.5
1.5
Standardised tarsus length 2006 2007 2008 2009
−
1.5
−
0.5
0.5
1.5
Ceuta Tuzla Al Wathba Maio
Tarsus growth residuals
Population 2006 2007 2009
(a)
[image:6.595.153.445.85.313.2](b)
Figure 2. (a) Tarsus length on the day of hatching and (b) tarsus growth up to 25 days old for male and female chicks in four plover populations. Points represent predicted values (with standard error) from the best supported models (see Table 2). Separate plots are provided to visualize the effects of significant environmental variables:‘year’,‘hatch date’and their interactions. Note that hatch date was a continuous variable in the analyses; however, it has been converted to a binary variable (early, late) to visualize
inter-actions here. Males are represented byfilled symbols, females by open symbols. Circles represent means for the entire season,
significant heterogeneity emerged between data-sets. Additionally, a larger proportion of recapture measurements was available for younger than older chicks (pre- rather than post-12.5 days); however, the relative distribution of measurements by age was similar across populations (mean age at cap-ture: Ceuta 5 days, Tuzla 7 days, Al Wathba 6 days, Maio 4 days).
In contrast to previous studies (Badyaev et al. 2001b, Blondel et al. 2002, Blanckenhorn et al. 2006, Laioloet al.2013), very similar levels of SSD were identified across populations of breeding adult plovers, but our results suggest this SSD emerges at different ontogenic stages in different populations. We suggest that multiple proximate mechanisms may therefore be involved, enabling divergence in body size at different stages even within a single species. Badyaev (2002) suggested that at any given age, the level of SSD would depend on the relative influence of age-specific genetic effects, environ-mental effects, maternal effects and age-specific epigenetic interactions. Whether SSD develops may depend on sex-specific responses to the external environment as well as responses to internal selec-tion pressures, for example differences in the
functional coordination of developmental processes (Gebhardt-Henrich & Richner 1998, Badyaev 2002, Klenovsek & Krystufek 2013).
The three Kentish Plover populations studied are genetically similar and distinct from the Snowy Plovers (Kupper€ et al. 2009, 2012). Patterns of SSD ontogeny were consistent with genetic differ-ences, as meta-analyses suggested the two most closely related populations, Tuzla and Al Wathba, exhibited similar postnatal SSD development between 0 and 25 days of age. Environmental dif-ferences between populations may also affect sex-specific development. Previous studies have reported context-dependent SSD in relation to environmental variation. For example, variation in climate, food resources or parasite abundance can influence patterns of growth differently for males and females, leading to differences in the extent of adult SSD in closely related populations (Richner 1989, Cooch et al. 1996, Sheldon et al. 1998, Badyaev et al. 2001a, Blondel et al. 2002, Blanc-kenhorn et al. 2006, Hegyi et al. 2011, Stillwell et al. 2014). Whether sex differences emerge prenatally, postnatally or after fledging may depend on whether sex differences in growth are
Effect size (z−transform)
−0.2 −0.1 0 0.1 0.2 0.3 0.4
Ceuta
grand mean
Tuzla
Al Wathba
Maio
Effect size (z−transform)
−0.3 −0.2 −0.1 0 0.1 0.2 0.3 0.4
Ceuta
grand mean
Tuzla
Al Wathba
Maio (a)
[image:7.595.151.445.75.344.2](b)
Figure 3. Mean effect sizes (Fisher’s z-transformation) with associated 95% confidence intervals for sex differences in (a) tarsus
length at hatching and (b) tarsus growth across four plover populations. Thegrand meanrepresents the overall magnitude of effects
more pronounced under detrimental or favourable abiotic or biotic conditions.
Differences in ambient temperature have been reported among the four study populations (Ceuta
34.078.46 °C; Tuzla 25.632.88 °C; Al
Wathba 35.229.17°C; Maio 29.31 5.08°C; Vincze et al. 2013). However, these differences are not consistent with the observed population differences in development of SSD among plovers, as Snowy Plovers from Ceuta and Kentish Plover chicks from Al Wathba hatched at very similar temperatures but showed different ontogenies for SSD. Furthermore, although overall tarsus length at hatching or tarsus growth varied significantly with hatch date and/or year in three of the four populations, no significant interactions emerged between seasonal variables and the sex of off-spring, suggesting that within-population environ-mental variation influenced both sexes equally.
One environmental factor that may be corre-lated with the observed population differences is locality: Maio (where no sex differences were iden-tified among offspring) is an island location (Cape Verde, 625 km from mainland Africa), whereas the other three populations are in mainland regions. Offspring development in island popula-tions is often slower than on the mainland (Andrews 1976, Higuchi & Momose 1981). One possibility is that males in Maio continue to grow beyond 25 days, causing SSD to develop later on. Our monitoring did not continue beyond 25 days due to the difficulties of recapturing fledged chicks. Although the tarsus length of fledglings was approaching that of adults across study popu-lations (Kupper€ et al. 2009; T. Szekely unpubl. data), to understand more fully how SSD develops it would be necessary to recapture and monitor growth of juvenile plovers beyond 25 days of age.
Alternatively, adult SSD may emerge through sex-biased differences in migration patterns, dis-persal or behavioural exclusion of larger or smaller individuals (Stamps 1993, Watkins 1996, Haenel & John-Alder 2002, Cox & John-Alder 2007). The reported levels of SSD were based upon breeding adults captured either on the nest or with chicks (Kupper€ et al. 2009, T. Szekely unpubl. data). This may not provide a true representation of the body size distribution for the entire population. For example, it may be that smaller males do not breed in some populations such as Maio, and SSD may be reduced or absent in the population as a whole.
The patterns of sex-biased offspring develop-ment identified within this study may have implica-tions for population-level evolutionary processes. Sex-biases in body size can influence the relative mortality rates of males and females, and among bird species with only moderate SSD such as in plo-vers, the larger sex usually has the survival advan-tage (Bortolotti 1986, Oddie 2000, Hipkiss et al. 2002, Raberg et al. 2005, Rowland et al. 2007). Sex-biased mortality can lead to biased adult sex ratios (ratio of males to females). There is increasing theoretical and empirical evidence for a role of adult sex ratio in the evolution of parental care and mating systems (Szekely et al. 1999, Kokko & Jennions 2008, Jennions & Kokko 2010, Kosz-tolanyi et al. 2011, Liker et al. 2013). This is of particular relevance among Kentish and Snowy Plo-vers, as extremely high variation has been reported in parental care strategies at the population level (Kosztolanyiet al.2009, Arg€uelles-Tico 2011).
In summary, we present evidence that moderate male-biased adult SSD may emerge at different stages of development (prenatal or postnatal) across closely related species and also across genetically similar populations of the same species. Further comparative cross-population studies are needed to address how the ontogeny of SSD varies in relation to particular environmental conditions, and to determine the proximate mechanisms involved in driving variation in SSD ontogeny among populations.
REFERENCES
Andrews, R.M. 1976. Growth rate in island and mainland
Anolinelizards.Copeia1976: 477–482.
Arguelles-Tico, A.€ 2011.Sexual selection, breeding systems and melanin-based plumage colouration in plovers Charadriusspp. PhD Thesis, University of Bath, UK.
Badyaev, A.V.2002. Growing apart: ontogenetic perspective
on the evolution of sexual size dimorphism. Trends Ecol.
Evol.17: 369–378.
Badyaev, A.V., Whittingham, L.A. & Hill, G.E. 2001a. The evolution of sexual size dimorphism in the house finch. III. Developmental basis.Evolution55: 176–189.
Badyaev, A.V., Hill, G.E. & Whittingham, L.A. 2001b. The
evolution of sexual size dimorphism in the housefinch. IV.
Population divergence in ontogeny. Evolution 55: 2534–
2549.
Bailey, R.C. & Byrnes, J. 1990. A new, old method for
assessing measurement error in both univariate and
multivariate morphometric studies.Syst. Zool.39: 124–130.
Bates, D., Maechler, M., Bolker, B. & Walker, S.2013. lme4: Linear mixed-effects models using Eigen and S4. R
package version 1.0-5. Available at:
http://CRAN.R-project.org/package=lme4 (accessed 31 January 2014).
Bertin, A. & Cezilly, F. 2003. Sexual selection, antennae
length and the mating advantage of large males inAsellus
aquaticus.J. Evol. Biol.16: 491–500.
Blanckenhorn, W.U.2000. The evolution of body size: what keeps organisms small?Q. Rev. Biol.75: 385–407.
Blanckenhorn, W.U. 2005. Behavioral causes and
consequences of sexual size dimorphism. Ethology 111:
977–1016.
Blanckenhorn, W.U., Stillwell, R.C., Young, K.A., Fox, C.W. & Ashton, K.G. 2006. When Rensch meets Bergmann: does sexual size dimorphism change systematically with latitude?Evolution60: 2004–2011.
Blanckenhorn, W.U., Dixon, A.F.G., Fairbairn, D.J., Foellmer, M.W., Gibert, P., van der Linde, K., Meier, R., Nylin, S., Pitnick, S., Schoff, C., Signorelli, M., Teder, T. & Wiklund, C. 2007. Proximate causes of Rensch’s rule: does sexual size dimorphism in arthropods result
from sex differences in developmental time?Am. Nat. 169:
245–257.
Blondel, J., Perret, P., Anstett, M.-C. & Thebaud, C. 2002. Evolution of sexual size dimorphism in birds: test of hypotheses using Blue Tits in contrasted Mediterranean habitats.J. Evol. Biol.15: 440–450.
Bortolotti, G.R. 1986. Evolution of growth rates in eagles:
sibling competition vs. energy considerations. Ecology 67:
182–194.
Cooch, E.G., Lank, D.B. & Cooke, F. 1996. Intraseasonal variation in the development of sexual size dimorphism in a precocial bird: evidence from the lesser snow goose.
J. Anim. Ecol.65: 439–450.
Cox, R.M. & John-Alder, H.B.2007. Growing apart together: the development of contrasting sexual size dimorphisms in sympatricSceloporuslizards.Herpetologica63: 245–257.
Cox, R.M., Stenquist, D.S. & Calsbeek, R. 2009. Testosterone, growth and the evolution of sexual size dimorphism.J. Evol. Biol.22: 1586–1598.
Darwin, C. 1871. The Descent of Man, and Selection in Relation to Sex. London: John Murray.
Dawson, D.A. 2007. Genomic analysis of passerine birds using conserved microsatellite loci. PhD Thesis, University of Sheffield, UK.
Dawson, D.A., Darby, S., Hunter, F.M., Krupa, A.P., Jones, I.L. & Burke, T.2001. A critique of CHD-based molecular sexing protocols illustrated by a Z-chromosome polymorphism detected in auklets.Mol. Ecol. Notes1: 201–204.
Dietrich-Bischoff, V., Schmoll, T., Winkel, W. & Lubjuhn, T.
2008. Variation in the magnitude of sexual size dimorphism in nestling Coal Tits (Periparus ater).J. Ornithol.149: 565– 577.
Dos Remedios, N., Lee, P.L.M., Szekely, T., Dawson, D.A. & Kupper, C.€ 2010. Molecular sex-typing in shorebirds: a review of an essential method for research in evolution,
ecology and conservation. Wader Study Group Bull. 117:
109–118.
Dunham, A.E., Maitner, B.S., Razafindratsima, O.H., Simmons, M.C. & Roy, C.L. 2013. Body size and sexual
size dimorphism in primates: influence of climate and net
primary productivity.J. Evol. Biol.26: 2312–2320.
Fairbairn, D.J. 2007. Introduction: the enigma of sexual size dimorphism. In Fairbairn, D.J., Blanckenhorn, W. & Szekely,
T. (eds)Sex, Size and Gender Roles: Evolutionary Studies
of Sexual Size Dimorphism: 1–10. Oxford: Oxford University Press.
Gebhardt-Henrich, S.G. & Richner, H. 1998. Causes of growth variation and its consequences forfitness. In Starck, J.M. & Ricklefs, R.E. (eds)Avian Growth and Development: Evolution Within the Altricial-Precocial Spectrum: 324–339. Oxford: Oxford University Press.
Godfrey, G.F. & Farnsworth, G.M., Jr1952. Relation of the sex-linked rapid feathering gene to chick growth and mortality.Poult. Sci.31: 65–68.
Haenel, G.J. & John-Alder, H.B. 2002. Experimental and demographic analyses of growth rate and sexual size dimorphism in a lizard,Sceloporus undulatus.Oikos96: 70– 81.
Hasumi, M. 2010. Age, body size, and sexual dimorphism in
size and shape in Salamandrella keyserlingii (Caudata:
Hynobiidae).Evol. Biol.37: 38–48.
Hayman, P., Marchant, J. & Prater, T.1988.Shorebirds: An Identification Guide to Waders of the World. London: Christopher Helm Ltd.
Hegyi, G., Rosivall, B., Sz€ollosi, E., Eons, M. & T} €or€ok, J.
2011. Context-dependent effects of nestling growth
trajectories on recruitment probability in the Collared
Flycatcher.Behav. Ecol. Sociobiol.65: 1647–1658.
Helle, S., Laaksonen, T. & Huitu, O. 2013. Sex-specific
offspring growth according to maternal testosterone,
corticosterone, and glucose levels.Behav. Ecol.24: 205–212.
Higuchi, H. & Momose, H.1981. Deferred independence and
prolonged infantile behaviour in young varied tits, Parus
varius, of an island population.Anim. Behav.29: 523–528.
Hipkiss, T., Hornfeldt, B., Eklund, U. & Berlin, S.€ 2002. Year-dependent sex-biased mortality in supplementary-fed Tengmalm’s owl nestlings.J. Anim. Ecol.71: 693–699.
Jennions, M.D. & Kokko, H. 2010. Sexual selection. In Westneat, D.F. & Fox, C.W. (eds)Evolutionary Behavioural Ecology: 343–364. Oxford: Oxford University Press.
Kersten, M. & Brenninkmeijer, A. 2008. Growth, fledging
success and post-fledging survival of juvenile
Klenovsek, T. & Krystufek, B. 2013. An ontogenetic perspective on the study of sexual dimorphism, phylogenetic variability, and allometry of the skull of European ground
squirrel, Spermophilus citelus (Linnaeus, 1766).
Zoomorphology132: 433–445.
Klukowski, M., Ackerson, B. & Nelson, C.E. 2004. Testosterone and daily activity period in laboratory-housed Mountain Spiny Lizards, Sceloporus jarrov.J. Herpetol. 38: 120–124.
Kokko, H. & Jennions, M.D. 2008. Parental investment, sexual selection and sex ratios.J. Evol. Biol.21: 919–948.
Kosztolanyi, A., Javed, S., K €upper, C., Cuthill, I.C., Al Shamsi, A. & Szekely, T. 2009. Breeding ecology of
Kentish PloverCharadrius alexandrinusin an extremely hot
environment.Bird Study56: 244–252.
Kosztolanyi, A., Barta, Z., K upper, C. & Sz€ ekely, T. 2011. Persistence of an extreme male-biased adult sex ratio in a
natural population of polyandrous bird. J. Evol. Biol. 24:
1842–1846.
Kupper, C., Horsburgh, G.J., Dawson, D.A., Ffrench-€ Constant, R., Szekely, T. & Burke, T. 2007. Characterisation of 36 polymorphic microsatellite loci in the Kentish Plover (Charadrius alexandrinus) including two sex-linked loci and their amplification in four other Charadrius
species.Mol. Ecol. Notes7: 35–39.
Kupper, C., Augustin, J., Kosztol€ anyi, A., Burke, T., Figuerola, J. & Szekely, T. 2009. Kentish versus Snowy
Plover: phenotypic and genetic analyses of Charadrius
alexandrinus reveal divergence of Eurasian and American subspecies.Auk126: 839–852.
Kupper, C., Edwards, S.V., Kosztol€ anyi, A., AlRashidi, M., Burke, T., Herrmann, P., Arg€uelles-Tico, A., Amat, J.A., Amezian, M., Rocha, A., H€otker, H., Ivanov, A., Chernicko, J. & Szekely, T. 2012. High gene flow on a
continental scale in the polyandrous Kentish Plover
Charadrius alexandrinus.Mol. Ecol.21: 5864–5879.
Laiolo, P., Illera, J.C. & Obeso, J.R. 2013. Local climate determines intra- and interspecific variation in sexual size
dimorphism in mountain grasshopper communities.J. Evol.
Biol.26: 2171–2183.
Leigh, S.R. & Shea, B.T.1995. Ontogeny and the evolution of adult body size dimorphism in apes.Am. J. Primatol.36: 37–60.
Liker, A., Freckleton, R.P. & Szekely, T.2013. The evolution
of sex roles in birds is related to adult sex ratio. Nat.
Commun.4: 1587.
Lislevand, T., Figuerola, J. & Szekely, T. 2009. Evolution of
sexual size dimorphism in grouse and allies (Aves:
Phasianidae) in relation to mating competition, fecundity demands and resource division.J. Evol. Biol.22: 1895–1905.
Muller, W., Goerlich, V.C., Vergauwen, J., Groothuis, T.G.G.€ & Eens, M. 2012. Sources of variation in yolk hormone
deposition: consistency, inheritance and developmental
effects.Gen. Comp. Endocrinol.175: 337–343.
Nicholls, J.A., Double, M.C., Rowell, D.M. & Magrath, D.
2000. The evolution of cooperative and pair breeding in thornbills Acanthiza (Pardalotidae). J. Avian Biol.31: 165– 176.
Oddie, K.R. 2000. Size matters: competition between male and female great tit offspring.J. Anim. Ecol.69: 903–912.
Oring, L.W., Able, K.P., Anderson, D.W., Baptista, L.F., Barlow, J.C., Gaunt, A.S., Gilland, F.B. & Wingfield, J.C.
1988. Guidelines for use of wild birds in research. Auk
(Supp.)104: 1A–44A.
Price, T.D.1984. The evolution of sexual size dimorphism in Darwin’sfinches.Am. Nat.123: 500–518.
R Core Team. 2013. R: A language and environment for statistical computing. Vienna: R Foundation for Statistical Computing. Available at: http://www.R-project.org/ (accessed 3 January 2014).
Raberg, L., Stjernman, M. & Nilsson, J.A. 2005. Sex and
environmental sensitivity in Blue Tit nestlings. Oecologia
145: 496–503.
Richardson, D.S., Jury, F.L., Blaakmeer, K., Komdeur, J. & Burke, T. 2001. Parentage assignment and extra-group paternity in a cooperative breeder: the Seychelles warbler (Acrocephalus sechellensis).Mol. Ecol.10: 2263–2273.
Richner, H. 1989. Habitat-specific growth and fitness in
carrion crows (Corvus corone corone). J. Anim. Ecol. 58:
427–440.
Rising, J.D. & Somers, K.M. 1989. The measurement of overall body size in birds.Auk106: 666–674.
Rosenberg, M.S., Adams, D.C. & Gurevitch, J. 1999.
MetaWin: Statistical Software for Meta-Analysis. Version 2.0. Sunderland, MA: Sinauer Associates.
Rowland, E., Love, O.P., Verspoor, J.J., Sheldon, L. & Williams, T.D.2007. Manipulating rearing conditions reveals developmental sensitivity in the smaller sex of a passerine bird, the European StarlingSturnus vulgaris. J. Avian Biol.
38: 612–618.
Sellier, P. 2000. Genetically caused retarded growth in animals.Domest. Anim. Endocrinol.19: 105–119.
Senar, J.C. & Pascual, J. 1997. Keel and tarsus length may provide a good predictor of avian body size.Ardea85: 269– 274.
Serrano-Meneses, M.A. & Szekely, T. 2006. Sexual size dimorphism in seabirds: sexual selection, fecundity selection and differential niche-utilisation.Oikos113: 385–394.
Seutin, G., White, B.N. & Boag, P.T. 1991. Preservation of
avian blood and tissue samples for DNA analyses.Can. J.
Zool.69: 82–90.
Sheldon, B.C., Meril€a, J., Lindgren, G. & Ellegren, H.1998. Gender and environmental sensitivity in nestling Collared Flycatchers.Ecology79: 1939–1948.
Stamps, J.A. 1993. Sexual size dimorphism in species with asymptotic growth after maturity.Biol. J. Linn. Soc.50: 123– 145.
Stillwell, R.C., Daws, A. & Davidowitz, G. 2014. The ontogeny of sexual size dimorphism of a moth: when do
males and females grow apart?PLoS One9: e106548.
Szekely, T. & Cuthill, I.C. 1999. Brood desertion in Kentish Plover: the value of parental care.Behav. Ecol.10: 191–197.
Szekely, T. & Williams, T.D. 1994. Factors affecting timing of
brood desertion by female Kentish PloversCharadrius
alexandrinus.Behaviour130: 17–28.
Szekely, T., Karsai, I. & Williams, T.D. 1994. Determination of clutch-size in the Kentish PloverCharadrius alexandrinus.
Ibis136: 341–348.
Szekely, T., Cuthill, I.C. & Kis, J. 1999. Brood desertion in Kentish Plover: sex differences in remating opportunities.
Behav. Ecol.10: 185–190.
influence of sexual and natural selection. Evolution 54: 1404–1413.
Szekely, T., Freckleton, R.P. & Reynolds, J.D.2004. Sexual
selection explains Rensch’s rule of size dimorphism in
shorebirds.Proc. Natl Acad. Sci. USA101: 12224–12227.
Szekely, T., Kosztolanyi, A. & Kupper, C.€ 2008. Practical guide for investigating breeding ecology of Kentish Plover
Charadrius alexandrinus, Version 3. Unpublished Report, University of Bath. Available at:
http://www.bath.ac.uk/bio-sci/biodiversity-lab/pdfs/KP_Field_Guide_v3.pdf (accessed
20 March 2012).
Toouli, C.D., Turner, D.R., Grist, S.A. & Morley, A.A.2000. The effect of cycle number and target size on polymerase
chain reaction amplification of polymorphic repetitive
sequences.Anal. Biochem.280: 324–326.
Vincze, O., Székely, T., Küpper, C., AlRashidi, M., Amat, J.A., Argüelles Ticó, A., Burgas, D., Burke, T., Cavitt, J., Figuerola, J., Shobrak, M., Montalvo, T. & Kostolányi, A.
2013. Local environment but not genetic differentiation
influences biparental care in ten plover populations. PLoS
One8: e60998.
Warriner, J.S., Warriner, J.C., Page, G.W. & Stenzel, L.E.
1986. Mating system and reproductive success of a small
population of polygamous Snowy Plovers. Wilson Bull. 98:
15–37.
Watkins, G.G. 1996. Proximate causes of sexual size
dimorphism in the iguanian lizard Microlophus occipitalis.
Ecology77: 1473–1482.
Zhang, L. & Liu, X. 2013. Ontogenetic mechanisms underlying sexual size dimorphism in Urodele amphibians: an across-species approach.Curr. Zool.59: 142–150.
Received 29 April 2014; revision accepted 22 March 2015. Associate Editor: Jeroen Reneerkens.
SUPPORTING INFORMATION
Additional Supporting Information may be found in the online version of this article: