This is a repository copy of Techno-Ecological Synergy: A Framework for Sustainable
Engineering.
White Rose Research Online URL for this paper:
http://eprints.whiterose.ac.uk/87347/
Version: Accepted Version
Article:
Bakshi, BR, Ziv, G and Lepech, MD (2015) Techno-Ecological Synergy: A Framework for
Sustainable Engineering. Environmental Science and Technology Letters, 49 (3). 1752 -
1760.
https://doi.org/10.1021/es5041442
[email protected] https://eprints.whiterose.ac.uk/ Reuse
Unless indicated otherwise, fulltext items are protected by copyright with all rights reserved. The copyright exception in section 29 of the Copyright, Designs and Patents Act 1988 allows the making of a single copy solely for the purpose of non-commercial research or private study within the limits of fair dealing. The publisher or other rights-holder may allow further reproduction and re-use of this version - refer to the White Rose Research Online record for this item. Where records identify the publisher as the copyright holder, users can verify any specific terms of use on the publisher’s website.
Takedown
If you consider content in White Rose Research Online to be in breach of UK law, please notify us by
Techno-Ecological Synergy:
1A Framework for Sustainable Engineering
2Bhavik R. Bakshi
1†∗, Guy Ziv
2†, Michael D. Lepech
31
Lowrie Department of Chemical and Biomolecular Engineering
The Ohio State University, Columbus, OH 43210, USA
2
School of Geography
University of Leeds, Leeds LS2 9JT, UK
3
Department of Civil and Environmental Engineering
Stanford University, Stanford, CA, 94305, USA
3
Abstract 4
Even though the importance of ecosystems in sustaining all human activities is well-known,
5
methods for sustainable engineering fail to fully account for this role of nature. Most methods
6
account for the demand for ecosystem services, but almost none account for the supply.
Incom-7
plete accounting of the very foundation of human well-being can result in perverse outcomes from
8
decisions meant to enhance sustainability and lost opportunities for benefiting from the ability
9
of nature to satisfy human needs in an economically and environmentally superior manner. This
10
paper develops a framework for understanding and designing synergies between technological
11
and ecological systems to encourage greater harmony between human activities and nature. This
12
framework considers technological systems ranging from individual processes to supply chains
13
and life cycles, along with corresponding ecological systems at multiple spatial scales ranging
14
from local to global. The demand for specific ecosystem services is determined from
informa-15
tion about emissions and resource use, while the supply is obtained from information about
16
the capacity of relevant ecosystems. Metrics calculate the sustainability of individual ecosystem
17
services at multiple spatial scales and help define necessary but not sufficient conditions for local
18
and global sustainability. Efforts to reduce ecological overshoot encourage enhancement of life
19
cycle efficiency, development of industrial symbiosis, innovative designs and policies, and
eco-20
logical restoration, thus combining the best features of many existing methods. Opportunities
21
for theoretical and applied research to make this framework practical are also discussed.
22
1
Introduction
23
Increasing interest in sustainability has resulted in several approaches for considering the broader
24
environmental impact of industrial processes and products [1]. These activities aim to enhance
25
efficiency and reduce impact across the entire life cycle. Resulting methods include eco-efficiency
26
[2], carbon [3] and water [4] footprints, life cycle assessment [5, 6], and cradle to cradle design [7],
27
which are widely used for guiding decisions, managing supply chains, and designing products and
28
processes. These efforts have mainly focused on resource use and emissions, and their impact
29
on people and the environment. The role of ecosystems in sustaining all human activities has
30
been mostly ignored, until recently.
31
Ecosystems provide goods such as grains, biomass, water, and genetic resources; regulate
32
the climate, pests, floods, and air and water quality; support other services via photosynthesis,
33
pollination, and biogeochemical cycles; and are of cultural, spiritual and aesthetic value. Their
34
importance for sustainability is undeniable not just physically but also monetarily [8, 9]. The
35
Millennium Ecosystem Assessment identified 80% of global ecosystem services as degraded [10],
36
while Rockstrom et al. [11] claim that anthropogenic activities already exceed the “safe operating
37
zone” in services associated with carbon and nitrogen cycles, and biodiversity loss. These studies
38
point toward the urgent need to consider the status of ecosystem services in engineering decisions,
39
and to devise ways of encouraging ecosystem restoration.
40
Almost all eco-efficiency and life cycle oriented methods ignore the essential role of ecosystems
41
in sustaining human activities and well-being. Some methods do consider the demand of selected
42
ecosystem services, but all ignore the capacity of ecosystems to supply individual services. LCA
43
accounts for the impact of human activities on some ecosystem services associated with water,
44
soil carbon, biomass, land use, and biodiversity [12, 13], as do some thermodynamic methods
45
[14, 15]. However, these methods only consider the demand of these services and not their
46
locations and availability. Ecological footprint does account for biocapacity [16] but in a highly
47
aggregated manner that is blind to individual services. As a result, decisions based on these
48
existing methods could unintentionally increase reliance on scarce or degraded ecosystem services
49
or destroy ecosystems entirely.
50
Quantifying the role of ecosystem services has received attention in the last few years, and has
51
resulted in many models, frameworks and tools [17]. Industrial efforts have been led by
organiza-52
tions such as Business for Social Responsibility (BSR), World Business Council for Sustainable
53
Development (WBCSD), and the Natural Capital Coalition (NCC). Nonprofit environmental
54
groups have also initiated projects for assessing corporate reliance on ecosystem services [18].
55
Often these tools quantify nature’s services in monetary terms to enable policy and corporate
56
use. However, a gap exists between efforts and methods for assessment of ecosystem services
57
and design of sustainable systems [19].
58
This paper describes a new framework for assessing and engineering interconnected
technological-59
ecological systems by explicitly accounting for the demand that technological systems place on
60
ecosystems and the supply of ecosystem services that nature can provide to a process or product
61
at multiple spatial scales. We call this approach Techno-Ecological Synergy (TES) to reflect its
62
emphasis on establishing mutually beneficial or synergistic relationships between technological
63
and ecological systems, with the ultimate goal of achieving harmony between human activities
64
and nature. The ecosystem services demanded by the technological system are quantified by
65
information about resource use and emissions, while the supply is quantified by knowledge of
66
ecosystems, their biogeochemical functioning, and the services and benefits they provide. Unlike
67
eco-efficiency or ecosystem evaluation measures which focus on minimizing the impact of
techno-68
logical systems on natural ecosystems, TES metrics are developed to determine and reduce the
69
demand overshoot for each ecosystem service with regard to available and maximum possible
70
ecosystem service provision. This approach combines the best features of existing methods such
71
as life cycle assessment, cradle to cradle design, and ecosystem service assessment. It encourages
72
improving process efficiency as in traditional engineering, enhances life cycle efficiency as done
73
by life cycle and footprint methods, encourages closing of material cycles as in industrial
sym-74
biosis and cradle-to-cradle design, and encourages ecosystem restoration as done by ecosystem
75
service assessment methods.
76
In the rest of this article, the next section provides a brief overview of relevant methods,
77
followed by two sections that define the ecological system, and the methodology of
techno-78
ecological synergy. An illustrative example follows, closing with an outlook of challenges that
79
need to be met for this framework to be practical.
2
Background
81
Numerous methods and approaches have been proposed to better align engineered technological
82
systems with environmental sustainability goals. Such efforts range from basic guidelines and
83
checklists for “green” design [20, 21, 22, 23] to comprehensive analysis and design tools for full
84
accounting of social, environmental, and economic impacts. The latter are reviewed in [24], and
85
include Cradle to Cradle design [7], Design for Environment (DfE) [25], and fully integrated LCA
86
design software [26, 27]. These and other sustainable engineering methods have paid limited
87
attention to the dependence and impact of engineering activities on ecosystems. As reviewed in
88
[28], methods such as water footprint [4], human appropriation of net primary productivity [29],
89
and some aspects of LCA do consider the demand for some ecosystem services.
Ecologically-90
based LCA (Eco-LCA) quantifies the demand for ecosystem services in physical units of mass,
91
exergy and emergy [30], including the role of some biogeochemical cycles [31, 32]. Life cycle
92
characterization factors are being developed to quantify the impact of land use on ecosystems
93
[33, 34]. However, life cycle methods consider mainly the impact on ecosystems at the life cycle
94
scale, and none of these methods consider the supply of specific ecosystem services at multiple
95
spatial scales. Most existing methods encourage continuous improvement by doing “less bad,”
96
[35], which need not translate into keeping human activities within ecological constraints.
97
Ecosystem service assessment and modeling is an active area of research and includes efforts
98
for understanding the role of ecosystems in supporting and enhancing human well-being [8, 36],
99
developing models and software that quantify ecosystem services [37, 38], and frameworks for
100
classifying them [10, 39, 40, 41]. There have been numerous initiatives to build links between
101
ecosystem service evaluation at local, regional, and national levels [42, 43, 44, 45, 46, 47] along
102
with characterizing ecosystem services as flows [48], budgets [49], and land management tools
103
[50, 51]. These efforts have provided much clarity about the role of ecosystems for enabling
104
human activities, and focused attention on their irreplaceable role in supporting economic and
105
social activities.
106
Some work has considered supply and demand for specific ecosystem services such as water
107
for particular scales [52] or across spatial scales [53] but these do not connect with sustainable
108
engineering. One of the most active areas of research around ecosystem service is in assessing
109
their value to the economy or society. Building on neo-classical natural resource economics, a
110
number of methods have been suggested to value ecosystems using direct or indirect valuation
111
[43, 54, 40]. However, as with sustainable engineering methods, current ecosystem service
meth-112
ods fall short of enabling sustainable engineering. This is due to either their narrow focus on
113
quantification of ecosystem service supply thus ignoring the demand or consumption of such
114
services, or their narrow focus on monetary valuation thus being unable to capture potential
115
deficits of ecosystem service provision.
116
3
Methodology
117
The Techno-Ecological Synergy (TES) framework attempts to quantify the demand and supply
118
for ecosystem services at multiple spatial scales, and compare alternatives based on the extent
119
to which the demand for an ecosystem service differs from the supply. The system and flows
120
considered in the TES approach are depicted in Figure 1. As shown, at a selected spatial scale,
121
technological systems rely on inputs from ecosystems within and outside the selected boundary.
122
Ecosystems may utilize some waste products from technological systems, and those that cannot
123
be utilized appear as pollutants in the environment. For example, a forest can take up emissions
124
such as oxides of nitrogen, sulfur, and carbon from manufacturing, while providing oxygen
125
and biomass to the process. These flows do not necessarily traverse in pipes and conveyors,
126
and can be augmented with “natural” transport, for example, carbon dioxide emitted into the
127
atmosphere and carbon dioxide sequestered elsewhere from the atmosphere. TES strives toward
128
understanding and enhancing such synergies, with the goal of closing material loops at multiple
129
spatial scales, as described below. Such an approach explicitly accounts for whether a human
Ecological Technological
Co-benefits Raw Materials
Products Timber,
clean water, clear air Recreation,
aesthetics Coal, groundwater,biomass, minerals
Inputs Goods &
Services
Ecological
Inputs Ecological
System
Technological System
Pollution Capital & Management
Wastewater, NOx, SOx, CO2
Land value,
seeds, fertilizers Remaining pollutants
Inputs
Sunlight, rain, wind
Biodiesel
Inputs Waste
Figure 1: Flows considered in Techno-Ecological Synergy at a selected scale.
activity is within the regenerative capacity of the biosphere at the spatial scales impacted by
131
the activity.
132
3.1
Defining the System
133
TES involves defining two types of boundaries: technological and ecological. The former
in-134
volves choosing the human activities to be evaluated, which could be a single process, life cycle,
135
or economic network, while the latter involves specifying geographical regions according to the
136
nature of the ecosystem service being considered. For TES assessment of a specific
manufactur-137
ing process, this process could represent the smallest technological scale. This could be followed
138
by considering the supply chain and important processes in the life cycle, added as small-scale
139
systems at the appropriate geographic location. The challenges of developing a comprehensive
140
life cycle network model based on such process information are well-known in the LCA
litera-141
ture. A common way of considering a large boundary while avoiding challenges of a large and
142
intractable network is to integrate process models with more aggregate models. In such hybrid
143
models, each of the processes is nested within processes at larger scales, which can include their
144
regional, national, and global economies [55, 56].
145
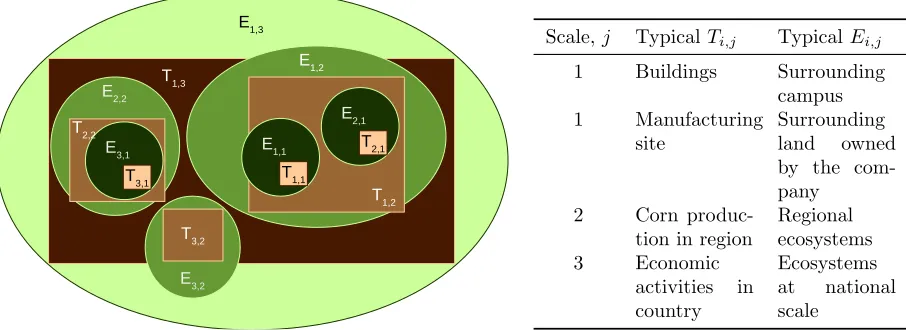
As depicted in Figure 2, technological models at each scale may be represented byTi,jwhich 146
consists of thei-th technological process at the j-th scale. Each technological system is nested
147
within ecosystems in its vicinity,Ei,j. Thus, if the smallest technological scale includes manu-148
facturing processes, then the smallest ecological scale could be the plant site or the corporate
149
campus; if the technological system is a residence, the smallest ecological scale could be the
150
yard around the house [57]. Such a technological system could be assessed by quantifying its
151
dependence on ecosystem services at multiple spatial scales, or by including its interaction with
152
other technological processes in the life cycle and corresponding ecosystems. As shown, T1,1,
153
T2,1,T3,1 represent technological processes at the finest scale,j= 1. These could be individual
154
production processes. Technological systems at a coarser scale,j= 2 are shown asT1,2,T2,2, and
155
T3,2. These could be average processes, say within a supply chain, whose information is obtained
156
from a life cycle inventory database, as discussed in Section 3.3. Ecosystems supporting these
157
technological systems are shown in Figure 2 asE1,2,E2,2andE3,2. A finer scale process may be
158
nested inside a process at a coarser scale, as shown forT3,1andT2,2. All of these technological
159
systems are inside a system at the coarsest scale shown asT1,3in Figure 2. This could represent
160
aggregated models such as economic sectors in an environmentally extended input-output model
161
[58, 59]. A final, even coarser scale could represent the global economy. In a given problem,
E
3,1
T 3,1
T 1,2 E
1,2
E
1,1
E2,1
T 2,1
T 1,1 E
1,3
T1,3
E
2,2
T 2,2
T 3,2
E3,2
Scale, j TypicalTi,j TypicalEi,j
1 Buildings Surrounding campus 1 Manufacturing
site
Surrounding land owned by the com-pany
2 Corn produc-tion in region
Regional ecosystems 3 Economic
activities in country
[image:6.612.86.539.77.242.2]Ecosystems at national scale
Figure 2: Technological and Ecological Scales
technological scales are chosen based on factors such as data availability, and scales at which
163
changes can be influenced. As depicted in the figure, each technological scale is nested within an
164
ecosystem scale, with the global biosphere being the largest ecological scale. How these scales
165
are defined depends on the system being studied and user preferences, as illustrated in Section
166
4.
167
The largest ecological scale that should be considered depends on the ecosystem service
168
being analyzed. A service such as carbon sequestration is global in nature because of the
169
global flow of CO2, which means that for closing the carbon loop, global and smaller scales
170
should be considered. Thus, carbon sequestration in any part of the world can be relevant to
171
CO2 emissions and satisfy the demand for this service anywhere on the planet. In contrast, a
172
service such as pollination is local and determined by the range covered by pollinators. Thus,
173
this service is not relevant at larger geographic scales. The largest scales of some ecosystem
174
services are listed in Table 1. This is analogous to the concept of “servicesheds” in ecosystem
175
services literature, namely the total land area that contributes service consumed or enjoyed by
176
a particular beneficiary, be it a village or a plant. For some ecosystem services, we will need
177
to specify the smallest and largest allowable scale to ensure proper interpretation of the TES
178
metrics as described in Section 3.5.
179
Through technological means, it has become possible to expand the spatial scale or
ser-180
viceshed of some ecosystem services. For example, the use of domesticated bees that are trucked
181
to different regions expands the spatial scale at which these services are available. Such options
182
should be considered within a design, however for the sake of consistent methodology with
re-183
gards to spatial scale, TES emphasizes natural ecosystem services, so these enhancements of
184
ecosystem services are treated as separate technological systems. Thus, for example, a dam
185
and reservoir will be another fine scale Ti,j system, with its direct contributing area being the 186
associated ecological system.
187
3.2
Demand and Supply of Ecosystem Services
188
After defining the system, the demand and supply of ecosystem services must be quantified.
189
Generally speaking, the demand for each ecosystem service may be determined by specific
190
emissions and resource use of the relevant technological systems, while supply may be estimated
191
from knowledge about relevant ecosystems at the selected ecological scale. As summarized in
192
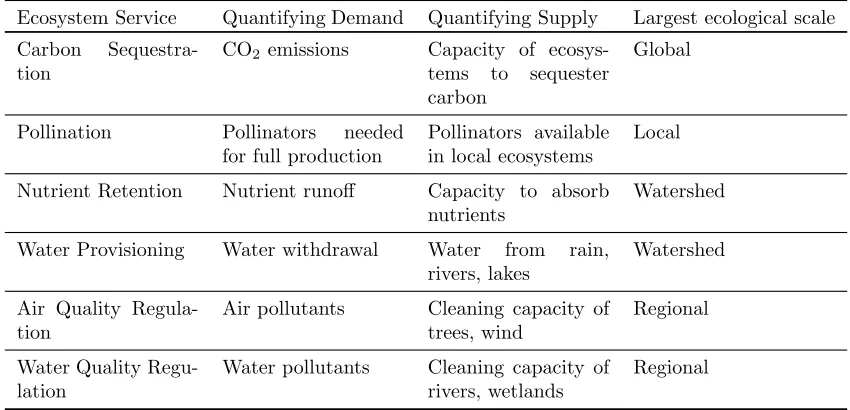
Table 1, the demand for many ecosystem services is the quantity released into or withdrawn from
193
the environment. For example, the demand for carbon sequestration is the mass of CO2emitted,
194
whereas its supply is the mass of CO2sequestered from the atmosphere by plants, trees, oceans
195
etc. The demand for water provisioning is the volume of water withdrawn, while the availability
Table 1: Demand, supply and largest scale of some ecosystem services.
Ecosystem Service Quantifying Demand Quantifying Supply Largest ecological scale Carbon
Sequestra-tion
CO2emissions Capacity of
ecosys-tems to sequester carbon
Global
Pollination Pollinators needed for full production
Pollinators available in local ecosystems
Local
Nutrient Retention Nutrient runoff Capacity to absorb nutrients
Watershed
Water Provisioning Water withdrawal Water from rain, rivers, lakes
Watershed
Air Quality Regula-tion
Air pollutants Cleaning capacity of trees, wind
Regional
Water Quality Regu-lation
Water pollutants Cleaning capacity of rivers, wetlands
Regional
of water provisioning depends on features in the watershed such as rivers, rate of groundwater
197
replenishment, rain, degree of surface imperviousness, etc. For regulating services, the demand
198
can be quantified based on the allowed or acceptable level of risk, for example the return interval
199
of flooding events, whereas hydrological models can predict how ecosystems modify that risk.
200
Additional exemplar ecosystem services, along with the quantification of supply and demand,
201
are shown in Table 1
202
While the ecosystem services listed in Table 1 are typical for small-scale technological
sys-203
tems, more services need to be considered when going to larger scales. For example, at the city
204
scale there is demand for services such as nature recreation, and at the national scale for
main-205
taining biodiversity. The supply of these can be measured by counting visitors or monitoring
206
species populations, or modeled using environmental and geospatial data. Even for small-scale
207
overshoot analysis, it is important to include these services, as otherwise services that are not
208
“material” at small scales would seem to have zero demand as discussed in Section 3.5. To ensure
209
consideration of all relevant services, one can take advantage of initiatives such as the
Euro-210
pean Common International Classification of Ecosystem Services (CICES) framework, which
211
produced a hierarchical classification of ecosystem services [39].
212
3.3
Inventory and Models
213
As described in Section 3.1, TES requires information at multiple spatial scales about
technolog-214
ical systems and the ecological systems on which they depend. Information about technological
215
systems at various scales and levels of aggregation is available from many sources. At the finest
216
scales are engineering models or data of manufacturing processes. Such models or data can
217
be very detailed and relatively accurate, and are commonly used in engineering design. At
218
coarser scales, life cycle inventory data of typical processes represents average processes in a
219
selected geographical region [60]. Such data is usually empirical, is commonly used for life cycle
220
assessment, and is likely to be less accurate than models at the process scale. At even coarser
221
scales is data about flows associated with economic sectors. Such data are often available from
222
public sources and correspond to hundreds of sectors in national economies. Such data along
223
with economic input-output models have been used for developing environmentally extended
224
input-output models and for LCA at national [58, 59] and global [61, 62, 63] scales. These
225
sources of life cycle inventory data usually do not contain information about ecosystems, and
226
cannot be used directly for TES. However, such data may be combined with models and data
about ecosystems at multiple scales, as described here.
228
To obtain information about ecosystem services at multiple scales, various models and
229
databases are available. Models of ecosystem services at the local scale include the i-Tree
230
suite [64] to quantify ecosystem services provided by urban trees. These include air quality
231
regulation by taking up pollutants such as carbon monoxide, sulfur oxides, nitrogen oxides and
232
volatile organic compounds along with modeling reduction in water run-off, etc. Models such as
233
CENTURY, DNDC, EPIC, and APEX simulate the capacity of soil to provide various
ecosys-234
tem services according to the type of land use. Models of natural and treatment wetlands are
235
also available [65] to quantify the water quality regulation service and other ecosystem services
236
provided by wetlands. Other models, such as SWAT and HEC can be used to model hydrological
237
processes and associated services such as baseflow regulation and flood protection. Such models
238
require detailed input about local ecological conditions such as species of trees, soil quality, etc.
239
Several efforts are developing more user-friendly models that require less information than
240
the detailed ecological models mentioned previously. One example is Integrated Valuation of
241
Environmental Services and Trade-Offs (InVEST) [66]. This software contains a suite of models
242
that are less information intensive and more approximate. Such models have been used for
243
estimating the supply of ecosystem services over large regions, and can benefit from increasing
244
availability of data from remote sensing and geographical information systems [67]. Examples
245
of studies about regional ecosystem services include information about water availability and
246
demand [68], flood regulation [69], carbon sequestration capacity [70], and pollination services
247
[71]. These models are comprehensive and easy to use, but less accurate than the models
248
described in the previous two paragraphs.
249
At larger scales, ecosystem services are often represented by aggregating information from
250
smaller scales, which is analogous to how technological data are aggregated for inclusion in
251
life cycle inventory databases. As data and models become available to quantify the supply of
252
ecosystem services, they should be incorporated in life cycle inventory databases and
environ-253
mentally extended input-output models to permit wider and easier application of TES. Recent
254
work has quantified the contribution of the carbon sequestration ecosystem service in the
Eco-255
LCA model of the U.S. [31]. Other efforts include assessments of environmental damage costs
256
resulting from a company’s direct and indirect emissions to calculate the “true cost” of corporate
257
activities in monetary terms [72]. This approach relies on conventional economic tools such as
258
marginal damage costs, abatement costs, environmental taxes and productive losses.
259
3.4
Allocation
260
A challenge in the proposed approach, particularly at larger scales, is due to the fact that
261
an ecosystem service available at a selected scale is likely to be demanded by many different
262
activities. Assessing the sustainability of alternatives requires ways of determining the correct
263
share of an ecosystem service among multiple users. If there are multiple users of water in a
264
watershed, the water provisioning service in the watershed needs to be allocated to each user.
265
Similarly, the carbon sequestration ecosystem service from ecosystems on public land in a city
266
would need to be partitioned between the activities that emit CO2.
267
A similar challenge arises in life cycle assessment and footprint methods when a process
268
produces multiple products. Examples of such situations include production of stover and corn
269
from corn farming, or desired mineral and tailings from mining operations. In such systems, if
270
the goal is to determine the emissions or resource use for each product, then these flows need
271
to be allocated between the products.
272
Two possible ways of allocating the supply of ecosystem services between users are as follows.
273
• Proportional allocation. The ecosystem service available in a region could be partitioned
274
between users in proportion to impact or value. For example, the carbon sequestration
275
service from vegetation on city land could be allocated in proportion to the mass of CO2
276
emitted by each activity in the city, monetary value of each activity, or some other quantity.
277
The idea underlying this approach is similar to allocation in LCA, and will face the same
278
challenge of determining the correct basis for allocation, and the results could change with
the allocation method. Such allocation could also take the form of a market for ecosystem
280
services that functioned at the scale of service provision.
281
• Avoid allocation. This approach would not allocate ecosystem services between multiple
282
users, but instead consider its total supply and total demand at the selected ecological
283
spatial scale. If the total demand exceeds the total supply, then all activities that rely
284
on this ecosystem service at that scale will be considered to be overshooting that service.
285
This approach will require calculation of the total ecosystem service supply and demand
286
at the selected ecological scale, and not just for the selected technological system(s).
287
How the allocation method can affect decisions is discussed in the next subsection.
288
3.5
Impact Assessment and Metrics
289
The basic results from TES will consist of pairs of numbers{Di,j,k, Si,j,k}representing demand, 290
D and supply, S for each techno-ecological system, i = 1, . . . , I, at each ecological scale, j =
291
1, . . . , J, for each ecosystem service, k = 1, . . . , K. Note that, as discussed in Section 3.1 and
292
shown in Table 1, the largest scale will depend on the type of ecosystem service. These demand
293
and supply numbers may be used to define sustainability metrics to compare alternatives, and
294
as objectives for designing sustainable systems.
295
Ecological sustainability. Sustainability of the i-th system at the j-th scale and for the
296
k-th ecosystem service may be defined as,
297
Vi,j,k=
Si,j,k−Di,j,k
Di,j,k
(1)
Negative ofVi,j,kmay be interpreted as representing ecological overshoot. A necessary, but not 298
sufficient condition for absolute sustainability may be written as,
299
Vi,J,k ≥0, ∀i,∀k (2)
Thus, for each ecosystem service, the demand cannot exceed the supply at the largest scale,
300
j=J. This condition is based on the common understanding that exceeding nature’s carrying
301
capacity is undesirable for sustainable development. This is a condition for absolute, as opposed
302
to relative sustainability because it is based on comparison with an absolute quantity, the
303
carrying capacity for thek-th ecosystem service [73]. In contrast, relative sustainability metrics
304
involve comparison with alternatives, and not with any absolute limits. Other characteristics of
305
these metrics are discussed near the end of this subsection.
306
The condition given by Equation 2 is not sufficient for sustainability since other factors
307
such as dynamics, complexity, social, and economic aspects also matter but are not captured
308
in the current framework. In addition, the “wicked” nature of sustainable development makes
309
it difficult to define a necessary and sufficient condition. If demand does exceed supply, that
310
is, ifVi,J,k <0 then it means that the ecosystem service is being used at a rate faster than its 311
rate of replenishment, and the human activity is exceeding nature’s regenerative capacity. Such
312
a situation usually results in symptoms such as depletion of ground water and fossil resources,
313
accumulation of CO2 in the atmosphere, or of nutrients in water bodies.
314
The criterion given by Equation 2 may also be applied at any scale. Thus, if
315
Vi,j,k≥0 (3)
then, it means that dependence on thek-th ecosystem service islocally sustainable at scalej. It
316
could happen that Equation 3 is satisfied, while Equation 2 is not. For example, a system may
317
emit less CO2 than can be sequestered by its surroundings to be locally sustainable, but the
318
electricity it buys from outside its boundary may emit more CO2than can be sequestered by the
319
ecosystems at the larger scale. Satisfaction of Equation 3 represents an “island of sustainability.”
320
As discussed in Section 3.6, TES metrics may encourage the development of such islands, and
321
ultimately satisfying Equation 2.
If the available ecosystem service in a single serviceshed is allocated between multiple users in
323
proportion to the demand created by each user for the selected service, as discussed in Section
324
3.4, then Equation 1 will result in identical values of Vi,j,k for all users. If allocation is in 325
proportion to quantities other than demand or if servicesheds overlap, then it could result in
326
different values ofVi,j,k at each scale,j. If allocation is avoided then the overshoot should be 327
calculated for scales including the largest scale. In this case, ifVi,j,k<0 then all activities that 328
rely on this ecosystem service at this or smaller scale are considered to be globally unsustainable.
329
Thus, according to this criterion, any activity that demands the water provisioning ecosystem
330
service by withdrawing water from the watershed is sustainable only if the total water withdrawal
331
by all activities in the watershed does not exceed the available renewable water.
332
In the proposed TES framework, it is important to prevent analyses that appear beneficial
333
by omitting critical ecosystem services because they are beyond the scale of the technical
sys-334
tem being considered or are not of interest to the system owner. For example, a decision about
335
replacing a natural area such as a wetland by a parking lot will have a negative impact on
336
ecosystem services such as flood regulation, pest regulation, or natural aesthetic beauty.
How-337
ever, since this technological activity does not demand these services,D= 0, the corresponding
338
value ofV will tend to infinity, even when the supply is reduced. This is a perverse result since
339
the negative impact of the decision on ecosystem services at larger scales may not be detected.
340
To prevent such outcomes, the notion of “materiality,” or “materially important” ecosystem
341
services must be included within TES.
342
Materiality is a foundational principle of financial accounting and recognizes that some
in-343
formation is important to the fair presentation of conditions and performance. Under US law,
344
materiality is information presenting a substantial likelihood that the disclosure of the omitted
345
fact would have been viewed by the reasonable individual as having significantly altered the
346
“total mix” of information made available [74]. As such, the range of ecosystem services,k, that
347
must be considered in TES should include any services that all stakeholders in an ecosystem
348
find important and relevant. For services that are material to a TES analysis, but at scales
349
larger than the scale of the system being assessed, this larger scale should be considered for
350
calculation of the metrics.
351
Aggregate Metrics. The metrics proposed so far provide a measure of ecological
sustain-352
ability for each ecosystem service at multiple scales. These metrics may be compared for multiple
353
products and the product with largerVi,j,kmay be preferred. However, the high dimensionality 354
of the sustainability metrics is likely to result in conflicts between ecosystem services making
355
it difficult to choose between alternatives. Such challenges are common in sustainability
anal-356
ysis, and various approaches for comparing systems in multiple dimensions have been explored
357
such as techniques for multi-criteria decision making. Methods may also be devised to reduce
358
dimensionality by using weights,wi,j,kthat represent the relative importance of each ecosystem 359
service. Then the aggregated overshoot at scale,j may be calculated as,
360
Vj =
X
i X
k
wi,j,kFk(Vi,j,k) (4)
where,Fk(Vi,j,k) could beFk(Vi,j,k) =Vi,j,k resulting in a linear weighted sum. Alternatively, 361
Fk(Vi,j,k) = H(Vi,j,k), where H represents a Heaviside or step function. The latter represen-362
tation could incorporate information about ecological thresholds in determining the Heaviside
363
function. These metrics at individual scales may be further aggregated by combining metrics at
364
all scales resulting in a single metric. Weights,wi,j,kmay require subjective input from individ-365
uals and society at large. Many recent efforts have focused on monetary valuation of ecosystem
366
services, and approaches to combine them into aggregated metrics, including notions such as
367
“shadow prices” [75, 76]. These efforts may be useful for determining the proposed weights for
368
aggregation.
369
Interpretation of Metrics. The proposed metrics quantify the gap between the supply
370
and demand of selected ecosystem services. Interpretation of the metrics and further steps will
371
be in the following two categories.
• If supply of ecosystem services is greater than its demand, Vi,j,k >0, then the selected 373
human activity is operating within nature’s carrying capacity, and as indicated by Equation
374
3, the system may be considered to be sustainable at the selected scale and ecosystem
375
services. This situation indicates strong sustainability since each ecosystem service is
376
considered separately. If onlyVj>0 but some individualVi,j,k<0, then it indicates weak 377
sustainability at the selected scale. In these cases, efforts may be directed at maintaining
378
this sustainable situation. As schemes for “payment for ecosystem services” are developed,
379
systems in this category may be able to benefit monetarily due to the “value addition”
380
that they provide to society at large.
381
• If supply is less than the demand,Vi,j,k<0 then thek-th ecosystem is unable to satisfy 382
the demand posed by technological systems. In this case, human activities are likely to
383
result in harm to society and the environment. This damage may be quantified with the
384
help of methods developed for assessing the environmental and human impact of pollution
385
and resource use by methods such as those in life cycle impact assessment [77] or for
386
monetization of damages due to pollution [78].
387
Despite the popularity of such aggregation schemes for ecosystem services and the ease of making
388
decisions with aggregate metrics, they should be used only when absolutely necessary, and
389
certainly not in a manner that the underlying physical information is lost or ignored. This is
390
because of known disadvantages of aggregation such as the assumption of substitutability and
391
the resulting weak sustainability criteria [79]. Monetary valuation of ecosystem services is also
392
not without its risks of providing perverse decisions [80]. A hierarchy of metrics may be defined
393
to get the best of disaggregate and aggregate quantities.
394
3.6
Improvement and Design
395
TES aims to encourage engineering and human activities to be within ecological constraints.
396
Satisfying this goal means making changes such thatVi,j,k≥0,∀{i, j, k}. This may be achieved 397
by enhancing technological efficiency to reduce the demand for ecosystem services, or by
restor-398
ing and protecting ecological systems to increase the supply of ecosystem services. This is an
399
important feature of TES as compared to other methods for assessing and designing sustainable
400
systems. Since these methods do not consider the supply of ecosystem services, their
improve-401
ment efforts are often limited to technological aspects. An equally important feature of TES is
402
the explicit recognition of the inherent interdependencies between technological and ecological
403
systems. Such recognition enables a better understanding of the resiliency of coupled
techno-404
ecological systems during any enhancement of technological efficiency or restoration of ecological
405
service provision.
406
The multiscale nature of TES presents improvement and design opportunities at each
spa-407
tial scale considered. Typically, changes are likely to be easiest at the smallest scale, such as a
408
manufacturing process. If there are emissions that cannot be absorbed or mitigated by
ecosys-409
tems, then it will be impossible forVi,j,k≥0 for some values ofi,j, andk. Examples include 410
processes that emit molecules that do not occur in nature such as chlorofluorocarbons, various
411
synthetic polymers, many pharmaceutical molecules, etc. For such molecules, the only way to
412
satisfy the TES objective ofVi,j,k≥0 is by technological changes. One approach is to treat such 413
molecules as “technological nutrients” and like biological nutrients, to recycle in technological
414
systems [35].
415
Nonrenewable resources will invariably result in values of Vi,j,k < 0. Therefore, seeking 416
TES will discourage their extraction and encourage their reuse and recycling by efforts such as
417
industrial symbiosis.
418
4
Illustrative Example
419
This section illustrates the type of results and insight that TES can provide by application to
420
a biodiesel manufacturing process. All the data needed for the TES analysis of this process
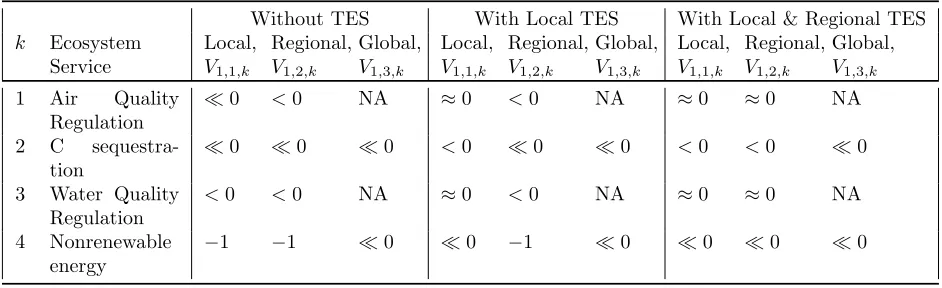
Table 2: TES at local and regional scales for conventional biodiesel manufacturing. Note that
V
i,j,kis bounded between -1 and
∞
and larger values are more desirable.
Without TES With Local TES With Local & Regional TES
k Ecosystem Service
Local,
V1,1,k
Regional,
V1,2,k
Global,
V1,3,k
Local,
V1,1,k
Regional,
V1,2,k
Global,
V1,3,k
Local,
V1,1,k
Regional,
V1,2,k
Global,
V1,3,k
1 Air Quality Regulation
≪0 <0 NA ≈0 <0 NA ≈0 ≈0 NA
2 C sequestra-tion
≪0 ≪0 ≪0 <0 ≪0 ≪0 <0 <0 ≪0
3 Water Quality Regulation
<0 <0 NA ≈0 <0 NA ≈0 ≈0 NA
4 Nonrenewable energy
−1 −1 ≪0 ≪0 −1 ≪0 ≪0 ≪0 ≪0
are not yet available, so this example is to illustrate some characteristics of TES and identify
422
research needs.
423
The problem considered is as follows. A biodiesel manufacturer is assessing its operation, and
424
would like to identify ways of making its manufacturing more sustainable. Existing engineering
425
methods can help make the process more efficient, and existing sustainable engineering methods
426
can account for broader impacts in the life cycle and help in reducing them. Such approaches
427
rely on indicators of relative sustainability, as discussed in Section 3.5, and focus on doing “less
428
bad.”
429
TES considers the same technological systems, along with the role of ecosystems at multiple
430
scales. At the smallest scale, TES considers only the biodiesel manufacturing process and
431
its surroundings. This technological system, T1,1 is considered to be within its immediate
432
surroundings of the manufacturing site, E1,1, which is within a region, E1,2, and the planet,
433
E1,3. For illustration purposes, we consider the ecosystem services of air quality regulation,
434
water quality regulation, carbon sequestration, and nonrenewable energy resources. Design
435
alternatives are considered at local and regional scales.
436
Without TES, all services are likely to be unsustainable at local, regional and global scales,
437
as indicated in the third to fifth columns of Table 2. Based on these results, the company may
438
start with local options for enhancing its sustainability. Enhancing technological efficiency is one
439
option to reduce the demand for ecosystem services. This “classical” solution, however, does not
440
leverage potential benefits of supporting ecosystems. The easiest TES option is for the company
441
to restore ecosystems on its own land and establish synergies between these ecosystems and the
442
manufacturing activities. In this situation, the results of TES are likely to show improvement
443
over the base case without TES, particularly at the local scale,j = 1, as shown in the sixth to
444
eighth columns of the Table 2. Relevant ecosystems in this case could be trees on the corporate
445
campus, which could take up emissions such as nitrogen and sulfur oxides, particulate matter,
446
and reduce ground level ozone formation. These trees could also replace some of the fossil
447
energy used in manufacturing by using wood as fuel. In addition, for water quality regulation,
448
a treatment wetland on the manufacturing site could treat the wastewater and produce water
449
that could be reused in the process. Also, the biomass from the wetland could be harvested
450
and used as fuel in the plant. These local changes may enable an island of sustainability at the
451
corporate scale but it may push impacts to larger scales.
452
After implementing local options, the company may consider a regional TES option, which
453
could involve investment in a regional nutrient cap-and-trade market, reducing the levels of
454
downstream pollutants by affecting agricultural runoff from upstream farmers. The company
455
can also consider purchase of carbon credits from voluntary markets such as California’s Carbon
456
Market, REDD+, as carbon sequestration supply is attributed to the company’s global direct
457
impact. For other services, such as air quality, TES would encourage collaborative consideration
of emission reductions within the “serviceshed,” which for this example encompasses the area
459
where air pollutants emitted to the atmosphere affect city-dwellers’ health. Metrics in the last
460
three columns indicate improvement at the regional scale. TES may be further extended to
461
include processes in the life cycle and to a hybrid life cycle model that includes national and
462
international flows. Encouraging such activities at multiple scales is a unique feature of TES
463
and goes well beyond the features of existing sustainable engineered methods.
464
5
Outlook
465
The framework of techno-ecological synergy expands the reach of sustainable engineering beyond
466
the current techno-centric approach by including the pivotal role of ecosystems. It can be applied
467
at multiple scales ranging from an individual process to the entire life cycle, and encourages
468
reduction of the impact of technological systems along with restoring the ability of ecosystems
469
to provide goods and services. Practical application of this framework requires use of models
470
and data from engineering, life cycle assessment, ecological modeling, geographical information
471
systems, and advances in other disciplines including policy, economics, and law. This presents
472
many opportunities for theoretical and applied research across disciplines.
473
Author Information
474
† BRB and GZ contributed equally to this paper. 475
Acknowledgments
476
Financial support for this work was provided by the National Science Foundation through grant
477
CBET-1336872.
478
References
479
[1] Dara O’Rourke. The science of sustainable supply chains. Science, 344(6188):1124–1127,
480
2014.
481
[2] World Business Council for Sustainable Development. Eco-efficiency: Creating more
482
value with less impact. http://www.wbcsd.org/web/publications/eco_efficiency_
483
creating_more_value.pdf, 2000.
484
[3] Carbon Trust. PAS 2050 : 2008 - Specification for the assessment of
485
the life cycle greenhouse gas emissions of goods and services. http:
486
//www.bsigroup.com/Standards-and-Publications/How-we-can-help-you/
487
Professional-Standards-Service/PAS-2050, 2008.
488
[4] A. Y. Hoekstra.The water footprint of modern consumer society. Routledge, London, UK.,
489
2013.
490
[5] Jeroen B. Guin´ee, editor. Handbook on Life Cycle Assessment: Operational Guide to the
491
ISO Standards. Springer, 2002.
492
[6] M. A. Curran, editor. Life Cycle Assessment Handbook. Scrivener, 2012.
493
[7] William McDonough and Michael Braungart. Cradle-to-cradle. North Point Press, 2002.
494
[8] R. Costanza, R. d’Arge R, R. de Groot, S. Farber, M. Grasso, B. Hannon, K. Limburg,
495
S. Naeem, R. V. O’Neill, J. Paruelo, R. G. Raskin, P. Sutton, and M. van den Belt. The
496
value of the world’s ecosystem services and natural capital. Nature, 387(6630):253–260,
497
1997.
[9] A. Balmford, A. Bruner, P. Cooper, R. Costanza, S. Farber, R. E. Green, M. Jenkins,
499
P. Jefferiss, V. Jessamy, J. Madden, K. Munro, N. Myers, S. Naeem, J. Paavola, M.
Ray-500
ment, S. Rosendo, J. Roughgarden, K. Trumper, and R. K. Turner. Economic reasons for
501
conserving wild nature. Science, 297(5583):950–953, 2002.
502
[10] MA.2005 Millennium Ecosystem Assessment (MEA) , Ecosystems and Human Well-being:
503
Synthesis,. Island Press, 2005. www.maweb.org, Accessed December 23, 2013.
504
[11] J. Rockstrom, W. Steffen, K. Noone1, A. Persson, F. S. Chapin, E. F. Lambin, T. M.
505
Lenton, M. Scheffer, C. Folke, H. J. Schellnhuber, B. Nykvist, C. A. de Wit, T. Hughes,
506
S. van der Leeuw, H. Rodhe, S. S¨orlin, P. K. Snyder, R. Costanza, U. Svedin, M.
Falken-507
mark, L. Karlberg, R. W. Corell, V. J. Fabry, J. Hansen, B. Walker, D. Liverman,
508
K. Richardson, P. Crutzen, and J. A. Foley. A safe operating space for humanity.
Na-509
ture, 461(7263):472–475, 2009.
510
[12] Thomas Koellner, Laura Baan, Tabea Beck, Miguel Brando, Barbara Civit, Mark
Goed-511
koop, Manuele Margni, LlorenMil Canals, Ruedi Mller-Wenk, Bo Weidema, and Bastian
512
Wittstock. Principles for life cycle inventories of land use on a global scale. The
Interna-513
tional Journal of Life Cycle Assessment, pages 1–13, 2012.
514
[13] Roland Geyer, David Stoms, and James Kallaos. Spatially-explicit life cycle assessment of
515
sun-to-wheels transportation pathways in the u.s. Environmental Science & Technology,
516
47(2):1170–1176, 2013.
517
[14] J. L. Hau and B. R. Bakshi. Expanding exergy analysis to account for ecosystem products
518
and services. Environmental Science & Technology, 38(13):3768–3777, 2004.
519
[15] H. T. Odum. Environmental Accounting: EMERGY and environmental decision making.
520
Wiley, 1996.
521
[16] Michael Borucke, David Moore, Gemma Cranston, Kyle Gracey, Katsunori Iha, Joy Larson,
522
Elias Lazarus, Juan Carlos Morales, Mathis Wackernagel, and Alessandro Galli. Accounting
523
for demand and supply of the biosphere’s regenerative capacity: The national footprint
524
accounts’ underlying methodology and framework. Ecological Indicators, 24(0):518 – 533,
525
2013.
526
[17] Benjamin Burkhard, Franziska Kroll, Stoyan Nedkov, and Felix M¨uller. Mapping ecosystem
527
service supply, demand and budgets. Ecological Indicators, 21(0):17 – 29, 2012. Challenges
528
of sustaining natural capital and ecosystem services Quantification, modelling &
val-529
uation/accounting.
530
[18] The Nature Conservancy and Dow Chemical Company. The Nature Conservancy
-531
Dow Collaboration: 2012 Progress Report. http://www.dow.com/sustainability/pdf/
532
2012-collaboration-report.pdf, 2013.
533
[19] D.J. Abson, H. von Wehrden, S. Baumg¨artner, J. Fischer, J. Hanspach, W. H¨ardtle,
534
H. Heinrichs, A.M. Klein, D.J. Lang, P. Martens, and D. Walmsley. Ecosystem services as
535
a boundary object for sustainability. Ecological Economics, 103(0):29 – 37, 2014.
536
[20] S. W. Peck and M. Kuhn. Design guidelines for green roofs. Ontario Association of
Archi-537
tects, 2003.
538
[21] G. A. Keoleian, J. E. Koch, and D. Menerey. Life cycle design framework and
demonstra-539
tion projects. Technical Report EPA/600/R-95/107, Environmental Protection Agency,
540
Cinicnnati, 1995.
541
[22] P. T. Anastas and J. B. Zimmerman. Peer reviewed: design through the 12 principles of
542
green engineering. Environmental science & technology, 37(5):94A–101A, 2003.
543
[23] C. Luttropp and J. Lagerstedt. Ecodesign and the ten golden rules: generic advice for
544
merging environmental aspects into product development. Journal of Cleaner Production,
545
14:1396–1408, 2006.
546
[24] M. D. Bovea and V. P´erez-Belis. A taxonomy of ecodesign tools for integrating
envi-547
ronmental requirements into the product design process. Journal of Cleaner Production,
548
20(1):61–71, 2012.
[25] T. E. Graedel and B. R. Allenby. Industrial ecology. Prentice Hall, 2003.
550
[26] Simapro. www.pre.nl.
551
[27] www.gabi-software.com.
552
[28] Y. Zhang, S. Singh, and B. R. Bakshi. Accounting for ecosystem services in life cycle
553
assessment, part I: A critical review. Environmental Science & Technology, 44(7):2232–
554
2242, 2010.
555
[29] Fridolin Krausmann, Karl-Heinz Erb, Simone Gingrich, Helmut Haberl, Alberte Bondeau,
556
Veronika Gaube, Christian Lauk, Christoph Plutzar, and Timothy D. Searchinger. Global
557
human appropriation of net primary production doubled in the 20th century. Proceedings
558
of the National Academy of Sciences, 2013.
559
[30] Y. Zhang, A. Baral, and B. R. Bakshi. Accounting for ecosystem services in life cycle
assess-560
ment, part II: Toward an ecologically based LCA. Environmental Science & Technology,
561
44(7):2624–2631, 2010.
562
[31] Shweta Singh and Bhavik R. Bakshi. Accounting for emissions and sinks from the
biogeo-563
chemical cycle of carbon in the u.s. economic input-output model. Journal of Industrial
564
Ecology, 18(6):818–828, 2014.
565
[32] S. Singh and B. R. Bakshi. Accounting for the biogeochemical cycle of nitrogen in
input-566
output life cycle assessment.Environmental Science & Technology, 47(16):9388–9396, 2013.
567
[33] Laura de Baan, Christopher L. Mutel, Michael Curran, Stefanie Hellweg, and Thomas
568
Koellner. Land use in life cycle assessment: Global characterization factors based on
569
regional and global potential species extinction. Environmental Science & Technology,
570
47(16):9281–9290, 2013.
571
[34] Thomas Koellner, Laura de Baan, Tabea Beck, Miguel Brand˜ao, Barbara Civit, Manuele
572
Margni, Lloren¸c Mila `a i Canals, Rosie Saad, DanielleMaia de Souza, and Ruedi M¨
uller-573
Wenk. Unep-setac guideline on global land use impact assessment on biodiversity and
574
ecosystem services in lca.The International Journal of Life Cycle Assessment, 18(6):1188–
575
1202, 2013.
576
[35] Michael Braungart, William McDonough, and Andrew Bollinger. Cradle-to-cradle design:
577
creating healthy emissions - a strategy for eco-effective product and system design.Journal
578
of Cleaner Production, 15(13-14):1337 – 1348, 2007.
579
[36] G. C. Daily, editor. Nature’s Services. Island Press, 1997.
580
[37] Natural Capital Project. Integrated valuation of environmental services and tradeoffs.
581
http://www.naturalcapitalproject.org/InVEST.html. accessed, February 2, 2013.
582
[38] Artificial intelligence for ecosystem services. ariesonline.org. accessed January 30, 2012.
583
[39] Roy Haines-Young and Marion Potschin. Proposal for a common international
classifica-584
tion of ecosystem goods and services (CICES) for integrated environmental and economic
585
accounting (v1). Technical report, European Environmental Agency, 2010.
586
[40] Rudolf S de Groot, Matthew A Wilson, and Roelof M.J Boumans. A typology for the
clas-587
sification, description and valuation of ecosystem functions, goods and services. Ecological
588
Economics, 41(3):393 – 408, 2002.
589
[41] Web-accessible materials on ecological valuation developed by or for the sab committee on
590
valuing the protection of ecological systems and services (c-vpess), 2008. Retrieved July 4,
591
2014.
592
[42] S. Comello, M. Lepech, and B. Schwegler. Project-level assessment of environmental impact:
593
Ecosystem services approach to sustainable management and development. Journal of
594
Management in Engineering, 28(1):5–12, 2012.
595
[43] Kenneth Arrow, Gretchen Daily, Partha Dasgupta, Simon Levin, Karl-G¨oran M aler, Eric
596
Maskin, David Starrett, Thomas Sterner, and Thomas Tietenberg. Managing ecosystem
597
resources. Environmental Science & Technology, 34(8):1401–1406, 2000.
[44] Richard T. Carson. Contingent valuation: A user’s guide. Environmental Science &
Tech-599
nology, 34(8):1413–1418, 2000.
600
[45] Rebecca L. Goldman, Barton H. Thompson, and Gretchen C. Daily. Institutional incentives
601
for managing the landscape: Inducing cooperation for the production of ecosystem services.
602
Ecological Economics, 64(2):333 – 343, 2007. Special Section - Ecosystem Services and
603
Agriculture Ecosystem Services and Agriculture.
604
[46] H. Scott Matthews and Lester B. Lave. Applications of environmental valuation for
deter-605
mining externality costs. Environmental Science & Technology, 34(8):1390–1395, 2000.
606
[47] S. Pagiola.How much is an ecosystem worth?: assessing the economic value of conservation.
607
World Bank Publications, 2005.
608
[48] Amy M. Villamagna, Paul L. Angermeier, and Elena M. Bennett. Capacity, pressure,
609
demand, and flow: A conceptual framework for analyzing ecosystem service provision and
610
delivery. Ecological Complexity, 15(0):114 – 121, 2013.
611
[49] A.P.E. Van Oudenhoven, K. Petz, R. Alkemade, L. Hein, and R.S De Groot. Framework for
612
systematic indicator selection to assess effects of land management on ecosystem services.
613
Ecological Indicators, 21:110–122, 2012.
614
[50] Alison G. Power. Ecosystem services and agriculture: tradeoffs and synergies.Philosophical
615
Transactions of the Royal Society B: Biological Sciences, 365(1554):2959–2971, 2010.
616
[51] Rogier P.O. Schulte, Rachel E. Creamer, Trevor Donnellan, Niall Farrelly, Reamonn Fealy,
617
Cathal O’Donoghue, and Daire O’hUallachain. Functional land management: A framework
618
for managing soil-based ecosystem services for the sustainable intensification of agriculture.
619
Environmental Science & Policy, 38(0):45 – 58, 2014.
620
[52] Charles J. V¨or¨osmarty, Pamela Green, Joseph Salisbury, and Richard B. Lammers. Global
621
water resources: Vulnerability from climate change and population growth. Science,
622
289(5477):284–288, 2000.
623
[53] L. Boithias, V. Acuna, L. Vergonos, G. Ziv, Marce R., and S. Sabater. Assessment of
624
the water supply:demand ratios in a mediterranean basin under different global change
625
scenarios and mitigation alternatives. Science of the Total Environment, 470:567–577,
626
2014.
627
[54] Nancy E. Bockstael, A. Myrick Freeman, Raymond J. Kopp, Paul R. Portney, and V. Kerry
628
Smith. On measuring economic values for nature. Environmental Science & Technology,
629
34(8):1384–1389, 2000.
630
[55] Sangwon Suh, Manfred Lenzen, Graham J. Treloar, Hiroki Hondo, Arpad Horvath, Gjalt
631
Huppes, Olivier Jolliet, Uwe Klann, Wolfram Krewitt, Yuichi Moriguchi, Jesper
Munks-632
gaard, and Gregory Norris. System boundary selection in life-cycle inventories using hybrid
633
approaches. Environmental Science & Technology, 38(3):657–664, 2004.
634
[56] Manfred Lenzen and Robert Crawford. The path exchange method for hybrid LCA.
Envi-635
ronmental Science & Technology, 43(21):8251–8256, 2009.
636
[57] R. A. Urban and B. R. Bakshi. Techno-ecological synergy as a path toward sustainability
637
of a North American residential system. Environmental Science & Technology, 47(4):1985–
638
1993, 2013.
639
[58] L.B. Lave, E. Cobas-Flores, C.T. Hendrickson, and F.C. McMichael. Using input-output
640
analysis to estimate economy-wide discharges.Environ. Sci. Technol., 29(9):420–426, 1995.
641
[59] N. U. Ukidwe and B. R. Bakshi. Thermodynamic accounting of ecosystem contribution to
642
economic sectors with application to 1992 US economy. Environmental Science &
Technol-643
ogy, 38(18):4810–4827, 2004.
644
[60] Swiss Centre for Life Cycle Inventories. Ecoinvent life cycle inventory database. www.
645
ecoinvent.ch. accessed January 18, 2013.
[61] Y. Yu, K. Hubacek, K. Feng, and D. Guan. Assessing regional and global water footprints
647
for the UK. Ecological Economics, 69:1140–1147, 2010.
648
[62] Edgar G. Hertwich and Glen P. Peters. Carbon footprint of nations: A global, trade-linked
649
analysis. Environmental Science & Technology, 43(16):6414–6420, 2009.
650
[63] M. Lenzen, D. Moran, K. Kanemoto, and A Geschke. Building EORA: A global
multi-651
region input-output database at high country and sector resolution. Economic Systems
652
Research, 25(1):20–49, 2013.
653
[64] i-Tree: Tools for assessing and managing community forests. accessed November 3, 2014.
654
[65] R. H. Kadlec and S. D. Wallace. Treatment Wetlands. CRC Press, second edition, 2009.
655
[66] Natural capital project. www.naturalcapitalproject.org. Accessed on February 10,
656
2012.
657
[67] Erik Nelson, Heather Sander, Peter Hawthorne, Marc Conte, Driss Ennaanay, Stacie Wolny,
658
Steven Manson, and Stephen Polasky. Projecting global land-use change and its effect on
659
ecosystem service provision and biodiversity with simple models. PLoS ONE, 5(12):e14327,
660
12 2010.
661
[68] UNEP/GRID-Arendal Maps and Graphics Library. Increased global water stress. http:
662
//maps.grida.no/go/graphic/increased-global-water-stress, 2009. accessed May
663
15, 2011.
664
[69] Julia St¨urck, Ate Poortinga, and Peter H. Verburg. Mapping ecosystem services: The
665
supply and demand of flood regulation services in europe. Ecological Indicators, 38(0):198
666
– 211, 2014.
667
[70] David J Nowak and Daniel E Crane. Carbon storage and sequestration by urban trees in
668
the USA. Environmental pollution, 116(3):381–9, January 2002.
669
[71] C.J.E. Schulp, S. Lautenbach, and P.H. Verburg. Quantifying and mapping ecosystem
670
services: Demand and supply of pollination in the european union. Ecological Indicators,
671
36(0):131 – 141, 2014.
672
[72] Trucost plc - taking the environment into account.http://www.trucost.com/what-we-do.
673
accessed July 4, 2014.
674
[73] N. Faber, R. Jorna, and Van Engelen J. The sustainability of ”sustainability” - a study
675
into the conceptual foundations of the notion of ”sustainability”. Journal of Environmental
676
Assessment Policy and Management, 7(1):1–33, 2005.
677
[74] TSC Industries vs. Northway, Inc. http://supreme.justia.com/cases/federal/us/
678
426/438/, 1976. 426 U.S. 438.
679
[75] Kenneth J. Arrow, Partha Dasgupta, Lawrence H. Goulder, Kevin J. Mumford, and Kirsten
680
Oleson. Sustainability and the measurement of wealth. Environment and Development
681
Economics, 17:317–353, 6 2012.
682
[76] Geoffrey Heal. Valuing ecosystem services. Ecosystems, 3(1):24–30, 2000.
683
[77] Jane C Bare, Patrick Hofstetter, David W Pennington, and Helias A Udo Haes. Midpoints
684
versus endpoints: The sacrifices and benefits. The International Journal of Life Cycle
685
Assessment, 5(6):319–326, 2000.
686
[78] Nicholas Z. Muller, Robert Mendelsohn, and William Nordhaus. Environmental accounting
687
for pollution in the United States economy. American Economic Review, 101:1649–1675,
688
2011.
689
[79] B. R. Bakshi, A. Baral, and J. L. Hau. Thermodynamic methods for resource accounting.
690
In B. R. Bakshi, T. G. Gutowski, and D. P. Sekulic, editors, Thermodynamics and the
691
Destruction of Resources. Cambridge University Press, 2011.
692
[80] Kent H. Redford and William M. Adams. Payment for ecosystem services and the challenge
693
of saving nature. Conservation Biology, 23(4):785–787, 2009.