This is a repository copy of Government debt dynamics and the global financial crisis: Has anything changed in the EA12?.
White Rose Research Online URL for this paper: http://eprints.whiterose.ac.uk/82773/
Version: Accepted Version
Article:
Cuestas, J.C., Gil-Alana, L.A. and Staehr, K. (2014) Government debt dynamics and the global financial crisis: Has anything changed in the EA12? Economics Letters, 124. 64 - 66. ISSN 1873-7374
https://doi.org/10.1016/j.econlet.2014.04.014
eprints@whiterose.ac.uk https://eprints.whiterose.ac.uk/
Reuse
Unless indicated otherwise, fulltext items are protected by copyright with all rights reserved. The copyright exception in section 29 of the Copyright, Designs and Patents Act 1988 allows the making of a single copy solely for the purpose of non-commercial research or private study within the limits of fair dealing. The publisher or other rights-holder may allow further reproduction and re-use of this version - refer to the White Rose Research Online record for this item. Where records identify the publisher as the copyright holder, users can verify any specific terms of use on the publisher’s website.
Takedown
If you consider content in White Rose Research Online to be in breach of UK law, please notify us by
Government debt dynamics and the global financial crisis:
Has anything changed in the EA12?
Juan Carlos Cuestas*
University of Sheffield, United Kingdom
Luis A. Gil-Alana
University of Navarra, Spain
Karsten Staehr
Tallinn University of Technology, Estonia Eesti Pank, Estonia
Abstract: This paper seeks to shed light on possible changes in the government debt
dynamics for the first 12 euro area countries. Structural breaks are present around the global financial crisis for most countries, but not for Germany and France, the two core countries in the euro area. The properties of the government debt dynamics differ markedly across the countries receiving bailouts.
J.E.L. Classification: C2, H3
Key words: Structural breaks, debt stock, EU.
*
1. Introduction
The global financial crisis that broke in 2008 had a profound impact on Europe, where governments in many countries encountered debt financing problems. The background to the financial and debt crises and the subsequent policy responses are the subjects of on-going research (van Riet, 2010; Lane, 2012).
This note analyses the dynamics of government debt from 2000 to 2013 in the 12 countries that have been part of the euro area since 2001 (EA12). The empirical analysis comprises a number of tests to ascertain whether innovations in the debt stock are persistent or are gradually reversed in the sample period. The tests examine whether there is counteracting feedback from the lagged debt stock to the fiscal stance which prevents the debt stock from growing without limit. The persistence of the government debt stock will inter alia be determined by the overall fiscal policy configuration.
Tests of the time series properties of the debt stock are sometimes interpreted as tests of
“fiscal sustainability”, where fiscal sustainability is defined as when the transversality condition is satisfied, i.e. the discounted value of the outstanding debt is non-positive. Stationarity of the debt stock is a sufficient condition but only with a number of assumptions, including the behaviour of the real interest rate (Hamilton and Flavin, 1986). Bohn (2008)
argues for this reason that tests of the time series properties are tests of “ad-hoc sustainability” and prefers instead tests based on fiscal reaction functions where the primary balance is regressed on the lagged debt stock and various control variables. Testing of the statistical significance of the coefficient of the lagged debt stock is complicated if the debt stock exhibits a unit root and the primary balance is stationary. Other tests associate sustainability with cointegration between government revenues and spending or between the debt stock and the primary balance (Bohn 2008).
All tests of fiscal sustainability suffer, however, from two fundamental weaknesses (Bohn 1995, 2008). First, they rely on historical data, while sustainability is a forward-looking concept where the transversality condition at least conceptually imposes conditions infinitely into the future. Second, debt financing crises typically imply that real interest rates increase markedly and abruptly. It is not possible to model such fluctuations in the real interest rate within a standard model of intertemporal sustainability and the tests discussed above therefore have only very limited explanatory power vis-à-vis government financing crises.
Several studies ascertain the dynamics of government debt in European countries before the crisis (see Greiner et al., 2007, amongst many others). A few recent studies, including Cuestas and Staehr (2013) and Baldi and Staehr (2012), consider the effects of the crisis on fiscal variables, but have not considered the debt dynamics for individual countries. The contribution of the note is the application of tests for each EA12 country’s debt stock separately, the endogenous determination of structural breaks and the use of tests allowing for fractional integration.
2. Method and results
To test for the degree of persistence of shocks we use two methodologies; Bai and Perron (2003) and Gil-Alana (2008).
Bai and Perron (2003) method allows us to test for the existence of breaks in the parameters, to determine the dates of the breaks and to estimate pre- and post-breaks parameters. In our framework, we estimate the relationship,
t t b t b b b b b t y T t I y T t I T t tI T t tI T t I T t I y
1 2 1
1 2 1 2 1 ) ( ) ( ) ( ) ( ) ( ) ( (1)
where I(.) is the indicator function, 1 and 2 are the drift parameters before and after the break Tb, 1 and 2 the trend parameters before and after the break, and 1 and 2 the
autoregressive parameters before and after the breaks. Bai and Perron (2003) suggest minimising the residual sum of squares (RSS) in equation (1).
To attain additional flexibility and robustness in the analysis, we also apply fractional integration techniques, for the possibility of non-integer orders of integration, while allowing for endogenous structural breaks. We use an approach developed by Gil-Alana (2008) under the assumption that the error term is white noise. This implies estimating the following equations, b t d d t d T t u t L L y
L) (1 ) (1 ) , 1,...,
1
( 1 1 1
1
1
(2) T T t u t L L y
L)d t (1 )d (1 )d t, b 1,..., 1
( 2 2 2
2
2
, (3)
where d1 and d2 are fractional differencing parameters before and after the break. The
deterministic components are multiplied by (1L)di, which is a simple reparameterisation;
there is a constant and a trend in the model. The time of the break Tb is obtained by means of
grid searches seeking to minimise the residual sum of squares from (2) and (3) for the full sample length (see Gil-Alana, 2008, for full details).
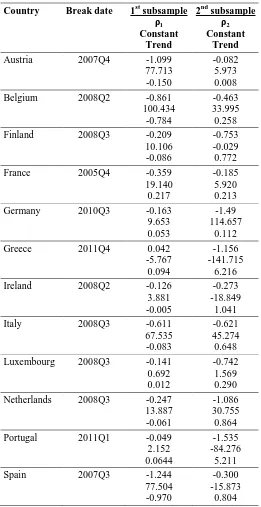
The results of the application of the Bai and Perron (2003) method are displayed in Table 1. We have restricted the maximum number of breaks to one to avoid estimating an excessive number of parameters; in all cases we reject the condition that there is not any break (results available upon request). The break occurs in most cases at the time of the outbreak of the global financial crisis or shortly afterwards. There are some interesting exceptions. The break came several years before the crisis in France, but approximately two years after in Germany.1 These results are consistent with the fact that Germany and France as the core countries of the euro area were among the countries that weathered the global financial crisis best. For Greece the break is estimated to take place in 2011Q4; this is the quarter in which the debt fell markedly after a debt write-down following the second support package for Greece. Finally, the break for Portugal also occurs late; the country also started its budget consolidation rather late.
1 If two breaks were allowed, the second break for France would actually be around the time of the global
Table 1:Unit roots with structural break
Country Break date 1st subsample
1
Constant Trend
2nd subsample
2
Constant Trend
Austria 2007Q4 -1.099
77.713 -0.150
-0.082 5.973 0.008
Belgium 2008Q2 -0.861
100.434 -0.784
-0.463 33.995 0.258
Finland 2008Q3 -0.209
10.106 -0.086
-0.753 -0.029 0.772
France 2005Q4 -0.359
19.140 0.217
-0.185 5.920 0.213
Germany 2010Q3 -0.163
9.653 0.053
-1.49 114.657
0.112
Greece 2011Q4 0.042
-5.767 0.094
-1.156 -141.715
6.216
Ireland 2008Q2 -0.126
3.881 -0.005
-0.273 -18.849
1.041
Italy 2008Q3 -0.611
67.535 -0.083
-0.621 45.274 0.648
Luxembourg 2008Q3 -0.141
0.692 0.012
-0.742 1.569 0.290
Netherlands 2008Q3 -0.247 13.887 -0.061
-1.086 30.755 0.864
Portugal 2011Q1 -0.049
2.152 0.0644
-1.535 -84.276
5.211
Spain 2007Q3 -1.244
77.504 -0.970
-0.300 -15.873
0.804
Note: Bai and Perron (2003) method with at most one structural break. The table reports the autoregressive parameters, the constants and the trends for the two subsamples.
Table 2 shows the results of the fractional integration test when at most one break is allowed. There are many similarities with the results in Table 1, but also some differences. The most noticeable result of the fractional integration tests is that no structural break is detected for Germany and France. This is consistent with the results in Table 1, which also suggested that the global financial crisis had little effect on the debt dynamics in these core countries of the euro area. In all other cases, the break is situated around the outbreak of the global financial crisis. Another result found in both analyses is that whereas the persistence appears to have fallen in Greece, the opposite is the case in Spain. The persistence results for Portugal differ across the two methods, but this may be attributable to the different timing of the structural break.
Table 2: Fractional integrationincluding breaks
Country Break date 1st subsample d1 (95% interval)
2nd subsample d2 (95% interval)
Austria 2007Q3 0.59 (0.31, 1.26) 1.43 (0.84, 2.24)
Belgium 2007Q4 0.41 (0.20, 0.75) 1.27 (0.96, 1.82) Finland 2008Q2 0.99 (0.77, 1.31) 0.61 (0.24, 0.99)
France --- 1.49 (1.34, 1.73)
Germany --- 1.13 (0.94, 1.40)
Greece 2008Q2 1.07 (0.85, 1.39) 0.44 (0.09, 0.92)
Ireland 2007Q3 1.09 (0.79, 1.56) 0.82 (0.61, 1.11)
Italy 2008Q2 0.69 (0.41, 1.03) 1.30 (1.02, 1.59)
Luxembourg 2008Q3 0.86 (0.65, 1.21) 0.24 (-0.41, 1.08)
Netherlands 2008Q3 1.08 (0.89, 1.30) 0.94 (0.68, 1.33)
Portugal 2008Q1 1.17 (0.95, 1.44) 0.44 (0.14, 0.98)
Spain 2008Q1 -0.23 (-0.57 0.46) 1.14 (0.73, 1.77)
Note: Gil-Alana (2008) method. In bold, evidence of reversion to trend (di < 1)
3. Conclusions
References
Antonini, M., K. Lee and J. Pires (2013): “Public sector debt dynamics: the persistence and sources of shocks to debt in 10 EU countries”, Journal of Money, Credit and Banking, vol. 45, pp. 277-298.
Bai, J. and P. Perron (2003): “Computation and analysis of multiple structural change
models”, Journal of Applied Econometrics, vol. 18, pp. 1-22.
Baldi, G. and K. Staehr (2013): “The European debt crisis and fiscal reaction functions in
Europe 1999-2012”, DIW Berlin Discussion Papers, no. 1295.
Bohn, H. (1995): “The sustainability of budget deficits in a stochastic economy”, Journal of Money, Credit, and Banking, vol. 27, pp. 257-271.
Bohn, H. (2008): “The sustainability of fiscal policy in the United States”, in R. Neck and J.
Sturm (eds.): Sustainability of Public Debt, MIT Press, pp. 15-49.
Cuestas, J. C. and K. Staehr (2013): “Fiscal shocks and budget balance persistence in the EU countries from Central and Eastern Europe”, Applied Economics, vol. 45, pp. 3211-3219. Gil-Alana, L. A. (2008): “Fractional integration and structural breaks at unknown periods of
time”, Journal of Time Series Analysis, vol. 29, pp. 163-85.
Greiner, A., U. Köller and W. Semmler (2007): “Debt sustainability in the European
Monetary Union: theory and empirical evidence for selected countries”, Oxford Economic Papers, vol. 59, pp. 194-218.
Hamilton, J. and M. Flavin (1986): “On the limitations of government borrowing: a framework for empirical testing”, American Economic Review, vol. 76, pp. 808-816.
Lane, P. R. (2012): “The European sovereign debt crisis”, Journal of Economic Perspectives, vol. 26, pp. 49-68.
van Riet, A. (ed., 2010): “Euro area fiscal policies and the crisis”, Occasional Paper Series,