A Global Perspective on
Coal-Fired Power Plants, Climate
Change and Disease Burden
The Harvard community has made this
article openly available.
Please share
how
this access benefits you. Your story matters
Citable link http://nrs.harvard.edu/urn-3:HUL.InstRepos:37945611
Terms of Use This article was downloaded from Harvard University’s DASH
repository, and is made available under the terms and conditions applicable to Other Posted Material, as set forth at http://
A GLOBAL PERSPECTIVE ON COAL-FIRED POWER PLANTS, CLIMATE CHANGE
AND DISEASE BURDEN
CHENG-KUAN LIN
A Dissertation Submitted to the Faculty of The Harvard T.H. Chan School of Public Health
in Partial Fulfillment of the Requirements for the Degree of Doctor of Science in the Department of Environmental Health
Harvard University Boston, Massachusetts.
i
Dissertation advisor: David C. Christiani Cheng-Kuan Lin
A Global Perspective On Coal-Fired Power Plants, Climate Change And Disease Burden
Abstract
This dissertation investigates the disease burden from coal-fired power plants from global perspective. First, the study estimated changes in national lung cancer incidence decades after building or closing coal-fired power plants. The study secondly estimated the relative risks and incident cases of cardiovascular diseases (CVD), particularly ischemic heart disease (IHD), attributable to sulfate oxide (SOx) emission from coal-fired power plants from a global perspective. Since China is one of the most greenhouse gas (GHG) emitting country, we proposed “flying S”
pattern to examine and forecast carbon dioxide (CO2) emission in the next decades.
For the chapter one, standardized lung cancer incidence from every country with electrical plants using coal as primary energy supply were followed from 2000 to 2016. We applied a Poisson regression longitudinal model to estimate the association between lung cancer incidence and per capita coal capacity. We fund that with 1 kilowatts (KW) increase of coal capacity per person in a country, the relative risk of lung cancer increase by a factor of 85.1% (95%CI=1.217~2.816) among males and 58.5% (95%CI=1.070~2.347) among females. Based on the model, we estimate a total of 1.41 million standardized incident cases from lung cancer were associated with coal-fired power plants in 2015.
ii
emission was associated with 0.28% (males; 95%CI=-0.39%~0.95%) and 1.69% (females; 95%CI=0.99%~2.38%) lower CVD risk. The effects on IHD were >2 times stronger among males than females (2.78%, 95%CI=1.99%~3.57% vs. 1.18%, 95%CI=0.19%~2.17%). Further, 1.43% (males) and 8.00% (females) of CVD cases were attributable to suboptimal SOx reduction. Thus, enhancing regulations on SOx emission control represents a target for national and international intervention to prevent CVD.
iii
Table of Contents
Abstract ... i
List of Figures with Captions ... v
List of Tables with Captions ... vi
Acknowledgements ... viii
Introduction ... 1
Chapter 1. A Global Perspective on Coal-fired Power Plants and Burden of Lung Cancer ... 3
1.1 Introduction ... 3
1.2 Methods ... 4
1.2.1 Study period and design ... 4
1.2.2 Dependent variables & independent variables ... 4
1.2.3 Data analysis ... 6
1.2.4 Falsification test ... 7
1.2.5 Burden of diseases analysis ... 7
1.3 Results ... 8
1.4 Discussion ... 16
1.5 Study Limitations ... 18
1.6 Conclusion ... 19
1.7 References ... 20
1.8 Supplementary material ... 23
Chapter 2. Sulfur Oxide Controls in Coal-Fired Power Plants and Cardiovascular Disease ... 27
2.1 Introduction ... 27
2.2 Methods ... 28
2.2.1 Data source ... 28
2.2.2 Data analysis ... 30
2.2.3 Additional analysis and falsification test ... 31
iv
2.4 Discussion ... 45
2.5 Conclusion ... 48
2.6 References: ... 49
2.7 Supplementary Material ... 53
Supplementary Figure 2.1. Distribution of national reduction in sulfur oxide (SOx) emissions ... 53
Chapter 3. Are Per Capita Carbon Emissions Predictable Across Countries? ... 61
3.1 Introduction ... 61
3.2 Methods ... 63
3.2.1 Study period and data extraction ... 63
3.2.2 Assumptions check... 64
3.2.3 Analytic model ... 64
3.3 Results ... 65
3.4 Discussion ... 74
3.5 Limitations ... 74
3.6 Conclusions ... 75
3.7 References ... 76
3.8 Supplementary materials ... 78
3.8.1 Appendix 1 Bottom-up calculation of CO2 emission in China ... 78
3.8.2 Appendix 2 Sectoral classification in China and Taiwan ... 81
v List of Figures with Captions
Figure 1.1 National coal capacity* in 2000, 2005, 2010 and 2015 ... 9 Figure 1.2 Incidence rates of lung cancer vs. coal capacity in 2000, 2005, 2010 and 2015 among males ... 12 Figure 1.3 National incidence rates of lung cancer vs. coal capacity in 2000, 2005, 2010 and 2015 among females ... 13 Supplementary Figure 1.1 Annual coal capacity, coal capacity, log coal capacity and coal
percentage of countries with the 5 highest coal capacities ... 26 Figure 2.1 Total coal capacity (upper panel) and national SOx reduction by country (lower panel) in 2012 ... 34 Figure 2.2 The IHD incidence cases attributable to suboptimal SOx emission control in studied countries among males (upper panel) and females (lower panel) in 2012 ... 43 Figure 3.1. CO2 emission per capita in Japan, Taiwan and China, 1960~2015 ... 68 Figure 3.3. Historical and predicted per capita CO2 emission in selected countries, 1960-2040 73 Supplementary figure 3.1 CO2 emission per capita in East Asia flying geese group countries, 1960~2015 ... 82 Supplementary figure 3.2. Per capita CO2 vs. per capita nominal GDP among 6 selected
vi List of Tables with Captions
Table 1.1 Basic characteristics of analyzed countries across years ... 10 Table 1.2 Relative risk (RR) and 95% confidence intervals (CIs) of the increase in lung cancer incidence with change in coal capacity, adjusted for different variables in different models among males and females. ... 15 Supplementary Table 1.1 Countries included in the analysis, by geographical region a (N = 83)23 Supplementary Table 1.2 Relative risk (RR) and 95% confidence intervals (CIs) of the increase in colorectal cancer with change in coal capacity, adjusted for different variables in different models among males and females... 25 Supplementary Table 1.3 Estimated population attributable factors (2015, 2025) and
vii
Table 3.1 Mean, standard deviation (SD) and ratio of three major brown energy production & consumption in selected countries ... 66 Table 3.2 Summary of country-specific parameters and predicted emissions of 6 selected
viii Acknowledgements
Firstly, I would like to express my sincere gratitude to my advisor Professor David C. Christiani for the continuous support of my doctoral study and related research, for his patience, motivation, and immense knowledge. His guidance helped me in all the time of research and writing of this dissertation. I could not have imagined having a better advisor and mentor for my doctoral study.
Besides my advisor, I would like to thank the rest of my dissertation research committee: Dr. Corwin Zigler and Dr. Nathalie De Marcellis for their insightful comments and encouragement, but also for the hard question which incented me to widen my research from various perspectives.
1 Introduction
Climate change is one of the most important environmental issues globally. Overwhelming
majority of countries has devoted great efforts to curb greenhouse gas (GHG) but still way beyond
being called effective. The impacts of climate change are wide but understudied. Coal-fired power
plants, is one of the most important contributor of both GHG emission and PM2.5 emission. As
many scholars believed health is a crucial driver for climate policy, and frame the problem as
shutting down coal-fired power plants provides “co-benefit” of health outcomes from carbon
dioxide (CO2) emission control.
From disease-specific angle of point, some non-communicable diseases are strongly
associated to PM2.5, such as lung cancer, and/or cardiovascular diseases. However, the diseases
burden specifically associated with coal-fired power plant from global scale remains unknown.
Chapter 1 investigates coal-fired power plants and burden of lung cancer and chapter 2 discusses
sulfur oxide controls in coal-fired power plants and CVD.
China, as the top CO2 emitting country, contributed almost 30% CO2 emission globally.
China set up its Intergovernmental Panel on Climate Change (IPCC) goal that its emission will
peak before 2030 and its energy intensity (CO2/GDP) will be 60% of 2015 level. Chapter 3
proposes a novel “flying S” hypothesis and forecast China’s CO2 emission up to 2050 by
examining the ex post data.
The dissertation aims to provide scientific evidences of “co-benefit” of health outcomes
by controlling the most important CO2 emitting contributor from global perspective. We further
turn the scope to East Asia and focus on newly developing countries as they are top GHG emitting
2
scientific data to support public health implication of changing climate. International bodies should
3
Chapter 1. A Global Perspective on Coal-fired Power Plants and Burden of Lung Cancer
1.1 Introduction
Coal-fired power plants are the dominant source of energy production, yielding >40% of global electrical power since the 1970s (International Energy Agency 2017). Indeed, global production of coal increased nearly 2.2-fold from 1,958 million tons of oil equivalent (Mtoe) in 1980 to 4,270 Mtoe in 2010 (International Energy Agency 2017). However, air pollutants emitted from coal power plants and their potential impact on population health have aroused widespread concerns; fine particulate matter (PM2.5) can cause both short-term and long-term adverse health outcomes (Cui et al. 2015; Dockery et al. 1993). Long-term exposure to PM2.5 is associated with shorter life expectancy and higher mortality risks from lung cancer-related cardiopulmonary diseases (Miller et al. 2007; Pope et al. 2002; Pope et al. 2009). In fact, the International Agency for Research on Cancer (IARC) has listed several coal-fired power plant-related agents, including coal combustion, coal production, outdoor air pollution, and radon, as human carcinogens(International Agency for Research on Cancer (IARC) 2016). While lung cancer is prevalent, the proportion of cases attributed to environmental factors such as air pollution varies by country and is difficult to estimate(Global Burden of Disease Collaborative Network 2016). Nonetheless, improved air quality has been correlated to better health(Jerrett et al. 2005), prompting many countries to implement regulations on air pollution(US supreme Court 2001).
4
to regional variations in composition (Harrison and Yin 2000; William M. Hodan). For example, satellite-driven PM2.5 measurement showed a high level of air pollution concentrated in sub-Saharan Africa(National Aeronautics and Space Administration 2010). Yet, a major component of that PM was dust from the earth's crust rather than from human activities. Therefore, simply using PM to estimate health effects may result in misguided conclusions.
To clarify the long-term health effects from coal-fired power plants at the national level, and linking the capacity market in energy economic to health externality, we aim to estimate changes in national lung cancer incidence decades after building or closing coal-fired power plants.
1.2 Methods
1.2.1 Study period and design
Annual lung cancer incidence rates from 2000 to 2016 among males and females from countries which have had coal-fired power plants were included in the analyses. Most countries in the study are located in Europe (38.55%) and Asia (27.71%) (Supplementary Table 1). Country names and geographical categories reflect the United Nations’ country classification(United Nations Statistics Division).
1.2.2 Dependent variables & independent variables
5
“independentvariables” and “covariates” interchangeably throughout.
Electrical capacity of power plants that primarily relied on coal as generating fuel was the study of interest. Coal capacity was defined as the annual accumulation of generating capacity from every coal-fired power plant in a given country. Similarly, we define plant capacity as the accumulation of total generating capacity from all power plants in a country. Non-coal capacity was plant capacity minus coal capacity. Coal percentage was defined as the ratio of coal capacity to plant capacity for each country. Per capita coal capacity is the coal capacity divided by total population in the corresponding country. Total coal consumption is the annual coal usage in all sectors (including electricity, industrial and residential use, units in Quadrillion Btu) in a given country(US Energy Information Administration 2015). Capacity data was derived from the Utility Data Institute World Electric Power Plants Data Base (UDI World Electric Power Plants Database (WEPP) 2016); we merged the WEPP database with incidence data by country and year. After matching, a total of 83 countries were included in the study.
6
supplementary sources(Groningen Growth and Development Centre Faculty of Economics and Business 2016; National Statistics Taiwan 2016).
1.2.3 Data analysis
The longitudinal model for which we predict lung cancer incidence is the following Poisson regression:
log 𝐸[𝜆𝑖𝑡|𝑿𝒊𝒕] = β0+ β1[Per capita Coal Capacity]i(t−T)+ β2[Smoking Prevalence]i(t−10) +β3[Non Coal Capacity]i(t−10)+ β4[Traffic Index]i(t−10)
+β5[Industrialization Index]i(t−10)+ β6[Per capita GDP (PPP)]it +β7[Total Coal Cunsumption]i(t−10)
where index 𝑖 denotes the country, 𝑡 denotes the year, and 𝑇 is the believed lag of per capita coal capacity before affecting the current lung cancer incidence rate 𝜆𝑖𝑡. For completeness, we consider three lags at 𝑇 = 5, 10, 15 years for coal capacity and assume an adequate lag of 10 year for smoking(Ezzati and Lopez 2003) and other covariates, except for per capita GDP.
The model stated above is a marginal model; specifically, we are not concerned with how the effect varies across individual countries, but rather with the “overall” effect averaged over all countries. We must, however, account for this within-country variation across the years, for which generalized estimating equations (GEE)(Zeger 1986) is perfectly suited to handle. GEE’s strengths lie in its semiparametric
properties; it produces unbiased estimates for the beta coefficients, regardless of the within-country correlation structure specified, although a specification closer to the truth leads to lower standard errors.
7
1.2.4 Falsification test
To investigate the possibility that general health improvements correlated with coal capacity may obscure our lung-cancer results, we identify colorectal and anal cancer (CRC) as falsification outcomes (possible markers for general cancer trends that are not expected to be correlated with air pollution). CRC was coded as B093, B094, 153 or 154 in ICD-9; and C18, C19, C20, C21, and 1030 in ICD-10(Global Burden of Disease Collaborative Network 2016). We applied the same models to CRC to examine any association with coal capacity.
1.2.5 Burden of diseases analysis
We estimate the population attributable factor (PAF) of lung cancer to coal-fired power plants in 2015 and predict the PAF in 2025 among studied countries. The PAF is the proportion of lung cancer incidence attributable to anthropogenic coal capacity. Detailed step-by-step calculations are summarized in the GBD study(Global Burden of Disease Collaborative Network 2016) and our previous work(Lee et al. 2016). Briefly, to calculate 𝑃𝐴𝐹𝑖𝑡, the PAF for country 𝑖 in year 𝑡, we need the quantity 𝑅𝑅𝑖𝑡, the relative risk of lung cancer incidence given coal capacity at year 𝑡 − 10, holding all other covariates, including smoking, fixed. This can be deduced immediately from our data analysis portion using the relationship
𝑅𝑅𝑖𝑡 = 𝑅𝑅0Per capita coal capacityi(t−10)
𝑃𝐴𝐹𝑖𝑡 =
𝑃𝑖𝑡−10× (𝑅𝑅𝑖𝑡− 1) 1 + 𝑃𝑖𝑡−10× (𝑅𝑅𝑖𝑡− 1)
8
proportion of males or females. 𝑃𝐴𝐹𝑖𝑡 is useful, because we can then calculate the standardized attributable cases:
Standardized attributable cases𝑖𝑡 = PAF𝑖𝑡× Population𝑖𝑡× standardized incidence rate𝑖𝑡
Supplementary Table 3 shows the PAFs in 2015 and 2025 and the standardized attributable cases for countries using coal as power generation in 2015.
1.3 Results
9
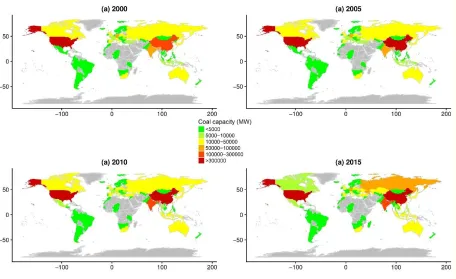
Figure 1.1 National coal capacity* in 2000, 2005, 2010 and 2015
10
Table 1.1 Basic characteristics of analyzed countries across years
Year 2000~2004 2005~2010 2011~2016
Mean (95%CI) Mean (95%CI) Mean (95%CI)
Lung cancer incidence a
Males 454.07 (428.81~479.34) 434.87 (410.95~458.78) 408.39 (389.82~426.95)
Females 143.50 (133.16~153.83) 151.10 (140.06~162.13) 154.86 (145.37~164.35)
Coal capacity b 15987.86 (10836.73~21138.99) 19331.72 (12134.39~26529.05) 22821.17 (14725.02~30917.31)
Smoking prevalence c
Males 32.23 (31.16~33.3) 30.09 (29.02~31.15) 29.23 (27.87~30.58)
Females 13.13 (12.17~14.1) 12.33 (11.4~13.26) 11.72 (10.57~12.87)
Traffic index c 27.76 (26.3~29.23) 28.32 (26.96~29.69) 29.91 (28.47~31.36)
Industrialization index c 17.65 (16.77~18.54) 17.23 (16.34~18.13) 16.39 (15.51~17.28)
GDP (PPP) d 742.85 (573.38~912.31) 910.6 (705.71~1115.49) 1113.37 (891.63~1335.1)
Total coal consumption e 1.24 (0.82~1.66) 1.53 (0.93~2.14) 1.75 (0.77~2.73)
Population f
Males 326.71 (235.21~418.21) 345.06 (248.65~441.46) 367.16 (281.07~453.26)
Females 321.77 (235.49~408.05) 339.36 (248.68~430.03) 360.74 (279.91~441.57)
95%CI: 95% confidence interval; GDP (PPP): gross domestic product adjusted by (Purchasing Power Parity)
11
c Unit: %
d Unit: Billion 2011 USD
12
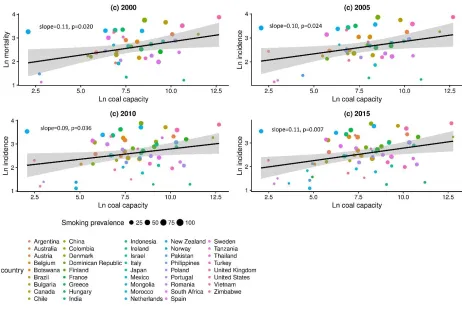
Figures 2 (males) and Figure 3 (females) show the relationship between 10-year-lag log coal capacity and log incidence rates of lung cancer in 2000, 2005, 2010 and 2015.Among both sexes, coal capacity was significantly positively correlated with lung cancer incidence rate (male, slopes = 0.10 to 0.13, all p-values < 0.05; females, slopes = 0.09 to 0.11, all p-values <0.05).
Figure 1.2 Incidence rates of lung cancer vs. coal capacity in 2000, 2005, 2010 and 2015
among males
[image:22.612.77.537.195.504.2]13
Figure 1.3 National incidence rates of lung cancer vs. coal capacity in 2000, 2005, 2010 and
2015 among females
Legend: y axis: ln(lung cancer incidence rate), unit: ln(case/100 thousands); x axis: ln(coal capacity), unit: ln(MW); smoking prevalence: unit: %
14
15
Table 1.2 Relative risk (RR) and 95% confidence intervals (CIs) of the increase in lung cancer incidence with change in coal
capacity, adjusted for different variables in different models among males and females.
RR: relative risk; 95%CI: 95% confidence interval; GDP (PPP): gross domestic product adjusted by (Purchasing Power Parity)
a Unit: KW/capita b Unit: %
c Unit: Year 2011 USD/capita
d Unit: Quadrillion British Thermal Unit (QBtu)
Univariate 5-year lag 10-year-lag 15-year-lag Males RR 95%CI RR 95%CI RR 95%CI RR 95%CI Intercept 3.16×10⁻⁴ (1.82 ~ 5.49) ×10-4 3.20×10⁻⁵ (0.77 ~ 13.2) ×10-5 3.12×10⁻⁵ (0.74 ~ 13.2) ×10-5 2.82×10⁻⁵ (0.60~13.3) ×10-5
Per capita coal capacity a 2.620 (1.400 ~ 4.903) 1.681 (1.103 ~ 2.562) 1.585 (1.070 ~ 2.347) 1.571 (1.05~2.351)
Smoking prevalence b 1.031 (1.009 ~ 1.053) 1.031 (1.009 ~ 1.054) 1.032 (1.009~1.056)
Non-coal capacity a 0.935 (0.785 ~ 1.115) 0.915 (0.762 ~ 1.099) 0.897 (0.727~1.107)
Traffic index b 1.001 (0.983 ~ 1.020) 1.002 (0.983 ~ 1.020) 1.003 (0.981~1.025)
Industrialization index b 1.025 (1.001 ~ 1.049) 1.025 (1.001 ~ 1.049) 1.026 (1.001~1.052)
GDP (PPP) per capita c 1.000 (1.000 ~ 1.000) 1.000 (1.000 ~ 1.000) 1.000 (1.000~1.000)
Total coal consumption d 1.008 (1.001 ~ 1.015) 1.010 (1.003 ~ 1.017) 1.011 (1.004~1.018)
QIC -5828520 -5134366 -5133338 -5043156
Females RR 95%CI RR 95%CI RR 95%CI RR 95%CI Intercept 1.03×10⁻⁴ (0.58~ 1.86) ×10-4 1.21×10⁻⁵ (0.35 ~ 4.13) ×10-5 1.16×10⁻⁵ (0.34 ~ 3.99) ×10-5 1.08×10⁻⁵ (0.33~3.57) ×10-5
Per capita coal capacity a 3.872 (2.238 ~ 6.697) 1.842 (1.159 ~ 2.927) 1.851 (1.217 ~ 2.816) 1.852 (1.223~2.803)
Smoking prevalence b 1.023 (1.000 ~ 1.047) 1.022 (0.998 ~ 1.046) 1.021 (0.996~1.047)
Non-coal capacity a 1.002 (0.796 ~ 1.261) 0.986 (0.784 ~ 1.240) 0.981 (0.771~1.247)
Traffic index b 1.002 (0.986 ~ 1.017) 1.002 (0.987 ~ 1.017) 1.002 (0.986~1.018)
Industrialization index b 1.060 (1.027 ~ 1.094) 1.062 (1.029 ~ 1.096) 1.064 (1.030~1.100)
GDP (PPP) per capita c 1.000 (1.000 ~ 1.000) 1.000 (1.000 ~ 1.000) 1.000 (1.000~1.000)
Total coal consumption d 1.018 (1.002 ~ 1.035) 1.020 (1.005 ~ 1.035) 1.021 (1.006~1.035)
16
No statistically significant interactions between smoking and coal capacity, or any other time-varying effects on the estimates, were discovered, and thus these results were omitted. In the falsification test, coal capacity was not associated with CRC incidence rates in either males or females for any lag model (Supplementary Table 2).
Supplementary Table 3 presents the PAFs and standardized lung cancer cases attributable to coal-fired power plants among males and females, respectively, in 2015. PAFs are higher for females than males in most countries due to higher RRs. Australia (39.26%) and US (32.65%) had the highest PAFs in 2015, corresponding to 13,539 and 244,617 standardized lung cancer among females, respectively. In China, we estimated 139,345 standardized lung cancer among females (PAF=8.09%) and 314,524 among males (PAF=6.39%) in 2015. We estimated the attributable factor will jump up to 19.24% and 15.22% for females and males in 2025, respectively, due to the dramatic increase of per capita coal capacity from 2005 to 2015 in China.
1.4 Discussion
17
externality then pollutant composition measurements. Fourthly, although capacity factors varied among countries, the range of capacity was approximately 40%–60% (Kwon 2015); this indicates that the quantity of coal combustion remained fixed after a plant was built. Finally, coal prices in a local market reflect coal quality. Although coal quality might vary between countries, it remains constant within a plant across time.(Mernier 2010) Country-specific effects, such as coal quality, are marginalized out by GEE in the analysis. By weighting the model by country population, we are reflecting the individual data by exploiting aggregated mean values of per capita coal capacity for each individual.
The association between per capita coal capacity and lung cancer incidence can be used to understand the potential number of lives affected by different levels of reliance on coal power. In 2015, we estimate a total of 865,805 male and 542,848 female standardized lung cancer cases can be attributed to anthropogenic power plants using coal as primary energy source. There is little difference between the lag 5 and lag 10 models in terms of quadratic information criterion (QIC)(Pan 2001) and coefficients, so for sake of consistency with the other covariates, we fix lag 10 for coal capacity as primary model and estimate PAFs. These numbers should be interpreted as the total attributable cases given every country has WHO 2000-2025 standardized population and should not be compared directly to other estimations. However, these numbers adjust for age distributions in different countries and can be a valuable tool for country-to-country comparisons of the effect from coal capacity.
18
is associated with the higher risk of lung cancer by a factor of 5.68% (=1.5850.12) while the decreasing smoking prevalence prevented the risk by a factor of 11.28% (=1.0313.5). This is meant as a quick numerical check; however, one should not try to surmise any statistical results from this.
1.5 Study Limitations
Despite using an ecological study design, the potential for “ecologicalfallacy”(Robinson 2009) is unlikely because our analysis on aggregated data is meant to infer policy decisions at the national level and for international comparison, but not at the individual level (Idrovo 2011). To address concerns of data quality and other country-specific biases, we fitted a Poisson regression longitudinal model with GEE (Zeger 1986) to account for time-independent confounders such as underreporting and/or over-diagnosis of diseases. GEE is a semiparametric technique in that it makes no assumptions about the correlation structure among outcomes. One disadvantage regarding GEE is potential efficiency losses compared to mixed models, if we could have correctly specified the true correlation structure properly in a parametric form. However, we are willing to sacrifice some efficiency for statistical robustness, a property GEE possesses while mixed models do not(John E. Overall 2004). Regardless, this disadvantage would be germane had we failed to reject that coal capacity has a significant effect on lung cancer, but since we did reject, fitting with a correctly specified mixed model would only serve to increase the significance of the effect.
19
study is the best available data we can obtained(Global Burden of Disease Collaborative Network 2016). Another potential misclassification is meteorological factor, which cannot be adjusted in our model. Since neither the electricity matrix nor meteorological factor is relevant to a country’s
healthcare system, misclassification is non-differential and more likely biases toward the null.
Our estimates may be conservative since they do not account for all time-varying covariates in the model, such as indoor biomass combustion (Richard Hosier 1987). Although most countries included in this study were high-income countries and used a limited proportion of indoor biomass combustion, the true effect of coal power plants might be even higher if biomass combustion remained constant rather than decreasing. We adjusted total coal consumption in the model, which included the indoor combustion. Furthermore, the association between increasing lung cancer incidence and coal capacity may be underestimated since the calculations do not account for the improvement of techniques for controlling air pollutants across time. Further studies should address the effectiveness of pollutant controls in terms of incidence from lung cancer.
1.6 Conclusion
20 1.7 References
Brett I. 2012. Coal blooded: Putting profits before people. New Pittsburgh Courier.
Buonocore JJ, Lambert KF, Burtraw D, Sekar S, Driscoll CT. 2016. An analysis of costs and health co-benefits for a
u.S. Power plant carbon standard. PLoS One 11:e0156308.
Cui P, Huang Y, Han J, Song F, Chen K. 2015. Ambient particulate matter and lung cancer incidence and mortality:
A meta-analysis of prospective studies. Eur J Public Health 25:324-329.
Dockery DW, Pope CA, 3rd, Xu X, Spengler JD, Ware JH, Fay ME, et al. 1993. An association between air pollution
and mortality in six u.S. Cities. N Engl J Med 329:1753-1759.
Ezzati M, Lopez AD. 2003. Estimates of global mortality attributable to smoking in 2000. Lancet 362:847-852.
Global Burden of Disease Collaborative Network. 2016. Global burden of disease study 2016 (gbd 2016) results.
Available: http://ghdx.healthdata.org/gbd-results-tool. [accessed October 31 2017].
Groningen Growth and Development Centre Faculty of Economics and Business. 2016. The database penn world
table version 9.0. [accessed Feb 27 2017 ].
Harrison RM, Yin J. 2000. Particulate matter in the atmosphere: Which particle properties are important for its effects
on health? Sci Total Environ 249:85-101.
Hill AB. 1965. The environment and disease: Association or causation? Proc R Soc Med 58:295-300.
Idrovo AJ. 2011. Three criteria for ecological fallacy. Environ Health Perspect 119:A332.
International Agency for Research on Cancer (IARC). 2016. Iarc monographs on the evaluation of carcinogenic risks
to humans. Available: http://monographs.iarc.fr/ENG/Classification/Table4.pdf [accessed Oct 27 2017].
International Energy Agency. 2017. World balance. Available: ttps://www.iea.org/Sankey [accessed OCtober 27
2017].
Jerrett M, Burnett RT, Ma R, Pope CA, 3rd, Krewski D, Newbold KB, et al. 2005. Spatial analysis of air pollution
and mortality in los angeles. Epidemiology 16:727-736.
John E. Overall ST. 2004. Robustness of generalized estimating equation (gee) tests of significance against
misspecification of the error structure model. Biometrical Journal 46:11.
Kwon A. 2015. Electric generator capacity factors vary widely across the world. [accessed Feb 13 2017].
Lee LJ, Lin CK, Hung MC, Wang JD. 2016. Impact of work-related cancers in taiwan-estimation with qaly
21
Markandya A, Wilkinson P. 2007. Electricity generation and health. Lancet 370:979-990.
Mernier A. 2010. Putting a price on energy: International coal pricing. [accessed Feb 13 2017].
Miller KA, Siscovick DS, Sheppard L, Shepherd K, Sullivan JH, Anderson GL, et al. 2007. Long-term exposure to
air pollution and incidence of cardiovascular events in women. N Engl J Med 356:447-458.
National Aeronautics and Space Administration. 2010. New map offers a global view of health-sapping air pollution.
Available: https://www.nasa.gov/topics/earth/features/health-sapping.html [accessed Oct 27 2017].
National Statistics Taiwan. 2016. Gross domestic product by kind of activity and implicit price deflators. Available:
http://eng.stat.gov.tw/ct.asp?xItem=37408&CtNode=5347&mp=5 [accessed Febuary 26 2017].
Ng M, Freeman MK, Fleming TD, Robinson M, Dwyer-Lindgren L, Thomson B, et al. 2014. Smoking prevalence
and cigarette consumption in 187 countries, 1980-2012. JAMA 311:183-192.
Omar B. Ahmad CB-P, Alan D. Lopez, Christopher JL Murray, Rafael Lozano, Mie Inoue. 2001. Age
standardization of rates: A new who standard.Geneva, World Health Organization.
Padula AM, Mortimer K, Hubbard A, Lurmann F, Jerrett M, Tager IB. 2012. Exposure to traffic-related air pollution
during pregnancy and term low birth weight: Estimation of causal associations in a semiparametric model. Am J
Epidemiol 176:815-824.
Pan W. 2001. Akaike's information criterion in generalized estimating equations. Biometrics 57:120-125.
Pope CA, 3rd, Burnett RT, Thun MJ, Calle EE, Krewski D, Ito K, et al. 2002. Lung cancer, cardiopulmonary mortality,
and long-term exposure to fine particulate air pollution. JAMA 287:1132-1141.
Pope CA, 3rd, Ezzati M, Dockery DW. 2009. Fine-particulate air pollution and life expectancy in the united states. N
Engl J Med 360:376-386.
Richard Hosier JD. 1987. Household fuel choice in zimbabwe: An empirical test of the energy ladder hypothesis.
Resources and Energy 4:15.
Robinson WS. 2009. Ecological correlations and the behavior of individuals. Int J Epidemiol 38:337-341.
Sarah Penney JB, John Balbus, . 2009. Estimating the health impacts of coal-fired power plants receiving international
financing.Environmental Defense Fund.
The World Bank. 2016. World development indicators. Available:
22
UDI World Electric Power Plants Database (WEPP). 2016. World electric power plants database. Available:
http://www.platts.com/products/world-electric-power-plants-database [accessed Feb 26 2016].
United Nations Statistics Division. Methodology standard country or area codes for statistical use (m49). Available:
http://unstats.un.org/unsd/methods/m49/m49.htm [accessed October 27 2017].
US Energy Information Administration. 2015. Primary coal consumption Available:
http://www.eia.gov/cfapps/ipdbproject/IEDIndex3.cfm?tid=1&pid=1&aid=2 [accessed Febuary 26 2016 ].
US supreme Court. 2001. Whitman v. American trucking assns., inc. 531 u.S. 457 (2001). Available:
https://supreme.justia.com/cases/federal/us/531/457/ [accessed Oct 27 2017].
William M. Hodan WRB. Evaluating the contribution of pm2.5 precursor gases and re-entrained road emissions to
mobile source pm2.5 particulate matter emissions.MACTEC Federal Programs.
23 1.8 Supplementary material
Supplementary Table 1.1 Countries included in the analysis, by geographical region a (N =
83)
Regions N Countries
Africa 14
Eastern Africa 6 Kenya, Madagascar, Mauritius, Tanzania, Zambia, Zimbabwe
Northern Africa 1 Morocco
Southern Africa 5 South Africa, Botswana, Namibia, Niger, Pakistan
Western Africa 2 Nigeria, Senegal
Oceania 2 Australia, New Zealand
Asia 23
Eastern Asia 6 China, Japan, Mongolia, North Korea, South Korea, Taiwan,
South-Eastern Asia 8
Cambodia, Indonesia, Laos, Malaysia, Myanmar, Philippines,
Thailand, Vietnam
Western Asia 3 Israel, Syria, Turkey
24 Supplementary Table 1.1 (continued)
Southern Asia 3 Bangladesh, India, Sri Lanka
America 12
Caribbean 1 Dominican Republic
Central America 4 Guatemala, Honduras, Mexico, Panama
South America 5 Argentina, Brazil, Chile, Colombia, Peru
North America 2 Canada, United States of America
Europe 32
Eastern Europe 9
Bulgaria, Czech Republic, Hungary, Poland, Republic of
Moldova, Romania, Russian Federation Slovakia, Ukraine
Southern Europe 11
Albania, Bosnia and Herzegovina, Croatia, Greece, Italy,
Montenegro, Portugal, Serbia, Slovenia, Spain, TFYR Macedonia
Western Europe 6 Austria, Belgium, France, Germany, Iceland, Netherlands
North Europe 6 Denmark, Finland, Ireland, Norway, Sweden, United Kingdom
N = number of countries
25
Supplementary Table 1.2 Relative risk (RR) and 95% confidence intervals (CIs) of the increase in colorectal cancer with
change in coal capacity, adjusted for different variables in different models among males and females.
5-year lag 10-year-lag 15-year-lag
Males RR 95%CI RR 95%CI RR 95%CI
Intercept 3.08×10⁻⁵ (0.96 ~ 9.84) ×10-5 3.21×10⁻⁵ (0.98 ~ 10.6) ×10-5 3.20×10⁻⁵ (0.80 ~ 12.2) ×10-5
Per capita coal capacity a 1.088 (0.731 ~ 1.618) 0.986 (0.674 ~ 1.442) 0.952 (0.648~1.398)
Smoking prevalence b 1.023 (1.005 ~ 1.041) 1.022 (1.004 ~ 1.041) 1.022 (1.003~1.042)
Non-coal capacity a 0.898 (0.764 ~ 1.055) 0.890 (0.758 ~ 1.045) 0.884 (0.744~1.050)
Traffic index b 0.999 (0.984 ~ 1.015) 0.999 (0.983 ~ 1.015) 1.000 (0.980~1.020)
Industrialization index b 1.014 (0.991 ~ 1.039) 1.013 (0.989 ~ 1.036) 1.012 (0.988~1.036)
GDP (PPP) per capita c 1.000 (1.000 ~ 1.000) 1.000 (1.000 ~ 1.000) 1.000 (1.000~1.000)
Total coal consumption d 1.001 (0.990 ~ 1.011) 1.002 (0.992 ~ 1.012) 1.002 (0.993~1.012)
QIC -3939681 -3937742 -3875775
Females RR 95%CI RR 95%CI RR 95%CI
Intercept 4.61×10⁻⁵ (0.16 ~ 1.38) ×10-4 4.82×10⁻⁵ (0.16 ~ 1.43) ×10-4 5.15×10⁻⁵ (0.17 ~ 1.57) ×10-4
Per capita coal capacity a 1.124 (0.821 ~ 1.539) 1.002 (0.737 ~ 1.361) 0.928 (0.678~1.269)
Smoking prevalence b 1.021 (1.006 ~ 1.036) 1.021 (1.006 ~ 1.036) 1.022 (1.007~1.038)
Non-coal capacity a 0.949 (0.816 ~ 1.104) 0.940 (0.806 ~ 1.098) 0.946 (0.804~1.112)
Traffic index b 0.998 (0.986 ~ 1.009) 0.997 (0.986 ~ 1.009) 0.996 (0.984~1.009)
Industrialization index b 1.026 (0.999 ~ 1.053) 1.024 (0.997 ~ 1.051) 1.021 (0.994~1.049)
GDP (PPP) per capita c 1.000 (1.000 ~ 1.000) 1.000 (1.000 ~ 1.000) 1.000 (1.000~1.000)
Total coal consumption d 1.001 (0.992 ~ 1.010) 1.003 (0.994 ~ 1.012) 1.004 (0.995~1.013)
QIC -2372015 -2370885 -2323628
RR: relative risk; 95%CI: 95% confidence interval; GDP (PPP): gross domestic product adjusted by (Purchasing Power Parity)
a Unit: KW/capita b Unit: %
c Unit: Year 2011 USD/capita
26
Supplementary Table 1.3 Estimated population attributable factors (2015, 2025) and
standardized attributable cases (2015) among males and females of studied countries
Supplementary Figure 1.1 Annual coal capacity, coal capacity, log coal capacity and coal
27
Chapter 2. Sulfur Oxide Controls in Coal-Fired Power Plants and Cardiovascular
Disease
2.1 Introduction
CVD has been a leading cause of death globally for decades1. Treating CVD is costly, especially in the United States (US). For the US, the burden of medical cost for CVD was 656 billion United States Dollars (USD) in 2015 and is projected to reach 1,208 billion USD in 20302.
Controlling emissions from power-generating plants is important for human health as well as climate. Among the health problems linked to sulfur oxides (SOx) exposures in air is cardiovascular disease (CVD)3,4. Various air pollutants initiate and promote atherosclerotic progression5,6 and are associated with transient increases in plasma viscosity and thrombus formation7. Clear links have been drawn between SO
2 and CVD8,9. Indeed, total suspended particles (TSP) and SO2 are associated with changes in vasomotor tone10 and thus alter heart rate11,12 and cardiac function13. Such mechanisms may underlie the association between SO
2 and CVD.
Coal-fired power-generating facilities have long been known to emit pollutants that fuel climate change and adversely impact human health. Among these emissions are SOx, including sulfur dioxide (SO2). Global SO2 emissions, measured by the bottom-up mass balance method, peaked in the early 1970s and decreased for decades14. After the 2000s, these emissions increased again, mostly from developing countries15. The majority of SO
x in the air is anthropogenic emission from coal-fired power plants16. For example, in the US, 65% of SO
28
To control these emissions, dozens of methods with relatively high efficiencies have been developed for fitting of coal-fired power plants. SOx emissions are determined by (1) the sulfur content in coals burned and (2) the emission control system used19. The principle technology of emission control systems is the use of sorbents to scrub SOx from the flue gas, called a flue gas desulfurization (FGD) system. Another method to reduce SOx emission is the use of low sulfur coal, such as sub-bituminous coal mined in the Powder River Basin of Montana and Wyoming19. However, this method is not efficient and has a limited application globally. Indeed, FGD products represent an efficient and economically feasible approach to control emissions on a large scale. The cost to retrofit US plants with FGD equipment was estimated at about $407 (2008 USD) per kilowatt (kW) for a 500-megawatt (MW) plant in 2009; this cost escalates yearly by $1620. For most nations, coal-fired power plants are either state-owned or government-funded, giving governments direct authority on implementing emission controls; privately-owned power-generating units can be required to follow emissions regulations.
Here, we estimated the relative risks and incident cases of CVD, particularly ischemic heart disease (IHD), attributable to SOx emission from coal-fired power plants from a global perspective. This study sought to determine the potential reduction in preventable CVD that could be attributed to reduced global SOx emissions.
2.2 Methods
2.2.1 Data source
29
Classification of Diseases version 9 (ICD-9) and I21.0–I21.4, I21.9, I22.0–I22.2, and I22.8–I22.9 in ICD-10. The latter was coded as 391.0–391.2, 391.8–391.9, 392.0, 394.0–394.2, 394.9, 395.0–
395.2, 395.9, 396.0–396.3, 396.8–396.9, 397.0–397.1, 397.9, 398.8–398.9 in ICD-9 and I01.0–
I01.2, I01.8–I01.9, I02.0, I05.0–I05.2, I05.8–I05.9, I06.0–I06.2, I06.8–I06.9, I07.0–I07.2, I07.8–
I07.9, I08.0–I08.3, I08.8–I08.9, I09.0–I09.2, I09.8–I09.9 in ICD-1022. The GBD study has thorough estimation of incidence rates of CVD in 2010 and 2015, respectively. For CVD incidence rates data between 2011 and 2014, we estimated using linear interpolation.
Coal capacity is defined as the generating capacity of a coal-fired power plant [unit: megawatt (MW)]. The estimation for reduction of each unit is based on the representative SOx reduction percentage of the corresponding control technology from literature review, summarized in Supplementary table 1. National SOx reduction is the coal-capacity-weighted average SOx reduction in a given country. The formula is written as follows:
𝑁𝑎𝑡𝑖𝑜𝑛𝑎𝑙 𝑆𝑂x 𝑟𝑒𝑑𝑢𝑐𝑡𝑖𝑜𝑛 (%) =
∑𝑛𝑖=1𝑆𝑂x 𝑟𝑒𝑑𝑢𝑐𝑡𝑖𝑜𝑛𝑖(%) × 𝑐𝑜𝑎𝑙 𝑐𝑎𝑝𝑎𝑐𝑖𝑡𝑦𝑖 (𝑀𝑊) ∑𝑛𝑖=1𝑐𝑜𝑎𝑙 𝑐𝑎𝑝𝑎𝑐𝑖𝑡𝑦𝑖(𝑀𝑊)
where i is a coal-fired power unit and n is the total units in a country. Coal capacities are the weight for the reductions in different power units. Missing data on SOx control are assigned 0. Data on
the coal capacity of every plant were derived from the Utility Data Institute World Electric Power
Plants Data Base (UDI WEPP)21.
30
capture a country's standard of living level33. Traffic index, measured as the proportion of a country’s population living in urban areas, was applied to capture air pollutants emitted from all mechanical vehicles and public transports associated with human activities34. The industrialization level was measured using the shares of CO2 emissions from manufacturing industries and construction in total CO2 emissions (% of total fuel combustion)35. We further grouped studied countries into 6 WHO regions (combination of geographical distribution and mortality): Africa, the Americas, Southeast Asia, Europe, Eastern Mediterranean, and the Western Pacific36.
2.2.2 Data analysis
We took a natural logarithm of coal capacity to approximate normal distribution in the model. A Poisson regression was performed for count data of incidence cases of diseases. Our primary model is as following:
𝑙𝑛(𝐸[𝜆𝑖]) = 𝛽0 + 𝛽1× 𝑆𝑂2 𝑟𝑒𝑑𝑢𝑐𝑡𝑖𝑜𝑛𝑖 + 𝛽2× 𝑆𝑚𝑜𝑘𝑖𝑛𝑔 𝑝𝑟𝑒𝑣𝑎𝑙𝑒𝑛𝑐𝑒𝑖
+ 𝛽3× 𝑇𝑟𝑎𝑓𝑓𝑖𝑐 𝑖𝑛𝑑𝑒𝑥𝑖+ 𝛽4× 𝐼𝑛𝑑𝑢𝑠𝑡𝑟𝑖𝑎𝑙𝑖𝑧𝑎𝑡𝑖𝑜𝑛𝑖 + 𝛽5
× 𝑙𝑜𝑔(𝑁𝑎𝑡𝑖𝑜𝑛𝑎𝑙 𝑐𝑜𝑎𝑙 𝑐𝑎𝑝𝑎𝑐𝑖𝑡𝑦)𝑖+ 𝛽6× 𝐼_𝑅𝑒𝑔𝑖𝑜𝑛𝑖
where i denotes each country; ln(E[λi]) denotes the natural log of expected standardized incident
rates for CVD conditioned on covariates Xi; 𝛽0 is the intercept; 𝛽1 𝑡𝑜 𝛽6 are coefficients of
individual covariates; and I_Region is indicator variable for the six WHO regions to consider the underlying difference in hygiene and healthcare status.
31
index, and industrialization; and (4) non-regional model with combination of behavior and economics. All models were analyzed for both sexes combined, males, and females, respectively, and weighted by nationwide sex-specific population34 for all multivariate models.
Under the assumption that every country could hypothetically reach an optimal national SOx reduction by a factor of 95%, we estimated the proportional attributable factor (PAF) for IHD for every country. The formula for PAF is written as follows37:
𝑃𝐴𝐹 = 𝑃𝑖 × (𝑅𝑅𝑖− 1) 1 + 𝑃𝑖× (𝑅𝑅𝑖 − 1)
where Pi is the proportion of people exposed to suboptimal SOx reduction. In the estimation, we applied WHO mortality strata and assumed the Pi is 0.1 in strata A countries and 0.5 in stratum B
to E countries38, respectively, as often used in other studies39-41. 𝑅𝑅
𝑖 is the relative risks from the primary model, comparing existing national SOx reduction in 2012 vs. the counterfactual optimal reduction (95%). Supplementary Table 2 shows the step-by-step calculation for PAFs. The incident cases of IHD attributable to SOx controls in coal-fired power plants were estimated by multiplying the standardized incidence rates by sex-specific population and PAF.
𝑆𝑂𝑥 𝑎𝑠𝑠𝑜𝑐𝑖𝑎𝑡𝑒𝑑 𝐼𝐻𝐷 = 𝑃𝑜𝑝𝑢𝑙𝑎𝑡𝑖𝑜𝑛 × Standardized Incidence Rate × 𝑃𝐴𝐹
We performed the PROC GENMOD procedure with a log link function, using SAS version 9·4 (SAS Institute, Cary, NC, US) to estimate the effect of selected factors on standardized incidences of CVD, IHD, and RHD, respectively.
2.2.3 Additional analysis and falsification test
32
subcategories of CVD: IHD and RHD. Since the latter is related to previously unsatisfactorily-treated streptococcus infection, we identified RHD as a falsification outcome that might be a marker that are not expected to bear any relationship to air pollution. We applied the primary model for IHDs and rheumatic heart diseases, respectively, as the additional analysis and examined whether the relationship between RHD and SOx reduction existed as a falsification test.
2.3 Results
Data on the coal capacities of power plants across the globe were derived from the Utility
Data Institute World Electric Power Plants Data Base (UDI WEPP)21. We identified a total of
13,581 generating units in 79 countries that used coal as the primary energy source (Table 1). Most
were in Europe (N=36), the Americas (N=12), and the Western Pacific (N=11).
Table 2.1 Countries included in the analysis, by geographical region (N = 79)
Regions N Countries
Africa 10
Botswana, Madagascar, Mauritius, Namibia, Niger, Nigeria, Senegal, South Africa, Swaziland, Tanzania, Zambia, Zimbabwe
Americas 12
33
Table 2.1 (continued)
Europe 36
Albania, Austria, Belgium, Bosnia and Herzegovina, Bulgaria, Croatia, Czech Republic, Denmark, Finland, France, Germany, Greece, Hungary, Ireland, Israel, Italy, Kazakhstan, Kyrgyzstan, Macedonia, Moldova, Montenegro, Netherlands, Norway, Poland, Portugal, Romania, Russia, Serbia, Slovakia, Slovenia, Spain, Sweden, Turkey, Ukraine, United Kingdom, Uzbekistan
South East Asia 7 Bangladesh, India, Indonesia, Myanmar, North Korea, Sri Lanka, Thailand
Western Pacific 11
Australia, Cambodia, China, Japan, Malaysia, Mongolia, New Zealand, Philippines, South Korea, Taiwan, Vietnam
Eastern Mediterranean 3 Morocco, Pakistan, Syria
[image:43.612.74.529.143.510.2]34
[image:44.612.75.538.244.597.2]capacity in the study. We assigned those missing as 0 reduction in the following analysis. We defined national SOx reduction as the average SOx reduction percentage weighted by generating capacities of individual plants in a given country. Total coal capacities and national SOx reduction in included countries in 2012 are summarized in Figure 1. The lack of installing control systems in small units in many countries produced a bimodal distribution of national SOx reduction, with a median of 58.49% (Supplementary Figure 1).
Figure 2.1 Total coal capacity (upper panel) and national SOx reduction by country (lower
panel) in 2012
35
To determine effects of SOx emission controls on CVD, we extracted age- and sex-adjusted CVD incidence rates from the Global Burden of Disease (GBD) Study22, including two subcategories: ischemic heart diseases (IHD) and rheumatic heart diseases (RHD). The former reflects coronary artery disease, which may have a stronger association with air pollution; the latter is a contagious disease that we used as a falsifying outcome. Table 2 summarizes these and other covariates included in the study. IHD was more common among males, while RHD, accounting for less than 1% of CVD, was more common among females. One behavior risk factor for CVD—
[image:45.612.63.531.340.699.2]smoking prevalence—was almost three times higher among males than females.
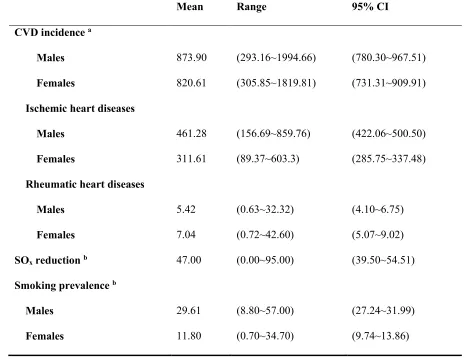
Table 2.2 Mean, range, and 95% CI of covariates among studied countries in 2012
Mean Range 95% CI
CVD incidence a
Males 873.90 (293.16~1994.66) (780.30~967.51)
Females 820.61 (305.85~1819.81) (731.31~909.91)
Ischemic heart diseases
Males 461.28 (156.69~859.76) (422.06~500.50)
Females 311.61 (89.37~603.3) (285.75~337.48)
Rheumatic heart diseases
Males 5.42 (0.63~32.32) (4.10~6.75)
Females 7.04 (0.72~42.60) (5.07~9.02)
SOx reduction b 47.00 (0.00~95.00) (39.50~54.51)
Smoking prevalence b
Males 29.61 (8.80~57.00) (27.24~31.99)
36 Table 2.2 (continued)
Per capita GDP (PPP) c 20.44 (0.84~63.8) (17.01~23.88)
Traffic index b 61.29 (17.99~97.73) (56.76~65.82)
Industrialization b 18.67 (2.55~62.09) (16.45~20.90)
Coal capacity d 22726.01 (10.10~780959.5) (1495.29~43956.73)
Population e
All 72150.04 (623.86~1355386.95) (25955.69~118344.39)
Males 36378.31 (308.06~697964.30) (12550.04~60206.57)
Females 35771.73 (315.80~657422.65) (13401.46~58142.00)
a Unit: incident case per 100,000
b Unit: %
c Unit: thousands United States Dollars
d Unit: megawatt
e Unit: thousand people
[image:46.612.75.523.93.305.2]37
Table 2.3 The effects of sulfate oxide controls in coal-fired power plants on cardiovascular diseases in different models, among
sex combined, males, and females.
Primary model Behavior model Economics model Non-regional model
Sex combined RR 95%CI RR 95%CI RR RR 95%CI 95%CI
Intercept 0.0041 (0.0038~0.0043) 0.0060 (0.0059~0.0061) 0.0049 (0.0047~0.0052) 0.0049 (0.0046~0.0051) SOx reduction a 0.9925 (0.9892~0.9959) 0.9847 (0.9815~0.9878) 0.9861 (0.9824~0.9898) 0.9793 (0.9756~0.9830)
Smoking prevalence b 1.0037 (1.0033~1.0041) 1.0070 (1.0066~1.0075) 1.0068 (1.0063~1.0072)
Per capita GDP(PPP) c 1.0092 (1.0087~1.0097) 1.0083 (1.0071~1.0095) 1.0095 (1.0083~1.0107)
Traffic index b 1.0018 (1.0011~1.0024) 1.0017 (1.0011~1.0024) 1.0005 (0.9998~1.0011)
Industrialization b 1.0038 (1.0026~1.005) 1.0032 (1.0018~1.0047) 1.0022 (1.0008~1.0037)
Ln coal capacity d 1.0450 (1.0413~1.0487) 1.0177 (1.0146~1.0208) 1.0159 (1.0128~1.0190)
Region
Africa 0.7909 (0.7389~0.8464) America 0.8082 (0.7655~0.8533) Europe 1.5187 (1.4466~1.5945)
South-East Asia 0.8046 (0.7693~0.8415)
38
Table 2.3 (Continued)
Eastern Mediterranean 1.0000 -
Males
Intercept 0.0043 (0.0038~0.0049) 0.0052 (0.0050~0.0055) 0.0049 (0.0045~0.0054) 0.0053 (0.0048~0.0058) SOx reduction a 0.9972 (0.9905~1.0039) 0.9775 (0.9710~0.9840) 0.9898 (0.9825~0.9972) 0.9686 (0.9612~0.9761)
Smoking prevalence b 1.0032 (1.0016~1.0048) 1.0104 (1.0092~1.0116) 1.0104 (1.0090~1.0117)
Per capita GDP(PPP) c 1.0117 (1.0106~1.0128) 1.0085 (1.0061~1.0109) 1.0148 (1.0123~1.0173)
Traffic index b 1.0012 (0.9999~1.0026) 1.0011 (0.9998~1.0023) 0.9976 (0.9963~0.9990)
Industrialization b 1.0019 (0.9994~1.0043) 1.0046 (1.0017~1.0075) 1.0004 (0.9975~1.0033)
Ln coal capacity d 1.0489 (1.0417~1.0562) 1.0203 (1.0144~1.0264) 1.0108 (1.0048~1.0169)
Region
Africa 0.7261 (0.6342~0.8314) America 0.8101 (0.7272~0.9024) Europe 1.4162 (1.2879~1.5573)
South-East Asia 0.7813 (0.7164~0.8521)
Western Pacific 0.7753 (0.7040~0.8539)
[image:48.792.81.707.114.510.2]39
Table 2.3 (Continued)
Females
Intercept 0.0039 (0.0034~0.0044) 0.0058 (0.0056~0.0060) 0.0049 (0.0044~0.0055) 0.0027 (0.0024~0.0030) SOx reduction a 0.9831 (0.9762~0.9901) 0.9983 (0.9919~1.0049) 0.9821 (0.9746~0.9895) 0.9898 (0.9822~0.9973)
Smoking prevalence b 1.0124 (1.0079~1.0168) 1.0347 (1.0320~1.0375) 1.0485 (1.0452~1.0517)
Per capita GDP(PPP) c 0.9965 (0.9950~0.9981) 1.0080 (1.0056~1.0105) 0.9951 (0.9926~0.9976)
Traffic index b 1.0010 (0.9996~1.0025) 1.0025 (1.0011~1.0038) 1.0000 (0.9986~1.0013)
Industrialization b 1.0072 (1.0047~1.0097) 1.0017 (0.9987~1.0047) 1.0113 (1.0082~1.0143)
Ln coal capacity d 1.0417 (1.0343~1.0492) 1.0149 (1.0086~1.0212) 1.0461 (1.0392~1.0531)
Region
Africa 0.8605 (0.7504~0.9867) America 0.7909 (0.707~0.8847) Europe 1.5105 (1.3538~1.6854)
South-East Asia 0.8229 (0.7493~0.9038)
Western Pacific 0.8689 (0.7853~0.9614)
Eastern Mediterranean 1.0000 -
[image:49.792.72.709.119.481.2]40
[image:50.612.79.507.378.712.2]Results of analysis of IHD and RHD as different outcomes are presented in Table 4. Unlike the effects on CVD, the effects of SOx reduction on IHD were stronger in males than in females. A 10% decrease in SOx emission from coal-fired power plants was associated with 0.9722-fold (95% CI=0.9643–0.9801) lower IHD incidence among males, while females had an analogous association of 0.9882 (95% CI=0.9783–0.9981). No statistically significant relationships between SOx reduction and RHD incidence rate among either males or females were found.
Table 2.4 The effects of sulfur oxide controls in coal-fired power plants on the incidence of
ischemic heart disease and rheumatic heart disease, among sex combined, males, and
females, in the primary model.
Ischemic heart disease Rheumatic heart disease
Sex combined RR 95%CI RR 95%CI
Intercept 0.0107 (0.0096~0.0120) 0.0006 (0.0004~0.0010) SOx reduction a 0.9739 (0.9679~0.9800) 0.9691 (0.9408~0.9984)
Smoking prevalence b 1.0099 (1.0091~1.0107) 0.9917 (0.9884~0.9950)
Traffic index b 0.9847 (0.9833~0.9860) 0.9673 (0.9607~0.9739)
Industrialization b 0.9987 (0.9964~1.0010) 1.0170 (1.0066~1.0274)
Ln coal capacity c 1.0318 (1.0253~1.0382) 1.1302 (1.0981~1.1633)
Region
Africa 0.6639 (0.5980~0.7370) 0.3802 (0.2475~0.5841) America 0.6673 (0.6079~0.7326) 0.1734 (0.1084~0.2773) Europe 0.8163 (0.7533~0.8846) 0.1628 (0.1088~0.2437)
41
Table 2.4 (continued)
Western Pacific 0.4523 (0.4190~0.4882) 0.1938 (0.1430~0.2626)
Eastern Mediterranean 1.0000 - 1.0000 -
Males
Intercept 0.0114 (0.0098~0.0133) 0.0004 (0.0001~0.0014) SOx reduction a 0.9722 (0.9643~0.9801) 0.9738 (0.9108~1.0410)
Smoking prevalence b 1.0067 (1.0046~1.0089) 1.0052 (0.9849~1.0259)
Traffic index b 0.9857 (0.9839~0.9876) 0.9629 (0.9446~0.9816)
Industrialization b 0.9972 (0.9941~1.0004) 1.0151 (0.9918~1.0390)
Ln coal capacity c 1.0388 (1.0299~1.0477) 1.1540 (1.0717~1.2426)
Region
Africa 0.6654 (0.5796~0.7641) 0.3902 (0.1517~1.0038) America 0.6884 (0.6065~0.7814) 0.2347 (0.0789~0.6980) Europe 0.8850 (0.7962~0.9837) 0.1670 (0.0703~0.3969)
South-East Asia 0.5698 (0.5184~0.6262) 0.2349 (0.1163~0.4747)
Western Pacific 0.4312 (0.3868~0.4808) 0.1556 (0.0662~0.3660)
Eastern Mediterranean 1.0000 - 1.0000 -
Females
Intercept 0.0099 (0.0083~0.0117) 0.0008 (0.0003~0.0019) SOx reduction a 0.9882 (0.9783~0.9981) 0.9500 (0.8969~1.0064)
Smoking prevalence b 0.9827 (0.9758~0.9896) 1.0208 (0.9650~1.0798)
Traffic index b 0.9886 (0.9864~0.9909) 0.9628 (0.9498~0.9760)
Industrialization b 0.9990 (0.9954~1.0026) 1.0180 (0.9989~1.0374)
Ln coal capacity c 1.0178 (1.0080~1.0277) 1.1351 (1.0764~1.1971)
[image:51.612.75.507.67.713.2]42
Table 2.4 (continued)
Africa 0.6625 (0.5654~0.7764) 0.3681 (0.1655~0.8187) America 0.6212 (0.5397~0.7151) 0.1511 (0.0593~0.3855) Europe 0.9703 (0.8480~1.1104) 0.1102 (0.0403~0.3009)
South-East Asia 0.6014 (0.5409~0.6688) 0.2629 (0.1558~0.4438)
Western Pacific 0.4908 (0.4365~0.5519) 0.1870 (0.1051~0.3326)
Eastern Mediterranean 1.0000 - 1.0000 -
a Unit: 10% b Unit: %
c Unit: Natural log of MW
[image:52.612.77.500.95.252.2]43
Figure 2.2 The IHD incidence cases attributable to suboptimal SOx emission control in
[image:53.612.80.541.119.728.2]45 2.4 Discussion
To our knowledge, this is the first study showing the preventable CVD incidence attributable to SOx reductions from coal-fired power plants from a global perspective. We found that 10% reductions in SOx emissions were associated with CVD incidence rates that were 0.28% lower for males and 1.69% lower for females. Up to 13.24% and 5.70% of incident IHD cases are attributable to suboptimal SOx emissions control in coal-fired power plants among males and females, respectively, given a country can reach 95% SOx reduction in the electricity sector. Our falsifying test (see Methods) revealed no relationship between RHD and air pollution, supporting SOx as a risk factor on air pollution related CVD.
Taking SOx reduction in coal-fired power plants as a determinant of CVD incidence was reasonable and adequate from several perspectives: (1) The majority of SO2 emission was from fossil fuel combustion, mostly coal-fired power units. Therefore, using the reduction percentage in coal-fired plants could capture the largest amount of SOx reduction. (2) The implication of national SOx reduction provides an alternative for policy application at the national level. By summarizing a national SOx reduction, policy makers could use the results presented here to help estimate the counterfactual outcome given a country has improved its SOx control system in coal-fired power plants. (3) Our approach provides a direct method to estimate the externality costs from coal-fired power plants, specifically from SOx control systems, by comparing the costs of treatment for CVD attributable to SOx emissions from coal-fired power plants.
46
at $455 per kW and 30 years lifetime of coal-fired power plants19, the annual cost of SO
x emissions control would be $638.42 million, nominal price. In contrast, the estimated cost of CVD is $1,067.96 million (=564.32 billion dollars*(2,756/1,456,342))2,23 under the estimated PAF=0.0003 for males and 0.002 for females, respectively, in the US (Supplementary Table 2). Yet, for many countries, the situation is more nuanced. For example, China has much higher CVD incidence and PAF than the US, so the health benefits per unit of SOx reduction could be much higher, making FGD installation a cost-effective strategy to improve public health. Moreover, developing countries usually have relatively low SOx reduction rates, such as in the cases of China (59.44%) and India (44.45%). Marginal costs of FGD might rise, while marginal benefits might decrease, when these countries increase their SOx reduction rates. It is possible to find an efficient level of SOx reduction rates (below 95%) when the marginal costs equal marginal benefits. The above examples illustrate the applications of SOx reduction rate and PAF as helpful analytical tools to illuminate policy-making in public health and SOx emissions control.
47
Several limitations or concerns should also be addressed. (1) The cross-sectional study did not provide a temporal interpretation of the causal effect of SOx reduction on CVD prevention. However, since the national SOx reduction in 2012 remained relatively constant compared to our 2016 data, it could be deemed as a marker for what has happened over many previous years. (2)
48
consider the influence of seasonal differences on SOx emission, either. Instead, we focused on the aggregate effect of SOx emission from coal-fired power plants. Higher incidence rate of CVD might be associated with higher amount of coal combustion in winters within a country30. (6) The outcome data were obtained and interpolated from the GBD estimation22. Although we acknowledged the possible inconsistency of over- or under-reports from the global incidence data, GBD estimation provided the most thorough CVD incidences that we could access for a better international comparison.
2.5 Conclusion
49 2.6 References:
1 World Health Organization. The top 10 causes of death,
<http://www.who.int/mediacentre/factsheets/fs310/en/> (2017).
2 Mozaffarian, D. et al. Heart disease and stroke statistics--2015 update: a report from the American Heart
Association. Circulation 131, e29-322, doi:10.1161/CIR.0000000000000152 (2015).
3 Peters, A., Dockery, D. W., Muller, J. E. & Mittleman, M. A. Increased particulate air pollution and the
triggering of myocardial infarction. Circulation 103, 2810-2815 (2001).
4 Samet, J. M., Dominici, F., Curriero, F. C., Coursac, I. & Zeger, S. L. Fine particulate air pollution and
mortality in 20 U.S. cities, 1987-1994. N Engl J Med 343, 1742-1749, doi:10.1056/NEJM200012143432401
(2000).
5 Suwa, T. et al. Particulate air pollution induces progression of atherosclerosis. J Am Coll Cardiol 39,
935-942 (2002).
6 Penn, A. & Snyder, C. A. 1,3 Butadiene, a vapor phase component of environmental tobacco smoke,
accelerates arteriosclerotic plaque development. Circulation 93, 552-557 (1996).
7 Peters, A., Doring, A., Wichmann, H. E. & Koenig, W. Increased plasma viscosity during an air pollution
episode: a link to mortality? Lancet 349, 1582-1587, doi:10.1016/S0140-6736(97)01211-7 (1997).
8 Shah, A. S. et al. Global association of air pollution and heart failure: a systematic review and meta-analysis.
Lancet 382, 1039-1048, doi:10.1016/S0140-6736(13)60898-3 (2013).
9 Hoek, G., Brunekreef, B., Fischer, P. & van Wijnen, J. The association between air pollution and heart failure,
arrhythmia, embolism, thrombosis, and other cardiovascular causes of death in a time series study.
Epidemiology 12, 355-357 (2001).
10 Harrabi, I., Rondeau, V., Dartigues, J. F., Tessier, J. F. & Filleul, L. Effects of particulate air pollution on
systolic blood pressure: A population-based approach. Environ Res 101, 89-93,
doi:10.1016/j.envres.2006.01.012 (2006).
11 Gold, D. R. et al. Ambient pollution and heart rate variability. Circulation 101, 1267-1273 (2000).
12 Pope, C. A., 3rd et al. Heart rate variability associated with particulate air pollution. Am Heart J 138,