White Rose Research Online URL for this paper:
http://eprints.whiterose.ac.uk/138831/
Version: Published Version
Article:
Reppe, S., Wang, Y., Thompson, W.K. et al. (12 more authors) (2015) Genetic sharing with
cardiovascular disease risk factors and diabetes reveals novel bone mineral density loci.
PLoS One, 10 (12). e0144531. ISSN 1932-6203
https://doi.org/10.1371/journal.pone.0144531
eprints@whiterose.ac.uk https://eprints.whiterose.ac.uk/ Reuse
This article is distributed under the terms of the Creative Commons Attribution (CC BY) licence. This licence allows you to distribute, remix, tweak, and build upon the work, even commercially, as long as you credit the authors for the original work. More information and the full terms of the licence here:
https://creativecommons.org/licenses/
Takedown
If you consider content in White Rose Research Online to be in breach of UK law, please notify us by
Genetic Sharing with Cardiovascular Disease
Risk Factors and Diabetes Reveals Novel
Bone Mineral Density Loci
Sjur Reppe1,2,3☯, Yunpeng Wang4,5,6,7☯, Wesley K. Thompson6
, Linda K. McEvoy8,9, Andrew J. Schork8,10, Verena Zuber4,5, Marissa LeBlanc11,12, Francesco Bettella4,5, Ian G. Mills13, Rahul S. Desikan8,9, Srdjan Djurovic4,5, Kaare M. Gautvik1,2,3, Anders M. Dale6,7,8,9, Ole A. Andreassen4,5,6
*, GEFOS Consortium
1Department of Medical Biochemistry, Oslo University Hospital, Oslo, Norway,2Lovisenberg Diakonale Hospital, Oslo, Norway,3Institute of Basic Medical Sciences, University of Oslo, Oslo, Norway,
4NORMENT, KG Jebsen Centre for Psychosis Research, Institute of Clinical Medicine, University of Oslo, Oslo, Norway,5Division of Mental Health and Addiction, Oslo University Hospital, Oslo, Norway,
6Department of Psychiatry, University of California San Diego, La Jolla, California, United States of America,7Department of Neurosciences, University of California San Diego, La Jolla, California, United States of America,8Multimodal Imaging Laboratory, University of California San Diego, La Jolla, California, United States of America,9Department of Radiology, University of California San Diego, La Jolla, California, United States of America,10 Cognitive Sciences Graduate Program, University of California San Diego, La Jolla, California, United States of America,11 Department of Clinical Molecular Biology, Institute of Clinical Medicine, University of Oslo, Oslo, Norway,12 Oslo Centre for Biostatistics and Epidemiology, Department of Biostatistics, University of Oslo, Oslo, Norway,13 Prostate Cancer Research Group, Centre for Molecular Medicine Norway (NCMM), University of Oslo and Oslo University Hospital, Oslo, Norway
☯These authors contributed equally to this work.
¶ Membership of GEFOS Consortium is provided in the Acknowledgments. *o.a.andreassen@medisin.uio.no
Abstract
Bone Mineral Density (BMD) is a highly heritable trait, but genome-wide association studies have identified few genetic risk factors. Epidemiological studies suggest associations between BMD and several traits and diseases, but the nature of the suggestive comorbidity is still unknown. We used a novel genetic pleiotropy-informed conditional False Discovery Rate (FDR) method to identify single nucleotide polymorphisms (SNPs) associated with BMD by leveraging cardiovascular disease (CVD) associated disorders and metabolic traits. By conditioning on SNPs associated with the CVD-related phenotypes, type 1 dia-betes, type 2 diadia-betes, systolic blood pressure, diastolic blood pressure, high density lipo-protein, low density lipolipo-protein, triglycerides and waist hip ratio, we identified 65 novel independent BMD loci (26 with femoral neck BMD and 47 with lumbar spine BMD) at condi-tional FDR<0.01. Many of the loci were confirmed in genetic expression studies. Genes
validated at the mRNA levels were characteristic for the osteoblast/osteocyte lineage, Wnt signaling pathway and bone metabolism. The results provide new insight into genetic mech-anisms of variability in BMD, and a better understanding of the genetic underpinnings of clinical comorbidity.
OPEN ACCESS
Citation:Reppe S, Wang Y, Thompson WK, McEvoy LK, Schork AJ, Zuber V, et al. (2015) Genetic Sharing with Cardiovascular Disease Risk Factors and Diabetes Reveals Novel Bone Mineral Density Loci. PLoS ONE 10(12): e0144531. doi:10.1371/journal. pone.0144531
Editor:Graham R. Wallace, University of Birmingham, UNITED KINGDOM
Received:May 21, 2015
Accepted:November 19, 2015
Published:December 22, 2015
Copyright:© 2015 Reppe et al. This is an open access article distributed under the terms of the
Creative Commons Attribution License, which permits unrestricted use, distribution, and reproduction in any medium, provided the original author and source are credited.
Data Availability Statement:The primary microarray expression data have been submitted to the European Bioinformatics Institute (EMBL-EBI; ID: E-MEXP-1618).
Introduction
Low bone mineral density (BMD) is an important human phenotype predisposing for bone fractures [1]. Primary and secondary osteoporosis, (defined as BMD less than 2.5 SD of young controls) occur frequently in all populations and lead to high risk for fractures and lasting func-tional impairment, resulting in long term personal suffering and high social costs [2]. Several lines of evidence suggest an overlap between BMD/osteoporosis and several traits related to metabolism and cardiovascular disease (CVD): -presence of osteoporosis is associated with a ~4-fold increase in risk for an acute cardiovascular event [3].—BMD loss is associated with increased mortality from coronary heart disease and pulmonary diseases [4]- an inverse rela-tionship is found between high-density lipoprotein (HDL) cholesterol and BMD [5–9]. The relationship between low-density lipoprotein (LDL) cholesterol and BMD appears to be less profound, but a positive association has been found in some studies [5,10]. While not all stud-ies have identified a relationship between Triglycerides (TG) and BMD, a few larger studstud-ies have shown an inverse relationship [7,8,10]. Furthermore, statins are widely used as choles-terol-lowering drugs, and a recent meta-analysis indicates that statins may help improve and maintain BMD at the lumbar spine, hip and femoral neck, especially in Caucasians and Asians [11].
Blood pressure and anthropometric measures have also been found to be associated with BMD in epidemiological studies. Lee et al. [12]. found that both high systolic blood pressure (SBP) and high diastolic blood pressure (DBP) were associated with low femoral BMD, but not with lumbar BMD in a total study sample consisting of 8439 men and postmenopausal women aged 50 years and older. A study of 586 postmenopausal Turkish women also showed a signifi-cant correlation between SBP and femur BMD [13]. It should be noted that several studies also failed to find a link between blood pressure and osteoporosis, e.g. [14].
There is also clinical and epidemiological evidence for association between BMD and meta-bolic traits. As reviewed [15–17], it is well documented that Type 1 Diabetes (T1D) and Type 2 Diabetes (T2D) increase risk of fracture. Also, it is well established that a major part of the increased fracture risk in T1D is caused by reduced BMD, due to defects in osteoblast differen-tiation and activity as well as contributing factors including accumulation of advanced glyca-tion end products (AGEs)[18]. Thus, it is plausible that the microenvironment in which B cells develop, the bone marrow including osteoblasts, is influenced by genetic factors that affect both an autoimmune disease like T1D and osteoporosis.
The relationship between T2D and BMD or fracture is more complicated, since the effect on bone microstructure appears to be more important. However, Sayers et al. [19] found an inverse association between insulin and both periosteal circumference and cortical BMD in adolescents after adjusting for all body composition variables, indicating that insulin levels and diabetes have effects on bone metabolism. In adults T2D has been associated with high BMD [16,17] and Billings et al. [20] identified Integrin, Alpha 1 (ITGA1) as a new locus candidate, capable of influencing both fasting glucose and BMD, thus pointing to a possible explanation for the epidemiological observations linking T2D diabetes and BMD/osteoporosis. The previ-ous concept, that obesity is protective for osteoporosis is weakened since several studies have shown a negative correlation between WHR and BMD [21–23]. Many of the previous studies did not take into consideration that DXA measurements are falsely elevated by increased body fat and that the associated increase in bone marrow adiposity occurs at the expense of bone [23].
The co-morbidity between BMD and CVD risk factors or metabolic traits have been postu-lated to be, at least partly, caused by overlapping genes (pleiotropy) [24]. GWAS have identified several genes and single nucleotide polymorphisms (SNPs) associated with BMD [25], and
6th EU framework program [grant number LSHM-CT-2003-502941 to KMG and SR]; and Oslo University Hospital, Ullevaal [grant number 52009/8029 to KMG]. The funders had no role in study design, data collection and analysis, decision to publish, or preparation of the manuscript.
CVD risk factors or metabolic traits, including HDL [26], LDL [26], TG [26], T1D [27], T2D [28], SBP [29], DBP [29] and WHR [29]. Despite the strong heritable component of BMD, the genes identified in GWAS so far explain only a small proportion of the variance (‘missing heri-tability‘) [25]. Due to the polygenic architecture of BMD, a large number of SNPs have associa-tions too weak to be identified in the currently available cohorts. Thus, pleiotropic enrichment together with cost-effective analytical methods may identify a larger proportion of SNPs associ-ated with BMD.
Standard methods to assess genetic pleiotropy have not taken full advantage of the existing GWAS data and the majority of these studies have focused on the subset of SNPs exceeding a Bonferroni-corrected threshold of significance for each trait or disorder [30,31]. However, this Bonferroni–based approach cannot detect SNPs that only reach genome-wide significance in the combined analysis but do not meet significance cutoffs in the individual phenotype. In the current study, we applied a recently developed genetic pleiotropy-informed approach for GWAS to leverage the power of multiple large GWAS of CVD risk factors blood lipids (HDL, LDL, TG), metabolic disorders (T1D, T2D), blood pressure (SBP, DBP), and waist-hip ratio (WHR) to identify susceptibility SNPs, and capture more of the polygenic effects in BMD [32–
34]. This novel genetic epidemiological approach is able to take advantage of polygenic pleiot-ropy among several types of diseases to identify genetic variants with smaller effect sizes, and thus elucidate the mechanism of variability in BMD. We used summary statistics (p-values and allele frequencies) from the analysis data (up to 32,961 individuals) in the primary study of BMD [25] for both femoral neck (FN) and lumbar spine (LS) BMD phenotypes.
Materials and Methods
Participant Samples and Statistical Strategy
The study was approved by the Norwegian Regional Ethical Committee (REK no: 2010/2539) and conducted according to the Declaration of Helsinki (2000). Written informed consent was given by participants for their clinical records to be used in this study. We obtained complete stage 1 GWAS results in the form of summary statistics p-values from public access websites or through collaboration with investigators (T1D cases and controls from The Type 1 Diabetes Genetics Consortium, BMD cases and controls from the GEFOS Consortium). There was some overlap among several of the participants in the anthropometric GWAS and the BMD GWAS sample (for further details, seeS1 Table).
Statistical Analyses
Overall Approach. After applying genomic inflation control, we compute the stratified empirical cumulative distribution functions (cdfs) of the nominal p-values. Strata are deter-mined by relative enrichment of pleiotropic SNPs in BMD as a function of increased nominal p-values in the different associated traits and disorders. Using this stratified methodology, we construct two-dimensional FDR“look-up”tables (S1andS2Figs), with FDR in BMD SNPs computedconditionalon nominal associated phenotypes p-values (conditional FDR). Using this table we identify loci that are significantly associated with BMD at a conditional FDR level of 0.01. All p-values were corrected for inflation using the genomic control procedure [35], and for overlap in samples [36] as previously described [37]. Finally, the SNP gene associations were validated using information from global transcriptional mapping of bone biopsies from postmenopausal women [38,39].
same formulism as in Schorket al. [35]. The genomic inflation factorλGCfor each phenotype
were estimated based on intergenic SNPs as the median z-score squared divided by the expected median of a chi-square distribution with one degree of freedom and divided all test statistics byλGC. We have previously reported that intergenic SNPs, as defined in our
annota-tion protocol (Schork et al, 2013) are deplete of associaannota-tion with>30 complex traits/diseases,
and it seems that this is a generic feature for SNPs in this category. Furthermore, intergenic SNPs do not show skewed distribution towards small minor allele frequency (MAF) based on the 1000 Genomes Project (1KGP) [32,33,37].
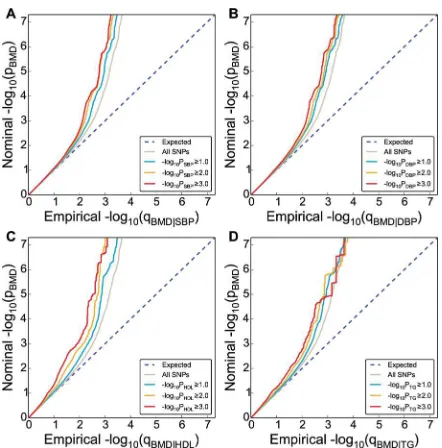
Conditional Q-Q Plots for Pleiotropic Enrichment. To assess pleiotropic enrichment, we used Q-Q plot conditional by‘pleiotropic’effects as described in detail earlier (Fig 1) [33,34,37]. For a given associated phenotype, enrichment for pleiotropic signals is present if the degree of deflection from the expected null line is dependent on SNP associations with the second phenotype. Specifically, we computed the empirical cumulative distribution of nominal p-values for a given phenotype for all SNPs and for SNPs with significance levels below the indicated cut-offs for the other phenotype (–log10(p)0,–log10(p)1,–log10(p)2,–log10(p) 3 corresponding to p<1, p<0.1, p<0.01, p<0.001, respectively). The nominal p-values
(–log10(p)) are plotted on the y-axis, and the empirical quantiles (–log10(q), where q = 1-cdf (p)) are plotted on the x-axis. To assess for polygenic effects below the standard GWAS signifi-cance threshold, we focused the conditional Q-Q plots on SNPs with nominal–log10(p)<7.3
(corresponding to p>5x10⁻⁸).
[image:5.612.199.420.74.298.2]Conditional Statistics–Test of Association with BMD. To improve detection of SNPs associated with BMD, we used a conditional False discovery rate (FDR) approach, leveraging pleiotropic phenotypes [32–34,37]. Specifically, the conditional FDR of a trait (e.g. BMD) for a SNP with p-valueP1on a second pleiotropic trait with p-valueP2, is computed as the posterior probability that the SNP is null for the first trait given that the p-values for both phenotypes Fig 1. Genetic enrichment.Conditional Q-Q plot of nominal versus empirical -log10p-values (corrected for
inflation) in bone mineral density (BMD, femoral neck) below the standard GWAS threshold of p<5x10⁻⁸as a function of significance of association with CVD risk factors, including systolic blood pressure (SBP), diastolic blood pressure (DBP), high density lipoproteins (HDL) and triglycerides (TG) at the level of -log10(p)0 (all
SNPs),–log10(p)1,–log10(p)2,–log10(p)3 corresponding to p1, p0.1, p0.01, p0.001,
respectively. Dotted lines indicate the null-hypothesis.
are as small as or smaller than the observed p-values,FDR(P1jP2) =π0(P2)P1/F(P1jP2), whereF
(P1jP2)is the conditionalcdfandπ0(P2)the conditional proportional of null SNPs for the first
phenotype given that p-value for the second phenotype areP2or smaller. The values ofFDR (P1jP2) were conservatively estimated by settingπ0(P2) equal one and replacingF(P1jP2) by
empirical conditionalcdf. The conditional FDR values for BMD on second pleiotropic traits (denoted byFDRBMD, where the dot denotes a second phenotype) were assigned, based on the combination of p-value for the SNP correlated to BMD and the associated trait, by interpola-tion into a 2-D look-up table (S1andS2Figs). All SNPs with FDR<0.01 (-log10(FDR)>2) in
BMD given the different associated phenotypes were identified. A significance threshold of FDR<0.01 corresponds to 1 false positive per 100 reported associations.
Annotation of Novel Loci. Based on 1KGP linkage disequilibrium (LD) structure, signifi-cant SNPs identified by conditional FDR were clustered into LD blocks at the LD-r2>0.2 level. This threshold was chosen since it has been used in a large number of reported GWAS, thus making our result comparable to previous studies, e.g.[25,39,40]. The blocks were num-bered as loci # inTable 1andS2,S3andS4Tables and any one block may contain more than one SNPs. Genes close to each SNPs were obtained from NCBI gene database. Blocks that do not contain SNPs or close-by genes to SNPs from primary study were deemed as novel loci in current study (Table 1andS3 Table). And, loci that contain SNPs or genes from primary study were considered as replication of primary findings (S2andS4Tables for FN and LS BMD, respectively). The same procedure was applied to both FN BMD and LS BMD phenotypes. To identify non-overlapping loci between FN BMD and LS BMD, the SNP rs-numbers and gene symbols for these two phenotypes were compared. Loci containing SNPs with same rs-number or same genes were considered overlapping.
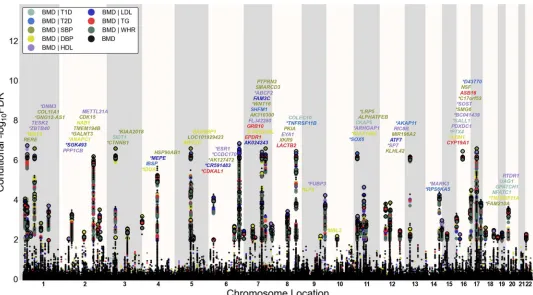
Conditional FDR Manhattan Plots. To illustrate the localization of the genetic markers associated with BMD given the CVD risk factor effect, we used a‘Conditional FDR Manhattan plot’, plotting all SNPs within an LD block in relation to their chromosomal location. As illus-trated inFig 2andS3 Fig, the large points represent the SNPs with FDR<0.01, whereas the
small points represent the non-significant SNPs. All SNPs without‘pruning’(removing all SNPs with LD-r2>0.2 based on 1KGP LD structure) are shown. The strongest signal in each
LD block is marked by larger points with black edges. This was identified by ranking all SNPs in increasing order, based on the conditional FDR value for BMD, and then removing SNPs in LD-r2>0.2 with any higher ranked SNP. Thus, the selected locus was the most significantly associated with BMD in each LD block (Fig 2andS3 Fig).
Validation by Expression Genetics. We looked for expressional association between the SNP associated genes and BMD in bone biopsies from postmenopausal women (n = 84) [38,39]. The Iliac biopsies were analyzed with Affymetrix microchips and log2transformed sig-nal values were correlated to BMD levels (Table 1,S2 Table). The primary data have been sub-mitted to the European Bioinformatics Institute (EMBL-EBI; ID: E-MEXP-1618).
Results
Pleiotropic Enrichment-Polygenic Overlap
Loci Associated with BMD
[image:7.612.34.580.94.504.2]To identify SNPs associated with FN BMD, we constructed a“conditional FDR”Manhattan plot showing the FDR conditional on each of the risk factors (Fig 2). We identified significant loci associated with FN BMD leveraging the reduced FDR obtained by the associated pheno-type. To estimate the number of independent loci, we pruned the associated SNPs (removed Table 1. Novel femoral neck BMD associated genes at conditional FDR<0.01.
Expressed QTL (Age and BMI adj.)
Loci # SNP Gene symbol Map Loc. BMD pvalue
BMD FDR
Min cond FDR
Waldstats Drivingphenotype Affymetrix ID r
1 rs10779702 RERE 1p36.23 7,78E-08 3,06E-04 1,60E-04 -5.26 HDL 200940_s_at -0.23
6 rs12137389 TESK2 1p32 1,88E-06 4,15E-03 4,01E-03 4.67 HDL 206758_at -0.11
9 rs11809524 COL11A1 1p21 8,21E-07 2,03E-03 1,34E-03 -4.83 SBP 37892_at 0.25
11 rs9309664 PPP1CB 2p23 7,55E-06 1,20E-02 8,22E-03 4.39 HDL 228222_at -0.30
15 rs11675051 TMEM194B 2q32.2 1,46E-06 3,47E-03 1,56E-03 -4.72 SBP 238014_at 0.09 15 rs13005335 NAB1 2q32.3-q33 1,54E-06 3,47E-03 1,56E-03 -4.71 SBP 209272_at 0.05 16 rs12995369 CDK15 2q33.2 1,07E-07 3,69E-04 2,80E-04 -5.2 SBP 1552559_a_at 0.16 17 rs7594560 METTL21A 2q33.3 3,42E-06 5,91E-03 3,74E-03 4.55 HDL 1553743_at -0.11
23 rs4957742 RAB9BP1 5q21.2 2,98E-06 5,91E-03 6,27E-03 -4.58 DBP NA NA
27 rs6583337 FAM20C 7p22.3 3,30E-06 5,91E-03 3,38E-03 4.56 LDL 229438_at 0.18
29 rs2282930 GRB10 7p12.2 5,20E-06 8,40E-03 7,20E-03 4.46 TG 210999_s_at -0.35
32 rs10953178 C7orf76 7q21.3 3,75E-11 6,36E-07 3,53E-07 -6.48 HDL NA NA
32 rs10464592 SHFM1 7q21.3 4,28E-10 2,35E-06 4,07E-06 6.11 SBP 202276_at -0.05
35 rs1670346 PTPRN2/ MIR595
7q36 1,73E-06 3,47E-03 1,80E-03 -4.68 SBP 203030_s_at 0.16
37 rs980299 EYA1 8q13.3 1,18E-07 4,45E-04 3,39E-04 5.19 HDL 214608_s_at -0.03
38 rs13272568 PKIA 8q21.11 1,29E-06 2,90E-03 2,52E-03 4.74 SBP 204612_at -0.35
40 rs665556 KLF4 9q31 6,68E-06 1,00E-02 5,84E-03 4.41 DBP 220266_s_at -0.34
49 rs600231 MALAT1 11q13.1 7,75E-06 1,20E-02 7,60E-03 -4.38 SBP 231735_s_at 0.29
51 rs258415 KLHL42 12p11.22 3,55E-08 1,69E-04 1,43E-04 -5.4 SBP NA NA
53 rs11614913 MIR196A2 12q13.13 4,20E-08 1,69E-04 1,25E-04 5.37 SBP NA NA
54 rs10746070 RIC8B 12q23.3 2,14E-06 4,15E-03 3,13E-03 -4.64 HDL 229637_at 0.04 58 rs7175531 CYP19A1 15q21 2,30E-06 4,96E-03 4,82E-03 -4.63 HDL 240705_at 0.25
58 rs10851498 MIR4713 15q21 2,73E-06 4,96E-03 4,45E-03 -4.59 TG NA NA
61 rs3198697 PDXDC1 16p13.11 1,01E-05 1,44E-02 5,00E-03 4.32 HDL 212053_at 0.08
67 rs199529 NSF 17q21 2,39E-06 4,96E-03 2,55E-03 4.62 SBP 202395_at -0.13
71 rs8090312 NFATC1 18q23 4,54E-06 8,40E-03 6,40E-03 -4.49 T1D 211105_s_at -0.15 74 rs756632 RTDR1/GNAZ 22q11.2 3,39E-06 5,91E-03 4,75E-03 -4.55 HDL 220105_at -0.01 74 rs4820539 RAB36 22q11.2 3,06E-06 5,91E-03 7,44E-03 4.57 HDL 211471_s_at 0.14
Independent complex or single gene loci (LD-r2<0.2) with SNP(s) with a conditional FDR (condFDR)<0.01 in bone mineral density (BMD, Femoral neck)
given the association in other phenotype. We defined the most significant BMD SNP in each LD block based on the minimum condFDR (min condFDR) for each phenotype. The most significant SNPs in each gene of the LD block are listed and the second phenotype which provides the minimal FDR signal (Driving phenotype). All loci with SNPs with condFDR<0.01 were used to define the number of the loci. The following abbreviations were used: Type 1 diabetes (T1D), type 2 diabetes (T2D), systolic blood pressure (SBP), diastolic blood pressure (DBP), low-density lipoproteins (LDL) cholesterol and high-density lipoproteins (HDL) cholesterol, chromosome location (Map Loc.). BMD FDR values<0.01 are in bold. Bold r values represent nominally significant (p<0.05) Pearson correlations. Gene titles and ontology function terms are presented inS5 Table. Wald stats: z-score transformed from p values NA: not applicable (undetected)
SNP with LD-r2>0.2), and identified a total of 74 independent loci with a conditional
FDR<0.01 of which 15 were complex loci and 59 single gene loci (marked inFig 2by points
with black edges). The 74 loci encompassed 84 different genes. Using the FDR method in FN BMD alone, 70 loci were identified (bold values in the“BMD-FDR”column,Table 1andS2 Table). The remaining 4 loci would not have been identified in the current sample without using the conditional FDR method. Similarly, the 95 independent loci for LS BMD encom-passes 107 different genes, and the extra number of loci identified with our conditional FDR compared with FDR method is 21 (bold value in the“BMD-FDR”column,S3andS4Tables, marked by points with black edges inS3 Fig). Since there are overlaps in loci between the two phenotypes, we identified a total of 122 independent loci for FN BMD and/or LS BMD, repre-senting 155 different genes in all.
SNP Detection and Verification
The previous study of BMD related SNPs by Estradaet al. [25] identified a total of 56 loci asso-ciated with FN BMD and/or LS BMD (49 loci with FN BMD and 48 loci with LS BMD). This was based on two-stage analysis (consisting up to 83,894 and 77,508 individuals), whereas in the stage-1 sample analysis (consisting 32,961 and 31,800 individuals), 20 and 26 loci were Fig 2.‘Conditional FDR Manhattan plot’of conditional–log10(FDR) values for bone mineral density (BMD, femoral neck) alone (small black dots)
and BMD given the associated phenotypes type 1 diabetes (T1D; BMD|T1D), type 2 diabetes (T2D; BMD|T2D), waist hip ratio (WHR, BMD|WHR), systolic blood pressure (SBP, BMD|SBP), diastolic blood pressure (DBP, BMD|DBP), high density lipoproteins (HDL, BMD|HDL), low density lipoproteins (LDL, BMD|LDL) and triglycerides (TG, BMD|TG).SNPs with conditional–log10FDR>2 (i.e. FDR<0.01) are shown with large points. A
black line around the large points indicates the most significant SNP in each LD block and this SNP was annotated with the closest gene which is listed above the symbols in each locus, except for the HLA region on chromosome 6. Gene symbols were obtained from NCBI gene databases and colored in line with the second phenotype which gives the minimal conditional FDR value. Details for the novel loci with–log10FDR>2 (i.e. FDR<0.01) are shown inTable 1andS1 Table. Genes previously reported by other studies were marked by stars (*).
[image:8.612.40.573.74.369.2]associated with FN BMD and LS BMD, respectively. Our analysis re-identified all (20 FN and 26 LS) loci reported in the primary study stage-1 analysis by Estrada et al. [25]. Also in the cross stage (I and II) analyses, all but 5 loci for FN BMD and 8 loci for LS were successfully re-identified (S2andS4Tables).
The FDR method identified 26 novel loci associated with FN BMD and 47 novel loci associ-ated with LS BMD, not reported in the previous BMD GWAS [25].
Gene Expression Analysis
Global gene expression profiling in iliac bone biopsies from 84 postmenopausal women [38] permitted us to calculate the correlation values between BMD and the mRNA levels of all genes associated with the identified loci, as shown in the rightmost columns ofTable 1(novel genes) andS2 Table(genes identified also by Estradaet al. [25]). We found a similar fraction of tran-scripts that were significantly correlated with FN BMD among the novel BMD associated genes (8 out of 26 reaching detection level), very similar to the Estrada study [25], 31% vs. 30%, respectively.
Functional Enrichment Analysis
The 155 genes encompassed by all loci at FDR<0.01 for FN and LS BMD were analyzed with
Ingenuity Pathway Analysis (IPA). The top-most significantly affected canonical pathway was
“Role of Osteoblasts and Chondrocyte in Rheumatoid Arthritis”(p = 4.1x10⁻¹²), which includes Wnt signaling, and the function and interaction of many of the identified genes in bone related cells (Table 2).
Out of all the loci at FDR<0.01 (LS and FN BMD), 48 associated gene transcripts were
sig-nificantly correlated to BMD in bone biopsies from postmenopausal women. This subset of genes was also analyzed by IPA, and a network of interacting genes includingNFATC1,RELA, NFKBandSMAD3as central nuclear hubs were generated (Fig 3).
All genes associated with FN or LS SNPs were analyzed for over-representation in KEGG pathways using Gene Codis (http://genecodis2.dacya.ucm.es/).“Wnt signaling pathway”
ranked 1stwith 9 genes and corrected chi square p = 8.4x10⁻²¹. Other highly ranked pathways included“Hedgehog signaling pathway”,“Osteoclast differentiation”,“Focal adhesion”and
“Endocrine and other factor-regulated calcium reabsorption”. Interestingly, the pathway“ Vas-cular Smooth Muscle Contraction”also emerged as significant (corrected chi square
p = 3.9x10⁻³).
Discussion
The current analyses of combined GWAS data from more than 250,000 individuals demon-strated genetic overlap between BMD and associated CVD risk factor phenotypes. This indi-cated that some of the co-morbidity observed in epidemiological and clinical studies may be due to shared risk gene variants. Based on the polygenic enrichment we identified 65 novel BMD loci (26 for FN BMD and 47 for LS BMD) not previously reported. Many of these loci are associated with genes that were validated in our expression assay. The high confirmation rate of the current FDR approach and the association to gene expression assay suggest these loci for follow-up analysis.
Table 2. Top Canonical pathways and Top diseases and Bio Functions from Ingenuity Pathway Analysis
Canonical Pathways Ratio(p-value) Molecules
Role of Osteoblasts, Osteoclasts and Chondrocytes
in Rheumatoid Arthritis 16/231 (4.10E-12) SFRP4,RELA,LRP5,TNFSF11,SPP1,AXIN1,WNT2B,WNT16,SP7, TNFRSF11A, NFATC1, WNT4, BMP7, SOST, CTNNB1, TNFRSF11B Role of Macrophages, Fibroblasts and Endothelial
Cells in Rheumatoid Arthritis
12/329 (1.86E-6) SFRP4, RELA, TNFSF11, LRP5, AXIN1, WNT2B, WNT16, WNT4, SOST,CTNNB1, NFATC1, TNFRSF11B
Wnt/Î2-catenin Signaling 9/174 (3.69E-6) SFRP4, LRP5, SOX6, AXIN1, WNT2B, WNT16,
WNT4, SOX9, CTNNB1
Basal Cell Carcinoma Signaling 6/75 (1.32E-5) AXIN1, WNT2B, WNT16, WNT4, BMP7, CTNNB1 Role of NANOG in Mammalian Embryonic Stem
Cell Pluripotency
7/117 (1.52E-5) AXIN1, WNT2B, WNT16, WNT4, BMP7, CTNNB1, ZFP42
Human Embryonic Stem Cell Pluripotency 7/153 (5.06E-5) AXIN1, SMAD3, WNT2B, WNT16, WNT4, BMP7, CTNNB1
Colorectal Cancer Metastasis Signaling 9/254 (5.87E-5) RELA, LRP5, AXIN1, SMAD3, WNT2B, ADCY6, WNT16, WNT4,CTNNB1
Protein Kinase A Signaling 11/389 (9.02E-5) DHH, RELA, PTPRD, SMAD3, ADCY6, PPP1CB, CTNNB1, EYA1,ANAPC1, NFATC1, AKAP11 Role of Wnt/GSK-3Î2Signaling in the Pathogenesis
of Influenza
5/82 (2.48E-4) AXIN1, WNT2B, WNT16, WNT4, CTNNB1
Regulation of the Epithelial-Mesenchymal Transition Pathway
7/190 (3.13E-4) RELA, AXIN1, SMAD3, WNT2B, WNT16, WNT4, JAG1
Categories in Top Diseases and Bio Functions Diseases
orFunctionsAnnotation
# Molecules (p-Value)
Molecules
Connective Tissue Development and Function, Embryonic Development, Organ Development, Organ Morphology, Organismal Development, Skeletal and Muscular System Development and Function, Tissue Development
abnormalmorphology ofbone 27 (1,86E-15) ARHGAP1, BMP7, CYP19A1, ESR1, EYA1, FAM20C, GALNT3,HOXC4, HOXC5, HOXC6, IBSP, IDUA, LRP5, MEOX1, MEPE,NAB1, PKDCC, SALL1, SMAD3, SOST, SOX6, SOX9, SPP1,TNFRSF11A, TNFRSF11B, TNFSF11, ULK4
Organismal Development, Skeletal and Muscular System Development and Function
abnormalmorphology of limb 18 (2,48E-13) BMP7, ESR1, EYA1, FAM20C, GALNT3, IBSP, IDUA, LRP4,LRP5, PKDCC, SALL1, SMAD3, SOST, SOX9, TNFRSF11A,TNFRSF11B, TNFSF11, WNT4
Skeletal and Muscular System Development and
Function abnormalmorphologyofskeleton 19 (1,16E-12) ARHGAP1, BMP7, ESR1, EYA1, FAM20C,GALNT3, HOXC4,HOXC5, HOXC6, IBSP, IDUA, LRP5, MEOX1, PKDCC, SMAD3,SOST, SOX9, TNFRSF11B, TNFSF11
Connective Tissue Development and Function, Skeletal and Muscular System Development and Function
bone mineraldensity 15 (4,51E-12) ARHGAP1, CYP19A1, ERCC1, ESR1, FAM20C, GALNT3, IBSP,LRP5, NAB1, SMAD3, SOST, SPP1, TNFRSF11A, TNFRSF11B,TNFSF11 Connective Tissue Development and Function,
Embryonic Development, Organ Development, Organ Morphology, Organismal Development, Skeletal and Muscular System Development and Function, Tissue Development
morphology oflimb bone 13 (1,36E-11) BMP7, ESR1, FAM20C, GALNT3, IBSP, IDUA, LRP5, PKDCC,SMAD3, SOST, SOX9, TNFRSF11B, TNFSF11
Connective Tissue Development and Function, Embryonic Development, Organ Development, Organismal Development, Skeletal and Muscular System Development and Function, Tissue Development
mineralization ofbone 13 (4,78E-11) BMP7, ESR1, FAM20C, IBSP, LRP5, MEPE, PK DCC, SMAD3,SOST, SOX9, SPP1, TNFRSF11B, WNT4
Skeletal and Muscular System Development and
Function abnormalmorphologyofappendicularskeleton 13 (5,66E-11) BMP7, ESR1, FAM20C, GALNT3, IBSP, IDUA,LRP5, PKDCC,SMAD3, SOST, SOX9, TNFRSF11B, TNFSF11
to osteoclast development and differentiation. They do, however, also have an important func-tion in osteoblasts. Strontium ranelate was shown to increaseNFATc1transactivation in osteo-blasts promoting increased expression ofWNT3AandWNT5Aas well as beta-catenin transcription in osteoblasts [42,43]. This positions NFATc1 activation upstream of canonical and non-canonical Wnt signaling pathways, networks whose interactions and strong associa-tions to bone and metabolism are clearly underscored in the present work. NFATc1 activation is also pathogenetically associated with blood pressure via binding to promoter elements on endothelin-1 (ET-1) thereby regulating its expression [44]. ET-1 regulates salt excretion in the kidney collecting duct [45]. Through regulation of salt excretion, NFATc1 also has a role in mineral metabolism, and thus possibly also affecting the body’s Ca++balance and metabolism. NFATc1 blockade has been shown to completely prevent oxidized LDL-induced osteogenic transformation of human coronary artery smooth muscle cells as well as oxidized LDL-induced stimulation of osteoblast differentiation [46]. NFATc1 may therefore be a master regulator contributing to predisposition in several of these conditions. Interestingly, the application of this approach has uncovered a uniquely rich and coherent gene network which fully reflects the biological relationship between NFATc1 and the Wnt signaling pathways governing osteo-clast/osteoblast activity and engagement in metabolism. Future work should focus on the iden-tification of surrogate markers (transcripts and proteins) of aberrant NFATc1 activation, which in combination with genotyping could provide more accurate risk predictors for the range of conditions affected by this important transcription factor. Vascular smooth muscle Table 2. (Continued)
Cellular Development differentiation ofconnective
tissuecells 23 (1,94E-10) AREG/AREGB, AXIN1, BMP7, CTNNB1,FAM20C, JAG1, KLF4,LGR4, LRP5, MEF2C, NFATC1, PKDCC, RELA, SFRP4, SMAD3,SOST, SOX9, SP7, SPP1, TNFRSF11A, TNFRSF11B, TNFSF11,WNT4
Organismal Injury and Abnormalities calcinosis 9 (3,26E-10) BMP7, CTNNB1, GALNT3, IBSP, LRP5, SOX9, SPP1,TNFRSF11B, TNFSF11
Cardiovascular Disease degenerativemitral valvedisease
5 (3,48E-10) CTNNB1, IBSP, LRP5, SOX9, SPP1
The genes associated with all identified loci (min Cond FDR<0.01) were subjected to Ingenuity Pathway Analysis. The topmost significantly affected canonical pathways (upper panel) and Categories in Top Diseases and Bio Functions (lower panel) from the analysis are shown.
doi:10.1371/journal.pone.0144531.t002
Fig 3. Network analysis IPA-generated network illustrating molecular interactions among the genes correlating inversely (green) or positively (red) to FN or LS BMD.
[image:11.612.202.395.527.679.2]contraction was identified as significantly affected among the BMD associated genes. This pro-cess is relevant to bone because the contractile elements used in muscle are also a characteristic feature of the osteocytes which constitute 90–95% of bone cells [47], and are dynamic star shaped cells with stretching and contracting protrusions [48]. It is not known if the mechanisms for oste-ocyte motility are more characteristic to smooth or striated muscle. However, both smooth and striated muscle share common features with osteocytes[49], and muscle-related gene expression in bone has been shown to be affected in postmenopausal osteoporotic women [39] as well as in human iliac bone with reduced BMD due to primary hyperparathyroidism [50].
T1D and T2D are complex metabolic disorders with multiple possible interactions with BMD. However, our results are only to a minor degree influenced by these disorders, since only one of the 26 novel FN BMD associated SNPs has diabetes (T1D) as the driving phenotype (Table 1andFig 2) and only 9 (~10%) of the novel the LS BMD associated SNPs has T1D or T2D as the driving phenotype (S3 TableandS3 Fig).
Our results confirm the feasibility of using a genetic epidemiology framework that leverages overlap in genetic signal from independent GWAS of correlated phenotypes for revealing genetic basis of complex phenotypes/diseases. The increased power provided by additional GWAS of associated phenotypes together with the FDR method, roughly doubled the previous number of BMD associated loci [25]. Using the same methods for functional validation of the current findings obtained with our statistical approach, we report a similar rate of significantly expressed genes as in the original BMD report [25]. Furthermore,“Role of Osteoblasts and Chondrocyte in Rheumatoid Arthritis”was the top-most significantly affected canonical path-way when subjecting the 155 genes encompassed by all loci at FDR<0.01 for FN and LS BMD
to IPA. This pathway was also among the most significantly affected in a study by Gupta et al. [51], using a Bayesian block-clustering algorithm to analyze GWAS of multiple phenotypes related to bone, thus supporting our results. It should be noted that, when analyzing BMD associated genes by IPA and similar methods, intergenic, and also intragenic SNPs, not neces-sarily affects transcription of the closest gene. Gene polymorphisms have been shown to affect more distant genes located several Mbp away [52,53]. More detailed experimental validation of the current findings is warranted. Our method for correction of the overlap in some of the GWAS cohorts examined, should exclude contribution from environmental factors. We also controlled for inflation using genomic control correction of each primary single phenotype GWAS. Further, the overlapping loci were spread over all autosomes in the different pheno-types. If a single control group used in several samples were driving the findings, it would be expected that the same region would have been significant across different phenotypes. This is particularly evident in the GWAS of blood lipids, where the same sample was used to discover new genes for three different phenotypes [26], but the pattern of loci was quite different across the different traits. This suggests that the findings are not due to common genetic variation in potentially overlapping control groups.
In conclusion, we identified 26 and 47 novel genomic loci associated with BMD in FN and LS, respectively, by leveraging genetic pleiotropy with several CVD-related traits, including T1D, T2D, SBP, DBP, LDL, TG, WHR and HDL. Association analyses point to genes involved in metabolism and activated immunological pathways. The results warrant further experimen-tal investigations to clarify the clinical implications, and could lead to improved screening pro-grams and prevention strategies.
Supporting Information
type 1 diabetes (T1D), B. type 2 diabetes (T2D), C. systolic blood pressure (SBP), D. diastolic blood pressure (DBP), E. high density lipoprotein (HDL), F. low density lipoprotein (LDL), G. triglycerides (TG), and H. waist hip ratio (WHR) we assigned a conditional FDR value to each SNP associated with femoral neck BMD, by interpolation into a 2-D look-up table. Color scale refers to the conditional FDR values.
(TIF)
S2 Fig. Conditional FDR 2-D lookup table for Lumbar Spine BMD.Based on the combina-tion of p-value for the SNPs in lumbar spine BMD (PBMD) and that of the pleiotropic trait: A. type 1 diabetes (T1D), B. type 2 diabetes (T2D), C. systolic blood pressure (SBP), D. diastolic blood pressure (DBP), E. high density lipoprotein (HDL), F. low density lipoprotein (LDL), G. triglycerides (TG), and H. waist hip ratio (WHR), we assigned a conditional FDR value to each SNP associated with lumbar spine BMD, by interpolation into a 2-D look-up table. Color scale refers to the conditional FDR values.
(TIF)
S3 Fig. Conditional FDR Manhattan plots for lumbar spine BMD.‘Conditional Manhattan plot’of conditional–log10 (FDR) values for bone mineral density (BMD, lumbar spine) alone (small black dots) and BMD given the associated phenotypes type 1 diabetes (T1D; BMD| T1D), type 2 diabetes (T2D; BMD|T2D), systolic blood pressure (SBP; BMD|SBP), diastolic blood pressure (DBP; BMD|DBP), high density lipoprotein (HDL; BMD|HDL), low density lipoprotein (LDL; BMD|LDL), triglycerides (TG; BMD|TG), and waist hip ratio (WHR; BMD| WHR). SNPs with conditional–log10 FDR>2 (i.e. FDR<0.01) are shown with large points.
A black line around the large points indicates the most significant SNP in each LD block and this SNP was annotated with the closest gene, which is listed above the symbols in each locus. Gene symbols were obtained from HGNC gene databases and colored in line with the second phenotype, which gives the minimal conditional FDR value. Genes previously reported by other studies were marked by stars ().
(TIF)
S4 Fig. Genetic pleiotropy enrichment.Conditional Q-Q plot of nominal versus empirical -log10 p-values (corrected for inflation) in bone mineral density (BMD, femoral neck) below the standard GWAS threshold of p<5x10⁻⁸ as a function of significance of association with
CVD risk factors, including type 1 diabetes (T1D), type 2 diabetes (T2D), low density lipopro-tein (LDL) and waist hip ratio (WHR) at the level of -log10(p)0 (all SNPs),–log10(p)1,–
log10(p)2,–log10(p)3 corresponding to p1, p0.1, p0.01, p0.001, respectively. Dotted lines indicate the null-hypothesis.
(TIF)
S5 Fig. QQ plots for Lumbar Spine-BMD.Conditional Q-Q plot of nominal versus empirical -log10p-values (corrected for inflation) in bone mineral density (BMD, lumbar spine) below the standard GWAS threshold of p<5x10⁻⁸as a function of significance of association with A.
type 1 diabetes (T1D), B. type 2 diabetes (T2D), C. systolic blood pressure (SBP), D. diastolic blood pressure (DBP), E. high density lipoprotein (HDL), F. low density lipoprotein (LDL), G. triglycerides (TG), and H. waist hip ratio (WHR) at the level of -log10(p)0 (all SNPs),–
log10(p)1,–log10(p)2,–log10(p)3 corresponding to p1, p0.1, p0.01, p0.001, respectively. Dotted lines indicate the null-hypothesis.
(TIF)
femoral neck) below the standard GWAS threshold of p<5x10⁻⁸as a function of significance
of association with Coronary Artery Disease (CAD) at the level of -log10(p)0 (all SNPs),– log10(p)1,–log10(p)2,–log10(p)3 corresponding to p1, p0.1, p0.01, p0.001, respectively. Dotted lines indicate the null-hypothesis.
(TIF)
S7 Fig. Conditional QQ plot for lumbar spine BMD on CAD.Conditional Q-Q plot of nom-inal versus empirical -log10p-values (corrected for inflation) in bone mineral density (BMD, lumbar spine) below the standard GWAS threshold of p<5x10⁻⁸as a function of significance
of association with Coronary Artery Disease (CAD) at the level of -log10(p)0 (all SNPs),–
log10(p)1,–log10(p)2,–log10(p)3 corresponding to p1, p0.1, p0.01, p0.001, respectively. Dotted lines indicate the null-hypothesis.
(TIF)
S1 File. Details of Statistical Analysis
(DOC)
S1 Table. Summary data from all GWAS used in the current study
(DOCX)
S2 Table. All identified loci associated with femoral neck BMD
(DOCX)
S3 Table. Identified loci containing novel SNPs or genes associated with lumbar spine BMD
(DOCX)
S4 Table. Identified loci containing known SNPs or genes associated with lumbar spine BMD
(DOCX)
S5 Table. Gene titles and gene ontology function terms of genes associated with LS an FN BMD loci at FDR<0.01
(DOCX)
Acknowledgments
The authors would like to thank the genome-wide association study consortia for access to summary statistics data. Andreassen and Dale had full access to all the data in the study and take responsibility for the integrity of the data and the accuracy of the data analysis.
Membership of the GEFOS Consortium of Erasmus MC University Medical Center, Rotter-dam, Netherlands: GEFOS lead author: Fernando Rivadeneira (f.rivadeneira@erasmusmc.nl)
Lacroix31, Seung Hun Lee48, Ping C Leung52, Joshua R Lewis24,25, Laura Masi53, Simona Men-cej-Bedrac54, Tuan V Nguyen34,35, Xavier Nogues40, Millan S Patel55, Janez Prezelj56, Lynda M Rose57, Serena Scollen58, Kristin Siggeirsdottir32, Albert V Smith32,33, Olle Svensson59, Stella Trompet60,61, Olivia Trummer62, Natasja M van Schoor63, Jean Woo64, Kun Zhu24,25, Susana Balcells65, Maria Luisa Brandi53, Brendan M Buckley66, Sulin Cheng67,68, Claus Christiansen69, Cyrus Cooper45, George Dedoussis70, Ian Ford71, Morten Frost72,73, David Goltzman74, Jesús González-Macías75,76, Mika Kähönen77,78, Magnus Karlsson79, Elza Khusnutdinova46,47, Jung-Min Koh48, Panagoula Kollia49, Bente Lomholt Langdahl44, William D Leslie80, Paul Lips81,82, Östen Ljunggren83, Roman S Lorenc50, Janja Marc54, Dan Mellström18, Barbara Obermayer-Pietsch62, José M Olmos75,76, Ulrika Pettersson-Kymmer84, David M Reid43, José A Rian-cho75,76, Paul M Ridker57,85, François Rousseau41,86,87, P Eline Slagboom88,3, Nelson LS Tang89,90, Roser Urreizti65, Wim Van Hul91, Jorma Viikari92,93, María T Zarrabeitia94, Yurii S Aulchenko2, Martha Castano-Betancourt1,2,3, Elin Grundberg95,96,97, Lizbeth Herrera1, Thor-valdur Ingvarsson98,99,33, Hrefna Johannsdottir4, Tony Kwan95,96, Rui Li100, Robert Luben16, Carolina Medina-Gómez1,2, Stefan Th Palsson4, Sjur Reppe101, Jerome I Rotter102, Gunnar Sigurdsson103,33, Joyce B J van Meurs1,2,3, Dominique Verlaan95,96, Frances MK Williams17, Andrew R Wood104, Yanhua Zhou14, Kaare M Gautvik101,105,106, Tomi Pastinen95,96,107, Sou-mya Raychaudhuri108,109, Jane A Cauley110, Daniel I Chasman57,85, Graeme R Clark8, Steven R Cummings111, Patrick Danoy8, Elaine M Dennison45, Richard Eastell112, John A Eisman34,35,36, Vilmundur Gudnason32,33, Albert Hofman2,3, Rebecca D Jackson113,114, Graeme Jones115, J Wouter Jukema60,116,117, Kay-Tee Khaw16, Terho Lehtimäki118,119, Yongmei Liu120, Mattias Lorentzon18, Eugene McCloskey112,121, Braxton D Mitchell22, Kannabiran Nandakumar6,7, Geoffrey C Nicholson122, Ben A Oostra123, Munro Peacock124, Huibert A P Pols1,2, Richard L Prince24,25, Olli Raitakari28,29, Ian R Reid125, John Robbins126, Philip N Sambrook127, Pak Chung Sham128,129, Alan R Shuldiner22,130, Frances A Tylavsky131, Cornelia M van Duijn2, Nick J Wareham132, L Adrienne Cupples14,133, Michael J Econs124,12, David M Evans11, Tamara B Harris39, Annie Wai Chee Kung20,21, Bruce M Psaty134,135, Jonathan Reeve136, Timothy D Spector17, Elizabeth A Streeten22,130, M Carola Zillikens1, Unnur Thorsteinsdottir4,33, Claes Ohlsson18, David Karasik6,7, J Brent Richards137,17, Matthew A Brown8, Kari Stefansson4,33, André G Uitterlinden1,2,3, Stuart H Ralston10, John P A Ioannidis138,5, Douglas P Kiel6,7, Fer-nando Rivadeneira1,2,3
Affiliations:1Department of Internal Medicine, Erasmus Medical Center, Rotterdam, The Netherlands.2Department of Epidemiology, Erasmus Medical Center, Rotterdam, The Nether-lands.3Netherlands Genomics Initiative (NGI)-sponsored Netherlands Consortium for Healthy Aging (NCHA), Leiden, The Netherlands.4deCODE Genetics, Reykjavik, Iceland. 5Department of Hygiene and Epidemiology, University of Ioannina, Ioannina, Greece.6
Insti-tute for Aging Research, Hebrew SeniorLife, Boston, USA.7Department of Medicine, Harvard Medical School, Boston, USA.8Human Genetics Group, University of Queensland Diamantina Institute, Brisbane, Australia.9Department of Endocrinology, Royal Brisbane and Women's Hospital, Brisbane, Australia.10Rheumatic Diseases Unit, Institute of Genetics and Molecular Medicine, University of Edinburgh, Edinburgh, UK.11Medical Research Council (MRC) Cen-tre for Causal Analyses in Translational Epidemiology, University of Bristol, Bristol, UK. 12Department of Medical and Molecular Genetics, Indiana University School of Medicine,
Indianapolis, USA.13Cardiovascular Health Research Unit, University of Washington, Seattle, USA.14Department of Biostatistics, Boston University School of Public Health, Boston, USA. 15Department of Human Genetics, University of Pittsburgh, Pittsburgh, PA, USA.16
University of Gothenburg, Gothenburg, Sweden.19Australian Centre for Ecogenomics, Univer-sity of Queensland, Brisbane, Australia.20Department of Medicine, The University of Hong Kong, Hong Kong, China.21Research Centre of Heart, Brain, Hormone and Healthy Aging, The University of Hong Kong, Hong Kong, China.22Department of Medicine, Division of Endocrinology, Diabetes and Nutrition, University of Maryland School of Medicine, Baltimore, MD, USA.23Department of Human Genetics, Lady Davis Institute, McGill University, Mon-treal, Canada.24School of Medicine and Pharmacology, University of Western Australia, Perth, Australia.25Department of Endocrinology and Diabetes, Sir Charles Gairdner Hospital, Perth, Australia.26Centre for Population Health Sciences, University of Edinburgh, Edinburgh, UK. 27MRC Human Genetics Unit, MRC Institute of Genetics and Molecular Medicine at the
Uni-versity of Edinburgh, Edinburgh, UK.28Department of Clinical Physiology, Turku University Hospital, Turku, Finland.29Research Centre of Applied and Preventive Cardiovascular Medi-cine, University of Turku, Turku, Finland.30Department of Medical Rehabilitation, Oulu Uni-versity Hospital and Institute of Health Sciences, Oulu, Finland.31Division of Public Health Sciences, Fred Hutchinson Cancer Research Center, Seattle, USA.32Icelandic Heart Associa-tion, Kopavogur, Iceland.33Faculty of Medicine, University of Iceland, Reykjavik, Iceland. 34Osteoporosis and Bone Biology Program, Garvan Institute of Medical Research, Sydney,
Aus-tralia.35Department of Medicine, University of New South Wales, Sydney, Australia.36 Depart-ment of Endocrinology, St Vincents Hospital, Sydney, Australia.37Department of Orthopaedic Surgery, Medical School University of Thessalia, Larissa, Greece.38Translational Genomics Research Institute, Phoenix, USA.39Laboratory of Epidemiology, Demography, and Biometry, National Institute on Aging, Bethesda, MD, USA.40Department of Internal Medicine, Hospital del Mar, Instituto Municipal de Investigación Médica (IMIM), Red Temática de Investigación Cooperativa en Envejecimiento y Fragilidad (RETICEF), Universitat Autònoma de Barcelona (UAB), Barcelone, Spain.41Unité de recherche en génétique humaine et moléculaire, Centre de recherche du Centre hospitalier universitaire de Québec—Hôpital St-François-d'Assise (CHUQ/HSFA), Québec City, Canada.42Department of Public Health and Clinical Medicine, Umeå Unviersity, Umeå, Sweden.43Musculoskeletal Research Programme, Division of Applied Medicine, University of Aberdeen, Aberdeen, UK.44Department of Endocrinology and Inter-nal Medicine, Aarhus University Hospital, Aarhus C, Denmark.45MRC Lifecourse Epidemiol-ogy Unit, University of Southampton, Southampton, UK.46Ufa Scientific Centre of Russian Academy of Sciences, Institute of Biochemistry and Genetics, Ufa, Russia.47Biological Depart-ment, Bashkir State University, Ufa, Russia.48Division of Endocrinology and Metabolism, Asan Medical Center, University of Ulsan College of Medicine, Seoul, South Korea.49 Depart-ment of Genetics and Biotechnology, Faculty of Biology, University of Athens, Athens, Greece. 50Department of Biochemistry and Experimental Medicine, The Children's Memorial Health
Onderzoek (EMGO) Institute for Health and Care Research, Vrije Universiteit (VU) Univer-sity Medical Center, Amsterdam, The Netherlands.64Department of Medicine and Therapeu-tics, The Chinese University of Hong Kong, Hong Kong SAR, China.65Department of
Genetics, University of Barcelona, Centro de Investigación Biomédica en Red de Enfermedades Raras (CIBERER), Institut de Biomedicina de la Universitat de Barcelona (IBUB), Barcelone, Spain.66Department of Pharmacology and Therapeutics, University College Cork, Cork, Ire-land.67Department of Health Sciences, University of Jyväskylä, Jyväskylä, Finland.68 Depart-ment of Orthopaedics and raumatology, Kuopio University Hospital, Kuopio, Finland. 69Center for Clinical and Basic Research (CCBR)-Synarc, Ballerup, Denmark.70Department of
Nutrition and Dietetics, Harokopio University, Athens, Greece.71Robertson Center for Biosta-tistics, University of Glasgow, Glasgow, United Kingdom.72Department of Endocrinology, Odense University Hospital, Odense, Denmark.73Clinical Institute, University of Southern Denmark, Odense, Denmark.74Department of Medicine, McGill University, Montreal, Can-ada.75Department of Medicine, University of Cantabria, Santander, Spain.76Department of Internal Medicine, Hospital Universitario Marqués de Valdecilla and Instituto de Formación e Investigación Marqués de Valdecilla (IFIMAV), Santander, Spain.77Department of Clinical Physiology, Tampere University Hospital, Tampere, Finland.78Department of Clinical Physi-ology, University of Tampere School of Medicine, Tampere, Finland.79Clinical and Molecular Osteoporosis Research Unit, Department of Clinical Sciences and Department of Orthopae-dics, Lund University, Malmö, Sweden.80Department of Internal Medicine, University of Manitoba, Winnipeg, Canada.81Department of Endocrinology, Vrije Universiteit (VU) Uni-versity Medical Center, Amsterdam, The Netherlands.82Extramuraal Geneeskundig Onder-zoek (EMGO) Institute for Health and Care Research, Vrije Universiteit (VU) University Medical Center, Amsterdam, The Netherlands.83Department of Medical Sciences, University of Uppsala, Uppsala, Sweden.84Department of Pharmacology and Neuroscience, Umeå Uni-versity, Umeå, Sweden.85Harvard Medical School, Boston, USA.86Department of Molecular Biology, Medical Biochemistry and Pathology, Université Laval, Québec City, Canada.87The APOGEE-Net/CanGèneTest Network on Genetic Health Services and Policy, Université Laval, Québec City, Canada.88Department of Molecular Epidemiology, Leiden University Medical Center, Leiden, The Netherlands.89Department of Chemical Pathology, The Chinese Univer-sity of Hong Kong, Hong Kong SAR, China.90Li Ka Shing Institute of Health Sciences, The Chinese University of Hong Kong, Hong Kong SAR, China.91Department of Medical Genetics, University of Antwerp, Antwerp, Belgium.92Department of Medicine, Turku University Hos-pital, Turku, Finland.93Department of Medicine, University of Turku, Turku, Finland. 94Department of Legal Medicine, University of Cantabria, Santander, Spain.95Department of
Epidemiology, University of Pittsburgh, Pittsburgh, USA.111California Pacific Medical Center, San Francisco, CA, USA.112National Institute for Health and Research (NIHR) Musculoskele-tal Biomedical Research Unit, University of Sheffield, Sheffield, UK.113Department of Internal Medicine, The Ohio State University, Columbus, USA.114Center for Clinical and Translational Science, The Ohio State University, Columbus, USA.115Menzies Research Institute, University of Tasmania, Hobart, Australia.116Durrer Center for Cardiogenetic Research, Amsterdam, The Netherlands.117Interuniversity Cardiology Institute of the Netherlands, Utrecht, The Netherlands.118Department of Clinical Chemistry, Tampere University Hospital, Tampere, Finland.119Department of Clinical Chemistry, University of Tampere School of Medicine, Tampere, Finland.120Center for Human Genomics, Wake Forest University School of Medi-cine, Winston-Salem, NC, USA.121Academic Unit of Bone Metabolism, Metabolic Bone Cen-tre, University of Sheffield, Sheffield, UK.122Rural Clinical School, The University of
Queensland, Toowoomba, Australia.123Department of Clinical Genetics, Erasmus Medical Center, Rotterdam, The Netherlands.124Department of Medicine, Indiana University School of Medicine, Indianapolis, USA.125Department of Medicine, University of Auckland, Auck-land, New Zealand.126Department of Medicine, University of Davis, Sacramento, CA, USA. 127Kolling Institute, Royal North Shore Hospital, University of Sydney, Sydney, Australia.
128Department of Psychiatry, The University of Hong Kong, Hong Kong, China.129Centre for
Reproduction, Development and Growth, The University of Hong Kong, Hong Kong, China. 130Geriatric Research and Education Clinical Center (GRECC), Veterans Administration
Med-ical Center, Baltimore, MD, USA.131Department of Preventive Medicine, University of Ten-nessee College of Medicine, Memphis, TN, USA.132MRC Epidemiology Unit Box 285, Medical Research Council, Cambridge, UK.133Framingham Heart Study, Framingham, USA.
134Departments of Medicine, Epidemiology and Health Services, University of Washington,
Seattle, USA.135Group Health Research Institute, Group Health Cooperative, Seattle, USA. 136Medicine box 157, University of Cambridge, Cambridge, UK.137Departments of Medicine,
Human Genetics, Epidemiology and Biostatistics, Lady Davis Institute, McGill University, Montreal, Canada.138Stanford Prevention Research Center, Stanford University, Stanford, USA.
Author Contributions
Conceived and designed the experiments: AMD OAA. Performed the experiments: YW ML VZ SR AMD. Analyzed the data: IGM YW FB AJS RSD WKT VZ AMD KMG LKM SD. Con-tributed reagents/materials/analysis tools: SR KMG SD. Wrote the paper: OAA SR YW.
References
1. Kanis JA, Oden A, Johnell O, Johansson H, De Laet C, Brown J, et al. (2007) The use of clinical risk fac-tors enhances the performance of BMD in the prediction of hip and osteoporotic fractures in men and women. Osteoporos Int 18: 1033–1046. PMID:17323110
2. Compston J (2010) Osteoporosis: social and economic impact. Radiol Clin North Am 48: 477–482.
S0033-8389(10)00011-4 [pii]; doi:10.1016/j.rcl.2010.02.010PMID:20609886
3. Tanko LB, Christiansen C, Cox DA, Geiger MJ, McNabb MA, Cummings SR (2005) Relationship between osteoporosis and cardiovascular disease in postmenopausal women. J Bone Miner Res 20: 1912–1920. doi:10.1359/JBMR.050711PMID:16234963
4. Kado DM, Browner WS, Blackwell T, Gore R, Cummings SR (2000) Rate of bone loss is associated with mortality in older women: a prospective study. J Bone Miner Res 15: 1974–1980. doi:10.1359/
jbmr.2000.15.10.1974PMID:11028450
6. Li S, Guo H, Liu Y, Wu F, Zhang H, Zhang Z, et al. (2015) Relationships of serum lipid profiles and bone mineral density in postmenopausal Chinese women. Clin Endocrinol (Oxf) 82: 53–58. doi:10.1111/
cen.12616
7. Kim T, Park S, Pak YS, Lee S, Lee EH (2013) Association between metabolic syndrome and bone min-eral density in Korea: the Fourth Korea National Health and Nutrition Examination Survey (KNHANES IV), 2008. J Bone Miner Metab 31: 652–662. doi:10.1007/s00774-013-0459-4PMID:23543212
8. Kim YH, Nam GE, Cho KH, Choi YS, Kim SM, Han BD, et al. (2013) Low bone mineral density is associ-ated with dyslipidemia in South Korean men: the 2008–2010 Korean National Health and Nutrition
Examination Survey. Endocr J 60: 1179–1189. DN/JST.JSTAGE/endocrj/EJ13-0224 [pii]. PMID:
23877056
9. Buizert PJ, van Schoor NM, Lips P, Deeg DJ, Eekhoff EM (2009) Lipid levels: a link between cardiovas-cular disease and osteoporosis? J Bone Miner Res 24: 1103–1109. doi:10.1359/jbmr.081262PMID:
19113906
10. Garg MK, Marwaha RK, Tandon N, Bhadra K, Mahalle N (2014) Relationship of lipid parameters with bone mineral density in Indian population. Indian J Endocrinol Metab 18: 325–332. doi:
10.4103/2230-8210.131165;IJEM-18-325 [pii]. PMID:24944926
11. Liu J, Zhu LP, Yang XL, Huang HL, Ye DQ (2013) HMG-CoA reductase inhibitors (statins) and bone mineral density: a meta-analysis. Bone 54: 151–156. S8756-3282(13)00061-6 [pii]; doi:10.1016/j.
bone.2013.01.044PMID:23388418
12. Lee HT, Shin J, Min SY, Lim YH, Kim KS, Kim SG, et al. (2014) The relationship between bone mineral density and blood pressure in the Korean elderly population: the Korea National Health and Nutrition Examination Survey, 2008–2011. Clin Exp Hypertens 1–6. doi:10.3109/10641963.2014.933971
PMID:25057784
13. Yazici S, Yazici M, Korkmaz U, Engin EM, Erdem BA, Erden I, et al. (2011) Relationship between blood pressure levels and bone mineral density in postmenopausal Turkish women. Arch Med Sci 7: 264–
270. doi:10.5114/aoms.2011.22077;AMS-7-2-264 [pii]. PMID:22291766
14. Kaplan S, Smith SR, Zuckerman IH (2010) Blood pressure and bone mineral density in premenopausal and postmenopausal women. J Womens Health (Larchmt) 19: 1209–1215. doi:10.1089/jwh.2009.
1587
15. Jackuliak P, Payer J (2014) Osteoporosis, fractures, and diabetes. Int J Endocrinol 2014: 820615. doi:
10.1155/2014/820615PMID:25050121
16. Vestergaard P (2007) Discrepancies in bone mineral density and fracture risk in patients with type 1 and type 2 diabetes—a meta-analysis. Osteoporos Int 18: 427–444. doi:10.1007/s00198-006-0253-4
PMID:17068657
17. Oei L, Zillikens MC, Dehghan A, Buitendijk GH, Castano-Betancourt MC, Estrada K, et al. (2013) High bone mineral density and fracture risk in type 2 diabetes as skeletal complications of inadequate glu-cose control: the Rotterdam Study. Diabetes Care 36: 1619–1628. dc12-1188 [pii]; doi:
10.2337/dc12-1188PMID:23315602
18. Khan TS, Fraser LA (2015) Type 1 diabetes and osteoporosis: from molecular pathways to bone phe-notype. J Osteoporos 2015: 174186. doi:10.1155/2015/174186PMID:25874154
19. Sayers A, Lawlor DA, Sattar N, Tobias JH (2012) The association between insulin levels and cortical bone: findings from a cross-sectional analysis of pQCT parameters in adolescents. J Bone Miner Res 27: 610–618. doi:10.1002/jbmr.1467PMID:22095452
20. Billings LK, Hsu YH, Ackerman RJ, Dupuis J, Voight BF, Rasmussen-Torvik LJ, et al. (2012) Impact of common variation in bone-related genes on type 2 diabetes and related traits. Diabetes 61: 2176–
2186. db11-1515 [pii]; doi:10.2337/db11-1515PMID:22698912
21. Kim CJ, Oh KW, Rhee EJ, Kim KH, Jo SK, Jung CH, et al. (2009) Relationship between body composi-tion and bone mineral density (BMD) in perimenopausal Korean women. Clin Endocrinol (Oxf) 71: 18–
26. CEN3452 [pii]; doi:10.1111/j.1365-2265.2008.03452.x
22. Zillikens MC, Uitterlinden AG, van Leeuwen JP, Berends AL, Henneman P, van Dijk KW, et al. (2010) The role of body mass index, insulin, and adiponectin in the relation between fat distribution and bone mineral density. Calcif Tissue Int 86: 116–125. doi:10.1007/s00223-009-9319-6PMID:19957167
23. Janicka A, Wren TA, Sanchez MM, Dorey F, Kim PS, Mittelman SD, et al. (2007) Fat mass is not benefi-cial to bone in adolescents and young adults. J Clin Endocrinol Metab 92: 143–147. jc.2006-0794 [pii];
doi:10.1210/jc.2006-0794PMID:17047019
25. Estrada K, Styrkarsdottir U, Evangelou E, Hsu YH, Duncan EL, Ntzani EE, et al. (2012) Genome-wide meta-analysis identifies 56 bone mineral density loci and reveals 14 loci associated with risk of fracture. Nat Genet 44: 491–501. ng.2249 [pii]; doi:10.1038/ng.2249PMID:22504420
26. Teslovich TM, Musunuru K, Smith AV, Edmondson AC, Stylianou IM, Koseki M, et al. (2010) Biological, clinical and population relevance of 95 loci for blood lipids. Nature 466: 707–713. nature09270 [pii];
doi:10.1038/nature09270PMID:20686565
27. Barrett JC, Clayton DG, Concannon P, Akolkar B, Cooper JD, Erlich HA, et al. (2009) Genome-wide association study and meta-analysis find that over 40 loci affect risk of type 1 diabetes. Nat Genet 41: 703–707. ng.381 [pii]; doi:10.1038/ng.381PMID:19430480
28. Voight BF, Scott LJ, Steinthorsdottir V, Morris AP, Dina C, Welch RP, et al. (2010) Twelve type 2 diabe-tes susceptibility loci identified through large-scale association analysis. Nat Genet 42: 579–589.
ng.609 [pii]; doi:10.1038/ng.609PMID:20581827
29. Ehret GB, Munroe PB, Rice KM, Bochud M, Johnson AD, Chasman DI, Smith AV, et al. (2011) Genetic variants in novel pathways influence blood pressure and cardiovascular disease risk. Nature 478: 103–109. nature10405 [pii]; doi:10.1038/nature10405PMID:21909115
30. Sivakumaran S, Agakov F, Theodoratou E, Prendergast JG, Zgaga L, Manolio T, et al. (2011) Abun-dant pleiotropy in human complex diseases and traits. Am J Hum Genet 89: 607–618. S0002-9297(11)
00438-1 [pii]; doi:10.1016/j.ajhg.2011.10.004PMID:22077970
31. Schizophrenia Psychiatric Wide Association Study (GWAS) Consortium. (2011) Genome-wide association study identifies five new schizophrenia loci. Nat Genet 43: 969–976. ng.940 [pii]; doi:
10.1038/ng.940PMID:21926974
32. Liu JZ, Hov JR, Folseraas T, Ellinghaus E, Rushbrook SM, Doncheva NT, et al. (2013) Dense genotyp-ing of immune-related disease regions identifies nine new risk loci for primary sclerosgenotyp-ing cholangitis. Nat Genet 45: 670–675. ng.2616 [pii]; doi:10.1038/ng.2616PMID:23603763
33. Andreassen OA, Djurovic S, Thompson WK, Schork AJ, Kendler KS, O'Donovan MC, et al. (2013) Improved detection of common variants associated with schizophrenia by leveraging pleiotropy with cardiovascular-disease risk factors. Am J Hum Genet 92: 197–209. S0002-9297(13)00030-X [pii]; doi:
10.1016/j.ajhg.2013.01.001PMID:23375658
34. Andreassen OA, McEvoy LK, Thompson WK, Wang Y, Reppe S, Schork AJ, et al. (2014) Identifying common genetic variants in blood pressure due to polygenic pleiotropy with associated phenotypes. Hypertension 63: 819–826. HYPERTENSIONAHA.113.02077 [pii]; doi:10.1161/
HYPERTENSIONAHA.113.02077PMID:24396023
35. Schork AJ, Thompson WK, Pham P, Torkamani A, Roddey JC, Sullivan PF, et al. (2013) All SNPs are not created equal: genome-wide association studies reveal a consistent pattern of enrichment among functionally annotated SNPs. PLoS Genet 9: e1003449. doi:10.1371/journal.pgen.1003449 ;PGE-NETICS-D-12-02185 [pii]. PMID:23637621
36. Lin DY, Sullivan PF (2009) Meta-analysis of genome-wide association studies with overlapping sub-jects. Am J Hum Genet 85: 862–872. S0002-9297(09)00515-1 [pii]; doi:10.1016/j.ajhg.2009.11.001
PMID:20004761
37. Andreassen OA, Zuber V, Thompson WK, Schork AJ, Bettella F, Djurovic S, et al. (2014) Shared com-mon variants in prostate cancer and blood lipids. Int J Epidemiol 43: 1205–1214. dyu090 [pii]; doi:10.
1093/ije/dyu090PMID:24786909
38. Reppe S, Refvem H, Gautvik VT, Olstad OK, Hovring PI, Reinholt FP, et al. (2010) Eight genes are highly associated with BMD variation in postmenopausal Caucasian women. Bone 46: 604–612. doi:
10.1016/j.bone.2009.11.007PMID:19922823
39. Jemtland R, Holden M, Reppe S, Olstad OK, Reinholt FP, Gautvik VT, et al. (2011) Molecular disease map of bone characterizing the postmenopausal osteoporosis phenotype. J Bone Miner Res 26: 1793–1801. doi:10.1002/jbmr.396PMID:21452281
40. Willer CJ, Schmidt EM, Sengupta S, Peloso GM, Gustafsson S, Kanoni S, et al. (2013) Discovery and refinement of loci associated with lipid levels. Nat Genet 45: 1274–1283. ng.2797 [pii]; doi:10.1038/ng.
2797PMID:24097068
41. Liu Q, Chen Y, Auger-Messier M, Molkentin JD (2012) Interaction between NFkappaB and NFAT coor-dinates cardiac hypertrophy and pathological remodeling. Circ Res 110: 1077–1086.
CIRCRE-SAHA.111.260729 [pii]; doi:10.1161/CIRCRESAHA.111.260729PMID:22403241
42. Fromigue O, Hay E, Barbara A, Marie PJ (2010) Essential role of nuclear factor of activated T cells (NFAT)-mediated Wnt signaling in osteoblast differentiation induced by strontium ranelate. J Biol Chem 285: 25251–25258. M110.110502 [pii]; doi:10.1074/jbc.M110.110502PMID:20554534
44. Strait KA, Stricklett PK, Kohan RM, Kohan DE (2010) Identification of two nuclear factor of activated T-cells (NFAT)-response elements in the 5'-upstream regulatory region of the ET-1 promoter. J Biol Chem 285: 28520–28528. M110.153189 [pii]; doi:10.1074/jbc.M110.153189PMID:20647310
45. Ge Y, Bagnall A, Stricklett PK, Webb D, Kotelevtsev Y, Kohan DE (2008) Combined knockout of collect-ing duct endothelin A and B receptors causes hypertension and sodium retention. Am J Physiol Renal Physiol 295: F1635–F1640. 90279.2008 [pii]; doi:10.1152/ajprenal.90279.2008PMID:18784261
46. Goettsch C, Rauner M, Hamann C, Sinningen K, Hempel U, Bornstein SR, et al. (2011) Nuclear factor of activated T cells mediates oxidised LDL-induced calcification of vascular smooth muscle cells. Dia-betologia 54: 2690–2701. doi:10.1007/s00125-011-2219-0PMID:21701818
47. Paic F, Igwe JC, Nori R, Kronenberg MS, Franceschetti T, Harrington P, et al. (2009) Identification of differentially expressed genes between osteoblasts and osteocytes. Bone 45: 682–692. S8756-3282
(09)01634-2 [pii]; doi:10.1016/j.bone.2009.06.010PMID:19539797
48. Dallas SL, Veno PA (2012) Live imaging of bone cell and organ cultures. Methods Mol Biol 816: 425–
457. doi:10.1007/978-1-61779-415-5_26PMID:22130943
49. Pidsley R, CC YW, Volta M, Lunnon K, Mill J, Schalkwyk LC (2013) A data-driven approach to prepro-cessing Illumina 450K methylation array data. BMC Genomics 14: 293. 1471-2164-14-293 [pii]; doi:
10.1186/1471-2164-14-293PMID:23631413
50. Reppe S, Stilgren L, Abrahamsen B, Olstad OK, Cero F, Brixen K, et al. (2007) Abnormal muscle and hematopoietic gene expression may be important for clinical morbidity in primary hyperparathyroidism. Am J Physiol Endocrinol Metab 292: E1465–E1473. PMID:17227961
51. Gupta M, Cheung CL, Hsu YH, Demissie S, Cupples LA, Kiel DP, et al. (2011) Identification of homoge-neous genetic architecture of multiple genetically correlated traits by block clustering of genome-wide associations. J Bone Miner Res 26: 1261–1271. doi:10.1002/jbmr.333PMID:21611967
52. Fitzpatrick DJ, Ryan CJ, Shah N, Greene D, Molony C, Shields DC (2015) Genome-wide epistatic expression quantitative trait loci discovery in four human tissues reveals the importance of local chro-mosomal interactions governing gene expression. BMC Genomics 16: 109. doi: 10.1186/s12864-015-1300-3;s12864-015-1300-3 [pii]. PMID:25765234
53. Jin F, Li Y, Dixon JR, Selvaraj S, Ye Z, Lee AY, et al. (2013) A high-resolution map of the three-dimen-sional chromatin interactome in human cells. Nature 503: 290–294. nature12644 [pii]; doi:10.1038/