This is a repository copy of Oxytocin Reverses Ovariectomy-Induced Osteopenia and
Body Fat Gain.
White Rose Research Online URL for this paper:
http://eprints.whiterose.ac.uk/98160/
Version: Accepted Version
Article:
Beranger, G.E., Pisani, D.F., Castel, J. et al. (9 more authors) (2014) Oxytocin Reverses
Ovariectomy-Induced Osteopenia and Body Fat Gain. Endocrinology, 155 (4). pp.
1340-1352. ISSN 0013-7227
https://doi.org/10.1210/en.2013-1688
eprints@whiterose.ac.uk https://eprints.whiterose.ac.uk/ Reuse
Unless indicated otherwise, fulltext items are protected by copyright with all rights reserved. The copyright exception in section 29 of the Copyright, Designs and Patents Act 1988 allows the making of a single copy solely for the purpose of non-commercial research or private study within the limits of fair dealing. The publisher or other rights-holder may allow further reproduction and re-use of this version - refer to the White Rose Research Online record for this item. Where records identify the publisher as the copyright holder, users can verify any specific terms of use on the publisher’s website.
Takedown
If you consider content in White Rose Research Online to be in breach of UK law, please notify us by
1 Oxytocin reverses ovariectomy-induced osteopenia and body fat gain
1
2
Abbreviated title: Oxytocin controls bone and fat mass 3
4
Guillaume E. Beranger1,2,3, Didier F. Pisani1,2,3, Julien Castel4, Mansour Djedaini1,2,3, Séverine 5
Battaglia5, Jérôme Amiaud5, Florian Boukhechba6, Gérard Ailhaud1,2,3, Jean-François Michiels7,8, 6
Dominique Heymann5, Serge Luquet4 and Ez-Zoubir Amri1,2,3*. 7
8
1
Univ. Nice Sophia Antipolis, iBV, UMR 7277, 06100 Nice, France. 2CNRS, iBV UMR 7277, 06100 9
Nice, France. 3Inserm, iBV, U1091, 06100 Nice, France. 4University of Paris Diderot, Sorbonne Paris 10
Cité, BFA, EAC 4413 CNRS, F-75205 Paris, France. 5University of Nantes, INSERM, UMR 957, 11
Nantes, Equipe Labellisée Ligue Contre le Cancer 2012, France. 6Graftys SA, Aix-en-Provence, 12
France. 7University of Nice Sophia Antipolis, UFR Médecine, Nice, F-06189. 8Anatomopathology 13
Service, Pasteur Hospital, Centre Hospitalier Universitaire de Nice, Nice, France. 14
*
Correspondence should be addressed to EA: Dr. Ez-Zoubir Amri, iBV, Institut de Biologie Valrose, 15
Univ. Nice Sophia Antipolis, Tour Pasteur, UFR Médecine, 28, avenue de Valombrose, 06189 Nice 16
Cedex 2, France 17
Tel: +33 493 37 70 82; Fax: +33 493 81 70 58; E-mail: amri@unice.fr 18
19
Key words: Oxytocin, osteoporosis, intra-abdominal adipose tissue, ovariectomy, menopause 20
21
Fundings: This work was supported by CNRS (Centre National de la Recherche Scientifique), 22
Fondation pour la Recherche Médicale, the “Agence Nationale de la Recherche” (ANR). 23
24
DISCLOSURE STATEMENT: The authors have nothing to disclose. 25
26
5168 words 27
28
Manuscript (MUST INCLUDE TITLE PAGE AND ABSTRACT)
2
ABSTRACT
29
30
Osteoporosis and overweight/obesity constitute major worldwide public health burdens that are 31
associated with aging. A high proportion of women develop osteoporosis and increased intra-32
abdominal adiposity after the menopause which leads to bone fractures and metabolic disorders. There 33
is no efficient treatment without major side effects for these two diseases. We previously showed that 34
the administration of oxytocin normalizes ovariectomy-induced osteopenia and bone marrow adiposity 35
in mice. Ovariectomized mice, used as an animal model mimicking menopause, were treated with 36
oxytocin or vehicle. Trabecular bone parameters and fat mass were analyzed using micro-computed 37
tomography. Herein, we show that this effect on trabecular bone parameters was mediated through the 38
restoration of osteoblast/osteoclast cross-talk via the RANKL/OPG axis. Moreover, the daily 39
administration of oxytocin normalized body weight and intra-abdominal fat depots in ovariectomized 40
mice. Intra-abdominal fat mass is more sensitive to oxytocin that subcutaneous fat depots and this 41
inhibitory effect is mediated through inhibition of adipocyte precursor’s differentiation with a 42
tendency to lower adipocyte size. Oxytocin treatment did not affect food intake, locomotors activity 43
and energy expenditure, but it did promote a shift in fuel utilization favoring lipid oxidation. In 44
addition, the decrease in fat mass resulted from the inhibition of the adipose precursor’s 45
differentiation. Thus, oxytocin constitutes an effective strategy for targeting osteopenia, overweight 46
and fat mass redistribution in a mouse model mimicking the menopause without any detrimental 47
effects. 48
3
INTRODUCTION
50
Human life expectancy has increased continuously in industrialized countries. Aging is associated 51
with immunosenescence, a decrease in hormonal secretion, lean mass and bone mass, and an increase 52
in fat accumulation. Body weight gain and fat mass redistribution toward the intra-abdominal 53
compartment represent a major worldwide public health problem, as a large proportion of the adult 54
population is at risk of becoming overweight/obese and developing associated diseases (1,2). 55
Osteoporosis also represents a major health threat as it already affects 40% of white postmenopausal 56
women and is expected to increase concomitantly with life span in the coming years. Post-menopausal 57
osteoporosis is responsible for a dramatic increase in fractures which lead to loss of mobility and 58
autonomy, and more importantly to an increase in mortality of up to 20% one year afterwards due to 59
complications (3). 60
The menopause is a critical period of a woman's life, which is characterized by decreased ovarian 61
hormone production due to age and during which weight gain and the onset or worsening of obesity 62
and osteoporosis are favored (4-6). Such weight gain preferentially affects the abdominal fat depot 63
associated with a transition of body distribution from a gynoid to an android type (7,8). This shift in 64
fat mass distribution favors the development of insulin resistance and its clinical outcomes leading to 65
increased cardiovascular risks and cancer among other diseases (9). Estrogen therapy has been shown 66
to normalize intra-abdominal fat mass and bone resorption in both animals and humans (10-12). 67
However, the side effects of estrogens on non-fat organs hamper the possibility of using this hormone 68
therapeutically as many controversial studies have been reported, in which hormonal replacement 69
therapy may lead to cardiovascular diseases and breast cancer (13,14). 70
Recent studies have shown that obesity and osteoporosis share common traits(15-18): i) both 71
diseases are affected by genetic and environmental factors, or the interaction between them; ii) normal 72
aging is associated with a high incidence of both osteoporosis and bone marrow adiposity; iii) bone 73
remodeling and adiposity are both regulated through the hypothalamus and sympathetic nervous 74
system; iv) adipocytes and osteoblasts arise from a common progenitor, the mesenchymal stem cell; v) 75
4 bone integrity lies in the participation of adipokines in bone remodeling, while the skeleton has effects 77
on body weight control and glucose homeostasis through the actions of bone-derived factors such as 78
osteocalcin and osteopontin (19-22). However, several studies have suggested that obesity is able to 79
protect postmenopausal women from osteoporosis (23,24). This would be due to the impact of being 80
overweight on osteocyte signaling through mechanical loading. It is now accepted that there is a 81
negative correlation between bone and body fat mass suggesting that obesity represents a risk for 82
osteoporosis (17,25,26). Furthermore, recent reports suggested a detrimental effect of intra-abdominal 83
adipose tissue on bone mineral density in premenopausal obese women (27-30). Thus, there is an 84
active cross-talk between adipose tissue and the skeleton which constitutes a homeostatic feedback 85
system with adipokines and molecules secreted by osteoblasts and osteoclasts (20). 86
Based on the linkage between osteoporosis and intra-abdominal adiposity, the inverse relationship 87
that exists between osteogenesis and adipogenesis, controlling the fine balance between the two 88
pathways, is of clear therapeutic significance (31). In our previous work, we showed that oxytocin 89
(OT) inhibited adipocyte and stimulated osteoblast differentiation. Plasma OT levels were lower in 90
ovariectomized (OVX) mice and rats compared to sham-operated controls and OT plasma levels were 91
significantly lower in postmenopausal women who developed osteoporosis than in their healthy 92
counterparts (32). 93
In this study we show that, in OVX mice, OT administration reverses osteopenia and improves fat 94
mass distribution at the onset and after establishment of both disorder phenotypes. The peripheral 95
effect of OT is mediated through an osteoblast/osteoclast cross-talk and an inhibitory effect on the 96
adipocyte precursor’s differentiation. Furthermore, the effects of OT on fat mass, body weight loss and 97
decrease of intra-abdominal fat depots are observed with no change in food intake and OT induces a 98
shift in favor of lipid consumption at the expense of carbohydrates. Collectively, these results indicate 99
that administration of OT holds promise as a preventive as well as a curative therapy for osteoporosis 100
and weight gain/fat mass redistribution. 101
102
MATERIALS AND METHODS
5
Animals
104
The experiments were conducted in accordance with the French and European regulations for the 105
care and use of research animals and were approved by the local experimentation committee. Animals 106
were maintained under constant temperature (21 ± 2°C) and 12:12-hour light-dark cycles, with ad 107
libitum access to standard chow diet and water. Ten-week-old C57Bl/6J mice were subjected either to 108
bilateral ovariectomies from the dorsal approach or to sham surgery in which the ovaries were 109
exteriorized but replaced intact by Charles River Laboratories. 2 or 8 weeks after the ovariectomy or 110
sham surgery, groups of mice (n= 6 to 12) were injected daily intra-peritoneally with vehicle (Ve) or 111
different doses of OT (0.1 or 1 mg/kg, Bachem #H2510) for 8 weeks unless otherwise indicated. 112
Plasma measurements
113
Leptin (Assay Pro), Procollagen I N-Terminal propeptide (PINP, USCN) or Cross Linked C-114
Telopeptide of Type I Collagen (CTXI, USCN) plasma levels were measured using an ELISA kit as 115
per the manufacturer’s instructions. 116
Energy expenditure, food intake and locomotors activity.
117
Mice were analyzed for whole energy expenditure, oxygen consumption and carbon dioxide 118
production, respiratory quotient (vCO2/vO2), food intake and locomotors activity (counts/hour) using 119
calorimetric equipment (Labmaster). Activity was recorded using an infrared light beam-based 120
locomotion monitoring system. Individually housed mice were acclimatized to the chambers for 48 121
hours before experimental measurements and the first day of data acquisition were systematically 122
removed from the final analysis. Data analysis was performed using O2 consumed (ml/h), CO2 123
production (ml/h), and energy expenditure (kcal/h) which were subsequently expressed as a function 124
of whole lean body mass measured through NMR. Data was expressed as an average of the 4 last days 125
of a total of 5 days baseline acquired in the system. The effect of OT injections was conducted as 126
follows: a first analysis was performed after 2 weeks of treatment and a second after 9 weeks. As 127
consistent changes were observed at the onset of the dark cycle, average RER values were calculated 128
systematically using the same 4-hour period during the dark cycle. 129
Micro-computed Tomography
6 Trabecular bone microarchitecture of the distal femoral metaphysis was analyzed using the high-131
resolution SkyScan-1076 X-ray micro-computed tomography system (SkyScan). Femora were 132
scanned after necropsy using the same parameters: 9 m of voxel size, 49 kV, 0.5 mm thick 133
aluminium filter, 0.5° of rotation step. Calculation of femur trabecular bone parameters (Bone Volume 134
/ Total Volume: BV/TV) following 3-D morphometric parameters (Bone ASBMR nomenclature 135
(33,34)) were performed on secondary spongiosa: 100 slides of microCT (0.9 mm of height) starting at 136
0.45 mm from the lower part of the distal growth plate. With such parameters, we included almost all 137
the trabeculae from the distal metaphysis in our mice, excluding the primary spongiosa and the cortical 138
bone. For vertebrae analysis, the 4th lumbar vertebra was scanned after necropsy using the same 139
settings as described previously and trabecular parameters were analyzed on a 1.8 mm height region of 140
interest within the vertebral body. 141
Adipose tissue quantification was carried out using a SkyScan-1178 X-ray micro-computed 142
tomography system. Mice were anaesthetized and scanned using the same parameters: 104 m of 143
voxel size, 49 kV, 0.5 mm thick aluminum filter, 0.9° of rotation step. Total adipose tissue volume 144
was determined between the lumbar vertebra 1 (L1) and the caudal vertebra 4 (C4), whereas intra-145
abdominal and subcutaneous adipose tissues areas were measured on one section at the lumbar 5 (L5) 146
level. Subcutaneous and intra-abdominal adipose tissue is based on the delimitation of region of 147
Interest (ROI) after 3D reconstruction of scanned images as described in (35).3-D reconstructions and 148
analysis of bone parameters and adipose tissue areas or volumes were performed using NRecon and 149
CTAn software (Skyscan). 150
Histology.
151
Tracp and Osterix staining. Femora were fixed in Phosphate Buffered Formaldehyde and 152
decalcified in EDTA solution over 72 hours using a temperature controlled microwave oven to 153
accelerate the decalcification process (KOS, MM France) before being embedded in paraffin. 154
Transversal 3 m thick sections were stained for tartrate-resistant acid phosphatase (TRACP), after 1-155
hour incubation in a solution containing 1 mg/mL naphthol AS-TR phosphate, 60 mM 156
7 counterstained with hematoxylin. Osterix staining was performed on decalcified femora sections using 158
an antibody from Abcam. Osteoblast number and osteoclast surface were quantified in a region of 159
interest including both primary and secondary spongiosa. These quantifications have been performed 160
on ten 10X-fields per section, one sample per animal and 12 mice per group. 161
Adipocyte size determination. Adipose tissues were fixed in Phosphate Buffered Formaldehyde, 162
embedded in paraffin and 4 µm thick sections were stained with hematoxylin/eosin/safran. Adipocyte 163
size was measured using ImageJ software. At least 40 adipocytes per section were measured and 8-12 164
samples were analyzed per group. 165
Isolation and analysis of RNA.
166
Total RNA was extracted using a TRI-Reagent (Euromedex) kit as per the manufacturer's 167
instructions. Two micrograms of total RNA, digested with Dnase I (Promega), were subjected to 168
reverse transcription-polymerase chain reaction (RT-PCR) analysis as described previously (32). The 169
oligonucleotide sequences, designed using Primer Express software, are shown in Supplemental Table 170
1. 171
Cell culture.
172
Primary osteoclast culture and co-culture. Bone marrow-derived primary monocytes were isolated 173
from mouse long bones. Bone marrow cells were collected by flushing tibial and femoral shafts. 174
Monocytes were then isolated using the EasySep® Mouse Monocyte Enrichment Kit (Stem Cells 175
Technologies) according to the manufacturer’s instructions. Briefly, mouse monocytes were enriched 176
from mouse bone marrow by depletion of T cells, B cells, NK cells, dendritic cells, progenitors, 177
granuloctyes and red blood cells. For osteoclastic differentiation, freshly isolated enriched monocytes 178
were seeded at 25,000 cells/cm2and cultured for 7 days in the presence of -MEM supplemented with 179
10% FCS, 20 ng/ml M-CSF (Peprotech) and 20 nM RANKL. For co-culture experiments, monocytes 180
were seeded at a density of 25,000 cells/cm2 with ST2 cells seeded at 20,000 cells/cm2 in -MEM 181
supplemented with 10% FCS, 10-8M 1 ,25-Dihydroxyvitamin D3 and 10-7 M dexamethasone for 7 182
8 Primary adipocyte culture. Stromal-vascular fraction cells were isolated and induced to 184
differentiate in the presence of DMEM containing 10% FCS, 0.5µM dexamethasone, 0.5 mM 185
isobutylmethylxanthine, 170 nM insulin and 1 µM Rosiglitazone. Dexamethasone and 186
isobutylmethylxanthine were omitted 2 days later and cells were maintained for 7-10 days in the 187
presence of 170 nM insulin and 1 µM Rosiglitazone. 30 or 100 nM OT was added daily to the cell 188
culture medium. 189
Tracp staining and osteoclast quantification
190
Tracp activity was detected using the leukocyte acid phosphatase kit from Sigma-Aldrich as per the 191
manufacturer’s instructions. Tracp positive cells with at least 3 nuclei were counted as osteoclasts. For 192
co-culture experiments, Tracp positive areas were quantified using ImageJ software. 193
Statistical analyses
194
Data is expressed as mean values ± SEM and was analyzed using the 2-tailed Student’s t -test. 195
Differences were considered statistically significant at p ≤0.05. ANOVA and post-hoc Tukey-Kramer 196
multiple compar
197
198
RESULTS
199
Oxytocin normalizes bone parameters and fat mass gain in ovariectomized mice.
200
Our aim was to determine whether OT treatment is efficient to normalize osteopenia and body 201
weight gain. Ovariectomized (OVX) or control (Sham) mice received OT or vehicle (Ve) over 8 202
weeks according to the two protocols described in Figure 1a and 1b. In the first protocol, we treated 203
mice 2 weeks post-surgery which corresponded to the onset of bone and fat mass disorders; such 204
treatment was considered as a preventive therapy. Of note, this time point corresponds to a high bone 205
turnover as described previously (36). Indeed, a significant increase of Tracp staining and Tracp 206
mRNA expression is observed in long bones of OVX mice 2 weeks after ovariectomy (Supplemental 207
Figure 1). In the second protocol we treated mice 8 weeks post-surgery at a stage where mice 208
developed osteopenia and a net increase in intra-abdominal fat mass; such treatment represented a 209
9 parameters from distal femoral metaphysis and fat mass were analyzed using micro-computed 211
tomography (Micro-CT) at the end of the experiments. Using the first protocol, a daily injection of OT 212
(1 mg/kg) was able to normalize ovariectomy-induced osteopenia (Figure 1c and Table 1) in 213
agreement with our previous data (32). The BV/TV ratio, trabecular spacing and number were 214
normalized upon OT treatment of OVX mice. In order to determine whether a continuous daily 215
treatment was necessary to restore bone parameters, OVX mice were either injected daily with 1mg/kg 216
OT during the first 4 weeks and received vehicle during the last 4 weeks (short treatment), or they 217
were treated twice a week, vehicle was injected the other days of the week, over 8 weeks (Figure 1a). 218
Micro-CT analysis shows that the BV/TV and the trabecular number of mice that received OT twice a 219
week were restored to the levels of Sham mice, whereas mice that received OT during the first 4 220
weeks only (short treatment) did not recover the normal parameters (Figure 1c and Table 1). In 221
parallel, we also analyzed by micro-CT the trabecular parameters of the 4th lumbar vertebra. Whereas 222
ovariectomy induces a decrease in bone volume within the vertebral body, OT treatment does not 223
rescue these parameters (Supplemental Table 2). Bone resorption (CTX-I) and formation (PINP) 224
plasma marker levels were measured and for which no significant changes was observed except for 225
PINP which is induced in OVX mice upon OT treatment but only in the late treatment protocol 226
(Figure 2a-d). These results demonstrate that the restoration of bone trabecular parameters by OT is 227
not a consequence of either excessive anabolic activity or a dysregulation of bone turnover. 228
Regarding fat mass, it is well known that OVX mice gain body weight after surgery and exhibit 229
increased intra-abdominal fat mass. Daily OT injections (1 mg/kg) significantly reduced mice body 230
weight under each protocol (Figure 1e and 1f). In contrast with the effects on bone parameters, the OT 231
treatment twice a week was less effective in decreasing body weight (Figure 1e). Interestingly, mice 232
receiving OT during the first 4 weeks only (short treatment) immediately gained weight once the OT 233
treatment was completed and returned to the level of OVX-Ve treated mice within 4 weeks (Figure 234
1e). With the second protocol, OVX-OT treated mice exhibited a significant lower body weight 235
compared to OVX-Ve treated mice after 8 weeks of treatment with the two doses used (0.1 mg/kg and 236
10 either protocol (Figure 1f). Micro-CT quantification of the adipose tissue volume between vertebrae 238
L1 and C4 (Figure 1g and 1h) showed that daily injections of 1 mg/kg OT for 8 weeks were able to 239
reduce significantly the adipose tissue volume of OVX mice. The short treatment was not efficient 240
whereas injections twice a week enabled a weak but not significant adipose tissue volume reduction 241
(Figure 1g). Furthermore, OT restored adipose tissue volume significantly for the 1 mg/kg dose 242
(Figure 1h). These variations in adipose tissue volume and body weight correlated with the circulating 243
levels of leptin, a marker of fat mass, which decreased upon OT treatment (Figure 2e and 2f). Body 244
composition analysis showed that the difference in body weight was due to a decrease in fat mass 245
weight, whereas lean mass was not affected by OT treatment (Supplemental Figure 2). In agreement 246
with our previous work (32), OT treatment of OVX mice normalized bone adiposity and fabp4 mRNA 247
expression (Supplemental Figure 3a and b). 248
249
OT treatment restores osteoblast/osteoclast coupling in vivo and in vitro through an increase
250
of RANKL/OPG ratio.
251
Histological analyses on decalcified femora sections using Tracp and Osterix staining revealed that 252
both osteoclast and osteoblast numbers decreased dramatically in OVX mice. OT treatment of OVX 253
mice partially restored the osteoclast number (Tracp-positive areas, Figure 3a) and totally normalized 254
the osteoblast number (Osterix-positive cells, Figure 3c) in long bones, whereas there was no 255
significant effect on Sham-OT treated mice. In agreement with these observations a significant 256
decrease in the expression of osteoclast (Tracp, Atp6v0a3 and Integrin 3) and osteoblast (osteocalcin 257
and Col1 1) specific markers in OVX compared to Sham mice bones was observed (Figure 3b and
258
3d). OT treatment of OVX mice induced a partial restoration in the expression of osteoclast markers 259
(Figure 3b) and a complete restoration in that of osteoblast markers (Figure 3d). Furthermore, TNF 260
mRNA expression and RANKL/OPG mRNA ratio were increased in OVX-OT treated mice (Figure 3e 261
and 3f). Of note, OT treatment did not alter the expression of bone remodeling markers in Sham mice. 262
We next aimed to know whether OT induces osteoclastogenesis in OVX mice through a direct 263
11 bone marrow of OVX mice were induced to differentiate into osteoclasts either alone (Figure 4a and 265
4b) or in co-culture in the presence of ST2 mesenchymal stromal cells (Figure 4c-f). OT treatment did 266
not significantly affect monocyte differentiation as measured by Tracp and Calcitonin Receptor (CTR) 267
mRNA levels (Figure 4a) and TRACP staining of multinucleated cells (Figure 4b). When OVX bone 268
marrow derived monocytes were differentiated using the co-culture protocol, a strong increase in the 269
expression of both Tracp and CTR mRNAs was observed upon OT treatment (Figure 4c). 270
Furthermore, OT treatment triggered a 2.5-fold increase in the Tracp-positive areas (Figure 4d) as well 271
as a 3.5-fold increase in the RANKL/OPG mRNA ratio (Figure 4e). The Tracp-positive areas induced 272
by OT in co-culture experiments decreased dramatically in the presence of increasing amounts of 273
OPG, the decoy receptor for RANKL, thus inhibiting osteoclast differentiation (Figure 4f). These 274
observations demonstrate that OT induces osteoclastogenesis through the induction of the 275
RANKL/OPG ratio by mesenchymal cells. 276
277
Effects of oxytocin on metabolic parameters.
278
In order to gain insights into the role played by OT in the regulation of fat mass, we next 279
investigated the effect of OT treatment on overall energy metabolism. Mice were treated according to 280
the late treatment protocol described in Figure 1b and were monitored in metabolic cages over 5 days. 281
Two periods of analyses were performed, i.e. at 2 weeks after the beginning and at the end of the OT 282
treatment (Figure 5a). Food intake measurements showed that OVX mice were not hyperphagic and 283
that OT did not affect this parameter in both OVX and Sham mice (Figure 5b). Moreover, a more 284
detailed analysis of food intake on a short term period does not evidence any differences following 285
OVX or OT treatment (Supplemental Figure 4a and 4b). However, if we focus on meal pattern, we 286
observe a significant decrease in meal size and duration in OVX-OT treated mice (Supplemental 287
Figure 4c and 4d). OVX mice exhibited reduced locomotors activity (Figure 5c) and energy 288
expenditure during the night period compared to Sham mice regardless of OT treatment (Figure 5d). 289
Interestingly, even if OVX-OT treated mice lost body weight and fat mass, daily OT injections did not 290
12 Under a situation where food intake is similar for OT or vehicle treated OVX and Sham mice 292
(Figure 5b), we sought out a physiological explanation for OT-induced body fat mass loss. We found 293
that the respiratory exchange ratio was significantly lower in OVX-OT compared to OVX-Ve mice 294
(Figure 5e) indicating that a change in fuel utilization had occurred which favored a higher rate of 295
lipid oxidation. Altogether, these observations suggested that OT treated mice used more lipids as 296
energy source than vehicle treated controls which explains the beneficial effects of OT on adipose 297
tissue weight loss. Furthermore, plasma and liver triglyceride as well as plasma glycerol levels were 298
not affected by the OT treatment (Supplemental Figure 5). 299
Glucose tolerance tests showed that glucose tolerance was not affected by OT treatment 300
(Supplemental Figure 6a and 6c). Interestingly, insulin secretion was in a tendency of normalization 301
(Supplemental Figure 6b and 6d), suggesting that OT might protect against ovariectomy-induced 302
insulin resistance consistent with the normalization of body fat mass. We then measured the 303
circulating levels of osteocalcin and its undercarboxylated form (Glu-OC). Glu-OC is considered as a 304
hormone and exerts metabolic functions on different targets such as pancreatic -cells and fat cells 305
(19). As shown, in Supplemental Figure 7a and 7b, the Glu/Gla ratio was not altered following 306
ovariectomy and OT treatment thus indicating that osteocalcin is not involved in OT impact on 307
adipose tissue and pancreas. 308
309
Oxytocin reduces both intra-abdominal and subcutaneous adipose tissue mass without
310
affecting adipocyte cell size.
311
We quantified the subcutaneous and the intra-abdominal adipose tissue depots by measuring their 312
respective areas on a transversal section at the 5th lumbar vertebra level. Ovariectomy was associated 313
with an increase in both fat depots (Figure 6a and 6d). However, the intra-abdominal fat areas were 314
increased at a higher extent (6-fold vs Sham mice, Figure 5a) compared to subcutaneous fat areas (2-315
fold vs Sham mice, Figure 6d). Daily OT injections (1 mg/kg) in OVX mice were able to restore the 316
areas of subcutaneous and intra-abdominal adipose tissues to those of Sham mice under both the early 317
13 treatment with 0.1 mg/kg OT displayed a significant effect on the intra-abdominal compartment 319
suggesting that this fat depot is more sensitive to OT treatment than the subcutaneous adipose tissue. 320
The two other treatments used (OT injections twice a week, short treatment), were inefficient 321
(Supplemental Figure 8a and 8b). 322
Histological analyses of intra-abdominal and subcutaneous fat depots showed that ovariectomy 323
induced adipocytes hypertrophy in both depots (Figure 6b and 6e), as adipocyte size increased with a 324
trend toward a greater proportion of larger adipocytes (Figure 6c and 6f). OT treatment did not 325
significantly affect adipocyte size in subcutaneous and intra-abdominal adipose tissue depots although 326
there was a tendency towards a decrease in cell diameter (Figure 6b and 6e). These observations 327
suggest that OT treatment led to a reduction of fat mass mainly through a decrease in the formation of 328
new adipocytes rather than a decrease or a blockage in adipocyte hypertrophy. 329
In order to distinguish between a peripheral and a central effect of OT that could be involved in the 330
decrease in fat mass, we analyzed in vitro the direct effect of OT on the differentiation of mouse 331
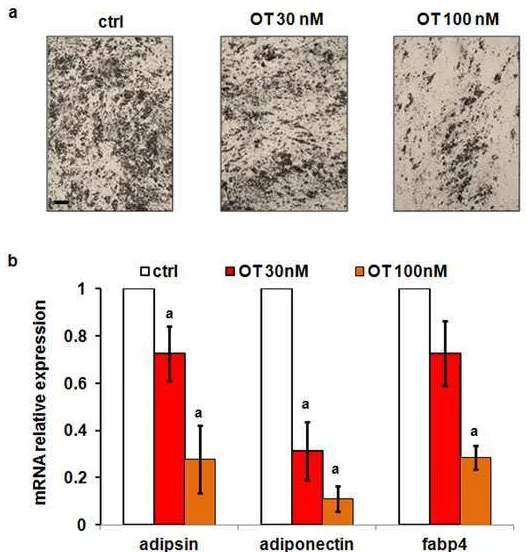
adipose precursor cells. For that purpose, stromal-vascular fraction cells were isolated from 332
subcutaneous adipose depots of OVX mice and induced to differentiate into adipocytes in the presence 333
or the absence of 30 or 100 nM OT. The yield of differentiation was then assessed morphological 334
analysis (Figure 7a) and real-time PCR analysis of adipocyte specific markers (Figure 7b). We 335
observed a strong decrease in the number of lipid droplet-containing cells isolated from subcutaneous 336
depots and a parallel decrease in the expression of adipocyte markers such as adiponectin, fabp4 and 337
adipsin. These observations demonstrate that OT can directly target and inhibit differentiation of 338
mouse adipose precursor cells. Together with the previous results which demonstrated that fat mass 339
reduction in vivo following OT treatment is related to a reduction in adipocyte cell numbers, these data 340
suggest that the propensity to acquire new fat cells from precursor cells in vivo is reduced upon OT 341
treatment of OVX mice. 342
343
DISCUSSION
14 Our study demonstrates that a single hormone, oxytocin, is able to normalize osteopenia and intra-345
abdominal adiposity in ovariectomized mice, an animal model mimicking the menopause. 346
Osteoporosis and overweight/obesity are two major global health problems with an increasing 347
prevalence and a high impact on mortality and morbidity. The menopause, corresponding to the 348
cessation of ovarian estrogen production, is associated with bone loss and increased intra-abdominal 349
adiposity. In contrast to previous contentions, obesity does not protect against osteoporosis and recent 350
studies have suggested that increased intra-abdominal fat has detrimental effects on bone health 351
(28,30). Patients with increased fat accumulation in the abdominal area, even in the absence of obesity 352
features (BMI < 30), have a higher risk of developing diabetes and cardiovascular diseases. 353
So far, there is no efficient treatment free from side effects that is able to restore bone health and to 354
decrease intra-abdominal adiposity and the associated diseases such as cardiovascular dysfunctions 355
and type 2 diabetes. Hormonal replacement therapy is beneficial for bone and fat mass normalization; 356
however this therapy increases the risks of developing breast cancer and cardiovascular diseases (37). 357
Current therapies for osteoporosis mainly consist of anti-resorptive treatments, such as 358
bisphosphonates, estrogen, selective estrogen receptor modulators, calcitonin and a monoclonal 359
antibody against RANKL. The only currently available anabolic treatment for osteoporosis is 360
parathyroid hormone (PTH), but this treatment has a time-limited “anabolic window” and is far from 361
being considered as a “gold standard” therapy. Indeed on a long term basis, PTH treatment enables an 362
increase in bone resorption and a higher bone remodeling turnover that allowed the need to be given in 363
association with a bisphosphonate treatment in an alternative manner (37,38).Thus, OT seems to be a 364
promising candidate for treating osteoporosis, as it was previously described as an anabolic hormone 365
in vivo and an anti-resorptive agent in vitro (this study and (32,39)). Furthermore, we describe in this 366
work that OT, in an osteoporotic context, restores bone coupling in vivo establishing a new steady-367
state which contrasts with PTH treatment (38). Of note, treatment of osteoporotic patients with PTH 368
led to a relative normalization of bones with some side effects but did not normalize body weight or 369
fat mass distribution. This work was performed using OVX mouse as a model for post-menopausal 370
15 and bisphosphonates. However, some discrepancies exist between the pathophysiological processes of 372
osteoporosis in women compared to the OVX mouse. Indeed, OT has the ability to restore bone 373
homeostasis when applied either 2 weeks post-OVX, when bone turnover and resorption are induced, 374
or 8 weeks post-OVX, when both osteoblast and osteoclast activities are decreased, leading us to 375
propose that OT has a highly interesting therapeutic potential in the context of osteoporosis. 376
Transcription of the OT and OTR genes is under the control of estrogens (40). Therefore, as 377
estrogen level is decreased in OVX mice and rats as well as in postmenopausal women, OT levels are 378
lowered as a consequence (32). Our previous data strongly suggested that hypogonadal-induced bone 379
loss and fat mass increase were both linked to low OT circulating levels, and that restoring OT levels 380
could therefore reverse osteopenia and fat mass increase. Furthermore, OTR-deficient mice exhibit 381
disorders in several aspects of social behavior, bone defects and develop late-onset obesity (39,41-44). 382
Our present data clearly shows that OT is able to restore bone microarchitecture and to prevent the 383
development of intra-abdominal fat mass in ovariectomized mice, both at the onset and later when the 384
disorders are well established. Interestingly, it has been recently shown in vivo that the expression of 385
osteoblastic OTR, by contrast to osteoclastic OTR, was required for the beneficial effects of OT (45). 386
Herein, we show that the beneficial effect of OT on bone microarchitecture is mediated through an 387
induction of bone modeling. This event is then associated to an increase in bone remodeling, due to 388
the non-direct rescue of osteoclastogenesis through the induction of RANKL/OPG ratio by 389
mesenchymal cells. Altogether, the tight regulation of osteoblast and osteoclast activities by OT leads 390
to a new homeostasis within bone tissue. 391
As OT affects osteoblast/adipocyte balance at the expense of adipocytes, we hypothesized that OT 392
treatment of OVX mice could lead to a net prevention of increased body weight and fat mass. Recent 393
reports have shown that OT controls body weight and fat mass content in mice under a high fat diet 394
through a decreased food intake (46-49). These observations are in contrast with our data as no 395
difference in food intake following OT treatment could be measured. In our hands mice were fed a 396
standard chow and not a high fat diet which might explain the difference in feeding behavior. Recent 397
16 treated mice (50). Our data shows that OT did not affect food intake and energy expenditure, in either 399
OVX or Sham control mice but it did improve insulin sensitivity and promoted a shift in fuel 400
utilization. This change in RER demonstrated that fat oxidation was favored as an energy source, as 401
RER usually ranges from 0.7 (pure fat oxidation) up to 1.0 (pure carbohydrate oxidation). 402
Furthermore, OT did not significantly affect the adipocyte size, and data from in vitro experiments 403
supports the inhibitory effect of OT on adipocyte differentiation of precursor cells. The effects of OT 404
were more efficient on intra-abdominal compared to subcutaneous fat mass that could be due at least 405
in part to the intrinsic differences in adipocyte precursors from different adipose tissue depots recently 406
reported (51). Altogether we attributed the beneficial action of OT on body fat gain to the inhibition of 407
adipogenesis in combination with an increase in the peripheral utilization of lipid substrate. We 408
calculated that OT treatment resulted in a differential accumulation of adipose mass of roughly 3 g 409
(7.5 g - 4.5 g) which corresponded to approximately 21 kcal over the 70 days of treatment, assuming 410
that 7 kcal is consumed per g of fat mass. The body weight loss is therefore the result of a daily 411
differential in energy of about 0.3 kcal, which represented ~2% of the 14 kcal total daily calorific 412
intake. This calculation illustrates how a small differential in energy balance is sufficient for a 413
dramatic output on adiposity (52). We believe that free fatty acids from adipose tissue were the main 414
source of the lipids sustaining the shift in RER, since hepatic triglycerides did not show any difference 415
between OT-treated and vehicle-treated animals. 416
The crosstalk between bone and energy metabolism has been clearly evidenced in the last years 417
through the investigations on the role of leptin, osteocalcin and other molecules (53). The complexity 418
of the bone phenotype of leptin signaling deficient mouse models highlights the intricacy of the 419
crosstalk between these 2 organs. In the same manner, we identified in this work differential effect of 420
OT on cortical and trabecular bone parameters. Of note, the absence of variation in the levels of 421
undercarboxylated osteocalcin in our mice excludes, at least in part, this pathway for a connection 422
between bone and fat in OT-treated mice. However, we do not exclude the involvement of other 423
17 involve other players such as circulating leptin levels and/or mechanical loading in the normalization 425
of osteopenia and body weight. 426
In conclusion, our data clearly indicates that administration of OT holds promise as a preventive 427
therapy and may help to reverse both osteoporosis and fat mass increase. This may represent the first 428
therapy targeting these two diseases linked to aging and their associated pathologies such as diabetes 429
and cardiovascular disorders. 430
431
ACKNOWLEDGEMENTS
432
We are grateful to Pr. Dominique Langin for helpful discussions. This work was supported by 433
CNRS (Centre National de la Recherche Scientifique), Fondation pour la Recherche Médicale (grant 434
DVO20081013470) and the Conseil Général des Alpes Maritimes. G.E.B. was supported by “CNRS 435
service Partenariat et Valorisation” and by “Agence Nationale de la Recherche”. S.L. was supported 436
by an ATIP grant from CNRS, an equipment grant from the Région Île-de-France, an equipment grant 437
from the University Paris Diderot-Paris 7, a research fellowship from “Société Francophone du 438
Diabète-Lilly” and a grant from the “Agence Nationale de la Recherche” ANR-09-BLAN-0267-02. 439
We would like to express our gratitude to Denis Mestivier, (Université Paris Diderot, Sorbonne Paris 440
Cité, Institut Jacques Monod, Paris, France) for precious input in meal ultrastructure analysis. We 441
acknowledge the Functional & Physiological Exploration Platform at the “Biologie Fonctionnelle et 442
Adaptative” Unit, University of Paris Diderot, for metabolic analysis. The authors declare that they 443
have no competing interests. 444
445
446
REFERENCES
447
1. Pischon T, Boeing H, Hoffmann K, Bergmann M, Schulze MB, Overvad K, van der Schouw 448
YT, Spencer E, Moons KG, Tjonneland A, Halkjaer J, Jensen MK, Stegger J, Clavel-449
Chapelon F, Boutron-Ruault MC, Chajes V, Linseisen J, Kaaks R, Trichopoulou A, 450
Trichopoulos D, Bamia C, Sieri S, Palli D, Tumino R, Vineis P, Panico S, Peeters PH, May 451
18 Hedblad B, Lund E, Agudo A, Arriola L, Barricarte A, Navarro C, Martinez C, Quiros JR, 453
Key T, Bingham S, Khaw KT, Boffetta P, Jenab M, Ferrari P, Riboli E. General and 454
abdominal adiposity and risk of death in Europe. N Engl J Med. 2008;359(20):2105-2120. 455
2. Despres JP, Lemieux I. Abdominal obesity and metabolic syndrome. Nature. 456
2006;444(7121):881-887. 457
3. Rachner TD, Khosla S, Hofbauer LC. Osteoporosis: now and the future. Lancet. 458
2011;377(9773):1276-1287. 459
4. Augoulea A, Mastorakos G, Lambrinoudaki I, Christodoulakos G, Creatsas G. Role of 460
postmenopausal hormone replacement therapy on body fat gain and leptin levels. Gynecol 461
Endocrinol. 2005;20(4):227-235. 462
5. Garaulet M, Perez-Llamas F, Baraza JC, Garcia-Prieto MD, Fardy PS, Tebar FJ, Zamora S. 463
Body fat distribution in pre-and post-menopausal women: metabolic and anthropometric 464
variables. J Nutr Health Aging. 2002;6(2):123-126. 465
6. Wing RR, Matthews KA, Kuller LH, Meilahn EN, Plantinga PL. Weight gain at the time of 466
menopause. Arch Intern Med. 1991;151(1):97-102. 467
7. Morris E, Currie H. Obesity in menopausal women: more than you might think. Menopause 468
Int. 2010;16(3):97. 469
8. Tchernof A, Desmeules A, Richard C, Laberge P, Daris M, Mailloux J, Rheaume C, Dupont 470
P. Ovarian hormone status and abdominal visceral adipose tissue metabolism. J Clin 471
Endocrinol Metab. 2004;89(7):3425-3430. 472
9. Mendelsohn ME, Karas RH. Molecular and cellular basis of cardiovascular gender 473
differences. Science. 2005;308(5728):1583-1587. 474
10. Andersson N, Islander U, Egecioglu E, Lof E, Swanson C, Moverare-Skrtic S, Sjogren K, 475
Lindberg MK, Carlsten H, Ohlsson C. Investigation of central versus peripheral effects of 476
estradiol in ovariectomized mice. J Endocrinol. 2005;187(2):303-309. 477
11. Jensen LB, Vestergaard P, Hermann AP, Gram J, Eiken P, Abrahamsen B, Brot C, Kolthoff 478
N, Sorensen OH, Beck-Nielsen H, Nielsen SP, Charles P, Mosekilde L. Hormone replacement 479
therapy dissociates fat mass and bone mass, and tends to reduce weight gain in early 480
postmenopausal women: a randomized controlled 5-year clinical trial of the Danish 481
Osteoporosis Prevention Study. J Bone Miner Res. 2003;18(2):333-342. 482
12. Weigt C, Hertrampf T, Zoth N, Fritzemeier KH, Diel P. Impact of estradiol, ER subtype 483
specific agonists and genistein on energy homeostasis in a rat model of nutrition induced 484
obesity. Mol Cell Endocrinol. 2012;351(2):227-238. 485
13. Vickers MR, MacLennan AH, Lawton B, Ford D, Martin J, Meredith SK, DeStavola BL, 486
Rose S, Dowell A, Wilkes HC, Darbyshire JH, Meade TW. Main morbidities recorded in the 487
19 randomised controlled trial of hormone replacement therapy in postmenopausal women. Bmj. 489
2007;335(7613):239. 490
14. Alessandri N, Piccioni MG, Isabelli V, Alessandri G, Di Matteo A, Padovani D, Rondoni G, 491
Camardella B, Parlapiano C. Morphological and functional changes of cardiovascular system 492
in postmenopausal women. Eur Rev Med Pharmacol Sci. 2007;11(2):107-117. 493
15. Reid IR. Relationships between fat and bone. Osteoporos Int. 2008;19(5):595-606. 494
16. Shapses SA, Riedt CS. Bone, body weight, and weight reduction: what are the concerns? J 495
Nutr. 2006;136(6):1453-1456. 496
17. Zhao LJ, Jiang H, Papasian CJ, Maulik D, Drees B, Hamilton J, Deng HW. Correlation of 497
obesity and osteoporosis: effect of fat mass on the determination of osteoporosis. J Bone 498
Miner Res. 2008;23(1):17-29. 499
18. Rosen CJ, Bouxsein ML. Mechanisms of disease: is osteoporosis the obesity of bone? Nat 500
Clin Pract Rheumatol. 2006;2(1):35-43. 501
19. Ferron M, Hinoi E, Karsenty G, Ducy P. Osteocalcin differentially regulates beta cell and 502
adipocyte gene expression and affects the development of metabolic diseases in wild-type 503
mice. Proc Natl Acad Sci U S A. 2008;105(13):5266-5270. 504
20. Lee NK, Karsenty G. Reciprocal regulation of bone and energy metabolism. J Musculoskelet 505
Neuronal Interact. 2008;8(4):351. 506
21. Lee NK, Sowa H, Hinoi E, Ferron M, Ahn JD, Confavreux C, Dacquin R, Mee PJ, McKee 507
MD, Jung DY, Zhang Z, Kim JK, Mauvais-Jarvis F, Ducy P, Karsenty G. Endocrine 508
regulation of energy metabolism by the skeleton. Cell. 2007;130(3):456-469. 509
22. Yadav VK, Ryu JH, Suda N, Tanaka KF, Gingrich JA, Schutz G, Glorieux FH, Chiang CY, 510
Zajac JD, Insogna KL, Mann JJ, Hen R, Ducy P, Karsenty G. Lrp5 controls bone formation by 511
inhibiting serotonin synthesis in the duodenum. Cell. 2008;135(5):825-837. 512
23. Albala C, Yanez M, Devoto E, Sostin C, Zeballos L, Santos JL. Obesity as a protective factor 513
for postmenopausal osteoporosis. Int J Obes Relat Metab Disord. 1996;20(11):1027-1032. 514
24. Felson DT, Zhang Y, Hannan MT, Anderson JJ. Effects of weight and body mass index on 515
bone mineral density in men and women: the Framingham study. J Bone Miner Res. 516
1993;8(5):567-573. 517
25. Migliaccio S, Greco EA, Fornari R, Donini LM, Lenzi A. Is obesity in women protective 518
against osteoporosis? Diabetes Metab Syndr Obes. 2011;4:273-282. 519
26. Zhao LJ, Liu YJ, Liu PY, Hamilton J, Recker RR, Deng HW. Relationship of obesity with 520
osteoporosis. J Clin Endocrinol Metab. 2007;92(5):1640-1646. 521
27. Bredella MA, Torriani M, Ghomi RH, Thomas BJ, Brick DJ, Gerweck AV, Harrington LM, 522
Breggia A, Rosen CJ, Miller KK. Determinants of bone mineral density in obese 523
20
28. Bredella MA, Torriani M, Ghomi RH, Thomas BJ, Brick DJ, Gerweck AV, Rosen CJ, 525
Klibanski A, Miller KK. Vertebral bone marrow fat is positively associated with visceral fat 526
and inversely associated with IGF-1 in obese women. Obesity (Silver Spring). 2011;19(1):49-527
53. 528
29. Compston JE, Watts NB, Chapurlat R, Cooper C, Boonen S, Greenspan S, Pfeilschifter J, 529
Silverman S, Diez-Perez A, Lindsay R, Saag KG, Netelenbos JC, Gehlbach S, Hooven FH, 530
Flahive J, Adachi JD, Rossini M, Lacroix AZ, Roux C, Sambrook PN, Siris ES. Obesity is not 531
protective against fracture in postmenopausal women: GLOW. Am J Med. 532
2011;124(11):1043-1050. 533
30. Sheu Y, Cauley JA. The role of bone marrow and visceral fat on bone metabolism. Curr 534
Osteoporos Rep. 2011;9(2):67-75. 535
31. Nuttall ME, Gimble JM. Controlling the balance between osteoblastogenesis and adipogenesis 536
and the consequent therapeutic implications. Curr Opin Pharmacol. 2004;4(3):290-294. 537
32. Elabd C, Basillais A, Beaupied H, Breuil V, Wagner N, Scheideler M, Zaragosi LE, Massiera 538
F, Lemichez E, Trajanoski Z, Carle G, Euller-Ziegler L, Ailhaud G, Benhamou CL, Dani C, 539
Amri EZ. Oxytocin controls differentiation of human mesenchymal stem cells and reverses 540
osteoporosis. Stem Cells. 2008;26(9):2399-2407. 541
33. Bouxsein ML, Boyd SK, Christiansen BA, Guldberg RE, Jepsen KJ, Muller R. Guidelines for 542
assessment of bone microstructure in rodents using micro-computed tomography. J Bone 543
Miner Res. 2010;25(7):1468-1486. 544
34. Dempster DW, Compston JE, Drezner MK, Glorieux FH, Kanis JA, Malluche H, Meunier PJ, 545
Ott SM, Recker RR, Parfitt AM. Standardized nomenclature, symbols, and units for bone 546
histomorphometry: a 2012 update of the report of the ASBMR Histomorphometry 547
Nomenclature Committee. J Bone Miner Res. 2013;28(1):2-17. 548
35. Luu YK, Lublinsky S, Ozcivici E, Capilla E, Pessin JE, Rubin CT, Judex S. In vivo 549
quantification of subcutaneous and visceral adiposity by micro-computed tomography in a 550
small animal model. Med Eng Phys. 2009;31(1):34-41. 551
36. Most W, van der Wee-Pals L, Ederveen A, Papapoulos S, Lowik C. Ovariectomy and 552
orchidectomy induce a transient increase in the osteoclastogenic potential of bone marrow 553
cells in the mouse. Bone. 1997;20(1):27-30. 554
37. Nelson HD, Humphrey LL, Nygren P, Teutsch SM, Allan JD. Postmenopausal hormone 555
replacement therapy: scientific review. Jama. 2002;288(7):872-881. 556
38. Girotra M, Rubin MR, Bilezikian JP. The use of parathyroid hormone in the treatment of 557
osteoporosis. Rev Endocr Metab Disord. 2006;7(1-2):113-121. 558
39. Tamma R, Colaianni G, Zhu LL, DiBenedetto A, Greco G, Montemurro G, Patano N, 559
21 Bachar M, Bab I, Nishimori K, Young LJ, Buettner C, Iqbal J, Sun L, Zaidi M, Zallone A. 561
Oxytocin is an anabolic bone hormone. Proc Natl Acad Sci U S A. 2009;106(17):7149-7154. 562
40. Richard S, Zingg HH. The human oxytocin gene promoter is regulated by estrogens. J Biol 563
Chem. 1990;265(11):6098-6103. 564
41. Nishimori K, Young LJ, Guo Q, Wang Z, Insel TR, Matzuk MM. Oxytocin is required for 565
nursing but is not essential for parturition or reproductive behavior. Proc Natl Acad Sci U S A. 566
1996;93(21):11699-11704. 567
42. Ferguson JN, Young LJ, Hearn EF, Matzuk MM, Insel TR, Winslow JT. Social amnesia in 568
mice lacking the oxytocin gene. Nat Genet. 2000;25(3):284-288. 569
43. Takayanagi Y, Yoshida M, Bielsky IF, Ross HE, Kawamata M, Onaka T, Yanagisawa T, 570
Kimura T, Matzuk MM, Young LJ, Nishimori K. Pervasive social deficits, but normal 571
parturition, in oxytocin receptor-deficient mice. Proc Natl Acad Sci U S A. 572
2005;102(44):16096-16101. 573
44. Takayanagi Y, Kasahara Y, Onaka T, Takahashi N, Kawada T, Nishimori K. Oxytocin 574
receptor-deficient mice developed late-onset obesity. Neuroreport. 2008;19(9):951-955. 575
45. Colaianni G, Sun L, Di Benedetto A, Tamma R, Zhu LL, Cao J, Grano M, Yuen T, Colucci S, 576
Cuscito C, Mancini L, Li J, Nishimori K, Bab I, Lee HJ, Iqbal J, Young WS, 3rd, Rosen C, 577
Zallone A, Zaidi M. Bone marrow oxytocin mediates the anabolic action of estrogen on the 578
skeleton. J Biol Chem. 2012;287(34):29159-29167. 579
46. Deblon N, Veyrat-Durebex C, Bourgoin L, Caillon A, Bussier AL, Petrosino S, Piscitelli F, 580
Legros JJ, Geenen V, Foti M, Wahli W, Di Marzo V, Rohner-Jeanrenaud F. Mechanisms of 581
the anti-obesity effects of oxytocin in diet-induced obese rats. PLoS ONE. 2011;6(9):e25565. 582
47. Maejima Y, Iwasaki Y, Yamahara Y, Kodaira M, Sedbazar U, Yada T. Peripheral oxytocin 583
treatment ameliorates obesity by reducing food intake and visceral fat mass. Aging (Albany 584
NY). 2011;3(12):1169-1177. 585
48. Morton GJ, Thatcher BS, Reidelberger RD, Ogimoto K, Wolden-Hanson T, Baskin DG, 586
Schwartz MW, Blevins JE. Peripheral oxytocin suppresses food intake and causes weight loss 587
in diet-induced obese rats. Am J Physiol Endocrinol Metab. 2012;302(1):E134-144. 588
49. Zhang G, Bai H, Zhang H, Dean C, Wu Q, Li J, Guariglia S, Meng Q, Cai D. Neuropeptide 589
exocytosis involving synaptotagmin-4 and oxytocin in hypothalamic programming of body 590
weight and energy balance. Neuron. 2011;69(3):523-535. 591
50. Zhang H, Wu C, Chen Q, Chen X, Xu Z, Wu J, Cai D. Treatment of obesity and diabetes 592
using oxytocin or analogs in patients and mouse models. PLoS ONE. 2013;8(5):e61477. 593
51. Macotela Y, Emanuelli B, Mori MA, Gesta S, Schulz TJ, Tseng YH, Kahn CR. Intrinsic 594
differences in adipocyte precursor cells from different white fat depots. Diabetes. 595
22
52. Butler AA, Kozak LP. A recurring problem with the analysis of energy expenditure in genetic 597
models expressing lean and obese phenotypes. Diabetes. 2010;59(2):323-329. 598
53. Karsenty G, Ferron M. The contribution of bone to whole-organism physiology. Nature. 599
2012;481(7381):314-320. 600
23
Table
[image:24.595.46.552.114.532.2]602
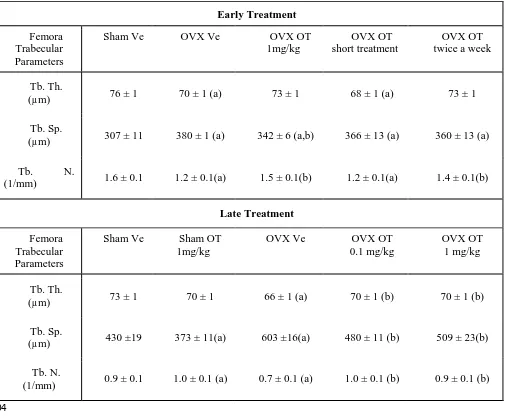
Table 1: Micro-computed tomography analysis of femora trabecular parameters.
603
Early Treatment
Femora Trabecular Parameters
Sham Ve OVX Ve OVX OT
1mg/kg
OVX OT short treatment
OVX OT twice a week
Tb. Th.
(µm) 76 ± 1 70 ± 1 (a) 73 ± 1 68 ± 1 (a) 73 ± 1
Tb. Sp.
(µm) 307 ± 11 380 ± 1 (a) 342 ± 6 (a,b) 366 ± 13 (a) 360 ± 13 (a)
Tb. N.
(1/mm) 1.6 ± 0.1 1.2 ± 0.1(a) 1.5 ± 0.1(b) 1.2 ± 0.1(a) 1.4 ± 0.1(b)
Late Treatment
Femora Trabecular Parameters
Sham Ve Sham OT 1mg/kg
OVX Ve OVX OT
0.1 mg/kg
OVX OT 1 mg/kg
Tb. Th.
(µm) 73 ± 1 70 ± 1 66 ± 1 (a) 70 ± 1 (b) 70 ± 1 (b)
Tb. Sp.
(µm) 430 ±19 373 ± 11(a) 603 ±16(a) 480 ± 11 (b) 509 ± 23(b)
Tb. N.
(1/mm) 0.9 ± 0.1 1.0 ± 0.1 (a) 0.7 ± 0.1 (a) 1.0 ± 0.1 (b) 0.9 ± 0.1 (b)
604
Control (Sham) and ovariectomized (OVX) mice were submitted to daily injections of oxytocin 605
(OT) or vehicle (Ve) for 8 weeks starting either 2 weeks (early treatment) or 8 weeks post-surgery 606
(late treatment). Detailed analysis of trabecular parameters was performed on the distal metaphysis of 607
femora. Trabecular Thickness (Tb. Th.), Trabecular Spacing (Tb. Sp.) and Trabecular Number (Tb. 608
N.) are reported in the Table 1. a: p<0.05 vs Sham Ve; b: p<0.05 vs OVX Ve. (n=6 to 12 mice per 609
group) Data are represented as mean +/- SEM. 610
611
24
Figures and Legends
613
Figure 1: Effects of oxytocin on trabecular bone parameters, body weight and fat mass in
614
ovariectomized mice. Sham and OVX mice were submitted to daily injections of oxytocin (OT) or
615
vehicle (Ve) for 8 weeks starting either 2 weeks (early treatment, a) or 8 weeks post-surgery (late 616
treatment, b). Analysis of the trabecular bone from distal femoral metaphysis in OVX and Sham mice 617
treated with OT or Ve. Mice were daily injected according to early (c, e and g) or late (d, f and h) 618
treatment. Alternative treatments were performed (i.e. 2 injections per week, 4 weeks of OT treatment 619
followed by 4 weeks of vehicle injections or a lower dose of 0.1 mg/kg). Trabecular bone volume was 620
measured (c, d). Body weight was measured during early (e) and late (f) treatment. The volume of 621
white adipose tissue between lumbar vertebra 1 and the caudal vertebra 4 was measured (g, h). 622
BV/TV: Bone Volume/Tissue Volume ratio (n=6 to 12 mice per group), data are represented as mean 623
+/- SEM, a p<0.05 vs Sham Ve; b p<0.05 vs OVX Ve. 624
625
Figure 2 : Plasma levels of bone formation marker PINP (a, b), bone resorption marker CTX-I (c,
626
d), adipose tissue marker leptin (e, f) in Sham and OVX mice following 8 weeks of OT or Ve in early 627
(a, c and e) and late (b, d and f) treatment. (n= 8-12 mice per group), data are represented as mean +/- 628
SEM, a p<0.05 vs Sham Ve; b p<0.05 vs OVX Ve. 629
630
Figure 3: OT treatment restores osteoclast and osteoblast numbers as well as bone
631
remodeling markers expression. In vivo analysis of long bones from Sham and OVX mice that were
632
treated or not with OT. Decalcified bone sections were stained for Tracp activity (a) and Osterix 633
expression (c) to quantify the Osteoclast (arrow) and Osteoblast (arrowhead) numbers respectively. 634
Quantifications were performed from the growth plate up to the mid-diaphysis of femora on both 635
trabecular and cortical bone. Quantitative representations of the illustrations on the left are shown in 636
the graphs on the right of each panel. Real-Time PCR was performed on RNA from humeri and the 637
25 determined. (n=12 mice per group), data are represented as mean +/- SEM, a p<0.05 vs Sham Ve; b 639
p<0.05 vs OVX Ve. (scale bar: 10 µm). 640
641
Figure 4: OT induces osteoclastogenesis in a RANKL-dependent manner through
642
mesenchymal cells. Monocytes isolated from bone marrow of OVX mice were differentiated in vitro in
643
the presence of M-CSF and RANKL (a, b) or using a co-culture protocol with mesenchymal ST2 cells 644
(c-f). Differentiation was performed in the absence or the presence of 300 nM OT, and osteoclast 645
markers expression was measured by real-time PCR (a, c) on day 8. Osteoclast differentiation was 646
quantified following TRACP staining (b, d), representative illustrations are shown on the right of each 647
graph. Expression of RANKL/OPG ratio in co-culture of ST2 cells with primary monocytes from OVX 648
mice (e) is reported. Effect of increasing amounts of OPG on OT-induced osteoclast differentiation in 649
co-culture experiments (f) is shown. Data are represented as mean +/- SEM, a p<0.05 for OT-treated 650
cells versus control (scale bar: 10 µm). 651
652
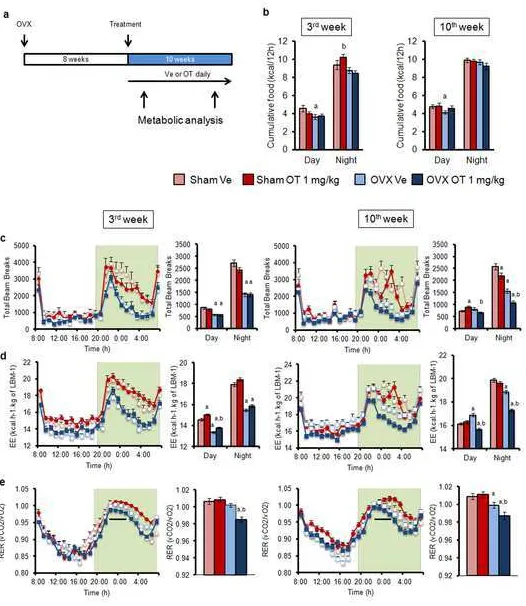
Figure 5: Increase in lipid metabolism of OVX-OT treated mice. Experimental design (a):
653
treatment was initiated 8 weeks after surgery and consisted of a daily injection with vehicle or OT 654
(1mg/kg) in Sham and OVX mice. Cumulative food intake (kcal) (b), total locomotors activity (c), 655
energy expenditure (kcal/hr/kg of lean body mass) (d) and respiratory exchange ratio (vCO2/vO2) (e) 656
were measured at two time points in the same group (during the 3rd or the 10th week of the treatment 657
(arrows in panel a). Averages of daily and nocturnal data are presented as histograms (b-d). An 658
average value for RER during a 4-hour period is presented as a histogram at the time period indicated 659
by a black line (panel e). (n=6 in each group). Data are represented as mean +/- SEM, a p<0.05 vs 660
Sham Ve; b p<0.05 vs OVX Ve. 661
662
Figure 6: OT treatment reduces both intra-abdominal and subcutaneous adipose tissues,
663
effects on adipocyte size. Quantification of intra-abdominal (a) and subcutaneous (d) adipose depots
664
26 section level (a, d). Adipocyte size was measured on histological sections of intra-abdominal (b, c) 666
and subcutaneous (e, f) adipose tissues and average adipocyte diameter (b, e) as well as adipocyte 667
distribution size (c, f) were determined. (n= 8 mice per group). Data are represented as mean +/- SEM, 668
a p<0.05 vs Sham Ve; b p<0.05 vs OVX Ve (scale bar:100 µm). 669
670
Figure 7: In vitro effect of OT on adipogenesis of primary adipose precursor cells.
Stromal-671
vascular fraction cells isolated from subcutaneous adipose tissues from OVX mice were induced to 672
differentiate into adipocytes in the absence or the presence of 30 or 100 nM OT. Microphotographs of 673
differentiated cells at day 10 (a) and real time PCR of adipocyte markers (b) were performed in 674
triplicate. Data are represented as mean +/- SEM, a 2-tailed Student’s t -test was performed for the two 675
OT doses independently, a p<0.05 vs ctrl (scale bar: 200 µm). 676
677
678
SUPPLEMENTAL DATA
679
680
Supplemental Materials and Methods
681
Supplemental Figures and Legends
682
Supplemental Figure 1: In vivo analysis of Tracp during the 2 weeks following ovariectomy. Tracp
683
staining on decalcified bone sections (a) and quantification (b). Real-Time PCR for Tracp expression 684
on RNA from humeri of Sham and OVX mice 2 weeks after ovariectomy (n= 4 mice per group), data 685
are represented as mean +/- SEM, a p<0.05 vs Sham at 2 weeks. (Scale bar 500 µm). 686
Supplemental Figure 2: Fat (a) and lean (b) mass weight determined using Echo-MRI methods
687
during the OT treatment period. Data are represented as mean +/- SEM.
688
Supplemental Figure 3: Bone marrow adiposity. In vivo analysis of fabp4 mRNA expression (a)
689
and bone marrow adipocytes (b) within femora of Sham-Ve, OVX-Ve and OVX-OT treated mice. (n= 690
8-12 mice per group), data are represented as mean +/- SEM, a p<0.05 vs Sham-Ve, b p<0.05 vs 691
27
Supplemental Figure 4: Oxytoxin treatment affects meal ultrastructure. 4 and 18 h cumulative
693
food intake at the 3rd (a) and the 10th (b) week of treatment period. Meals size (c) and duration (d) at 694
the 3rd week of treatment period. 695
Supplemental Figure 5: Triglyceride and glycerol quantification. Triglyceride levels were
696
quantified in Liver extracts (a). Circulating glycerol (b) and triglyceride (c) levels were quantified in 697
plasma of Sham and OVX mice treated or not with OT. Data are represented as mean +/- SEM, a 698
p<0.05 vs Sham Ve. 699
Supplemental Figure 6: OT treatment improves the insulin resistance in OVX mice. Glucose
700
Tolerance test: mice were injected intraperitoneally with glucose (1.5 g/kg) before (a, b) or after (c, d) 701
the 8-week oxytocin treatment. Glucose (a, c) and insulin (b, d) concentrations were measured in 702
plasma from Sham and OVX OT or vehicle treated mice. (AUC: area under the curve) (n=8 mice per 703
group), data are represented as mean +/- SEM. 704
Supplemental Figure 7: Plasma levels of undercarboxylated over carboxylated (Glu/Gla) osteocalcin
705
ratio (a, b) in Sham and OVX mice following 8 weeks of OT or Ve in early (a) and late (b) treatment. 706
(n= 8-12 mice per group), data are represented as mean +/- SEM, a p<0.05 vs Sham Ve; b p<0.05 vs 707
OVX Ve. 708
Supplemental Figure 8: OT treatment reduces both intra-abdominal and subcutaneous adipose
709
tissues, effects on adipocyte size following the early treatment protocol. Quantification of
intra-710
abdominal (a) and subcutaneous (b) adipose depots following 8 weeks of early treatment. Adipose 711
tissue areas were measured at the L5 (lumbar vertebra 5) section level using micro-computed 712
tomography. Adipocyte size was measured on histological sections of intra-abdominal (c) and 713
subcutaneous (d) adipose tissues at the end of the treatment period and adipocytes distribution 714
according to their size is reported (n= 8 mice per group), data are represented as mean +/- SEM, a 715
p<0.05 vs Sham Ve; b p<0.05 vs OVX Ve 716
Supplemental Table 1: Sequence of primers used for gene expression analysis.
717
Supplemental Table 2: Micro-computed tomography analysis of L4 vertebra trabecular parameters.
718
28 or vehicle (Ve) for 8 weeks starting 8 weeks post-surgery (late treatment). Detailed analysis of 720
trabecular parameters was performed on the 4th Lumbar vertebra (L4). Trabecular Thickness (Tb. Th.), 721
Trabecular Spacing (Tb. Sp.) and Trabecular Number (Tb. N.) are reported in the Table 2. a: p<0.05 vs 722
Sham Ve; b: p<0.05 vs OVX Ve. (n=6 to 12 mice per group) Data are represented as mean +/- SEM. 723
724
Abbreviations
725
MEM: alpha Minimum Essential Medium Eagle; BMI: Body Mass Index; BV/TV: Bone 726
Volume/Trabecular Volume ratio (%); Col1 1: Collagen Type 1, Alpha 1, CTR: Calcitonin Receptor; 727
CTX-I: C-Telopeptide of type I collagen; DMEM: Dulbecco's Modified Eagle Medium; fabp4: fatty 728
acid binding protein 4; Micro-CT: Micro-Computed Tomography; OPG: Osteoprotegerin; OT: 729
Oxytocin; OTR: Oxytocin Receptor; OVX: Ovariectomized mouse; PINP: Procollagen type I N-730
terminal Propeptide; PTH: Parathyroid Hormone; PCR: Polymerase Chain Reaction; RANKL: 731
Receptor Activator of NF B Ligand; RER: Respiratory Exchange Ratio; TNF : Tumor Necrosis 732
Factor alpha; TracP: Tartrate-Resistant Acid Phosphatase; Ve: Vehicle. 733
734
735
736
737
738
739
740
Figure
Figure
Figure
Figure
Figure 5
Figure 6
Figure 7
Supplemental Material