CRARACTERIZATION OF FLAW SRAPE AND ORIENTATION USING ULTRASONIC ANGULAR SCANS
INTRODUCTION
D. K. Hsu, S. J. Wormley, and D.
o.
Thompson Ames Laboratory, USDOEIowa State University Ames, IA 50011
To exploit theoretical advances in elastic wave inverse scattering, an automated multiviewing ultrasonic transducer system and the associated signal processing algorithms have been developed at the Ames Laboratory for the reconstruction of the size, shape, and orientation of volumetric flaws [1]. The flaw sizing algorithm is based on elastic wave inverse scattering theories in the long and intermediate wavelength regime [2,3] and the three-dimensional reconstruction algorithm finds the equivalent ellipsoid that best fits the flaw sizes in the various viewing directions
[4,5]. The original multiprobe system consists of six peripheral transdu-cers equally spaced in a circle surrounding one transducer at the center. The peripheral transducers may be tilted at an angle toward the center to increase the aperture and can also be translated along their respective axes to allow an equilization of the acoustic propagat ion time. The axis of the aperture cone is normally placed perpendicular to the part surface. The flaw sizing procedure was a one-dimensional inverse Born algorithm to determine the flaw's centroid-to-tangent plane distances for a number (norma11y 13 or 19) of pu1se-echo or pitch-catch scattering directions within a finite aperture cone. The f1aw sizes are then used as inputs to a nonlinear 1east squares regression program to yie1d a complete geometric reconstruction in the form of three semi-axes and
three Eu1er ang1es of the best-fit e1lipsoid. Using this system, successfu1 reconstructions have been obtained for both oblate spheroida1 (disk-1ike) and prolate spheroida1 (rod-1ike) inclusions and voids. The readers are referred to a complete description of the system in Ref. 1.
Recently, efforts have been devoted to the assessment of the recon-struction reliability as a function of the aperture size and the signal-to-noise ratio of the flaw waveforms [6]. Of particular interest is the effects of flaw orientat ion on the reconstruction reliability [7]. Computer simulations of the reconstruction errors were made for flaws untilted and tilted with respect to the viewing aperture. For the same aperture size, the reconstruction errors were much greater for a tilted
in the scattering amplitude spectrum. Examples are edge-on views of a disk-like flaw or end-on views of a rod-like flaw. As a result, a larger aperture containing the same number of scattering directions (kept as a constant for speed considerations) may not be sufficient in improving the reconstruction reliability. Besides, the aperture size has practical limits in a single-side access inspection situation. A more advantageous approach is to tilt the interrogation aperture to compensate for the particular flaw orientat ion and to restore the leverage for a reliable reconstruction. To do so, some prior knowledge about the flaw shape and orientation is required. In this work an angular scan method is developed in which the flaw shape and orientat ion are estimated from azimuthal and polar scans of the flaw signal amplitude. Based on such preliminary determinat ion of flaw shape and orientation, an aperture orientat ion may then be chosen so that the aperture axis is perpendicular to the flaw surface where the total curva ture is a
m~n~mum. The angular scans and the judicial choice of the aperture
configurat ion for data acquisition have several advantages: the signal-to-noise ratios of the flaw waveforms are improved, the flash point inter-ference phenomena are avoided, and the symmetry planes determined in the angular scans allow two-dimensional cross-sectional reconstructions in the principal planes of the ellipsoid-like flaws.
RECONSTRUCTION OF TILTED FLAWS
To assess the reconstruction reliability for tilted flaws using the multiviewing transducer system, two flaws were studied: a short section of copper wire (160pm dia. x 400pm) tilted 45° in a thermoplastic host and a 400 x 200pm oblate spheroidal void in titanium tilted 30°. Using a data acquisition aperture perpendicular to the part surface, the usual reconstruction procedure failed to yield good results for both tilted flaws. However, when the aperture was tilted to compensate the flaw orientat ion , excellent reconstructions were obtained for these tilted flaws. These experiments clearly demonstrated the advantages of conducting the construction with an aperture perpendicular to the flattest part of the flaw surface. Because the orientat ion of the flaw under investigation is generally unknown, an angular scan plan was developed to obtain this informat ion.
ANGULAR SCAN METHOD
In the high frequency regime the principles of geometrical optics apply and the amplitude of the ultrasonic signal backscattered from a flaw should be proportional to
I
plP2 where Pl and P2 are the principal radii of curva ture at the point where the wavefront makes contact with the flaw surface. The high frequency regime is characterized by ka»l, where k is the wavevector and a is some characteristic size of the flaw. The product PlP2 is refered to as the total curva ture (or Gaussian curva-ture) of the flaw surface at the contact point. For an ellipsoid it can be shown that IplP2 = AxAyAz/r~ where Ax, Ay and Az are the semiaxes of the ellipsoid and re is the center-to-tangent plane distance for the scattering direction [8]. The value of re depends on the sizes of the semiaxes as well as the orientat ion of the flaw [5]. (The signal amplitude also depends on the impedance mismatch between the flaw andComputer Simulation
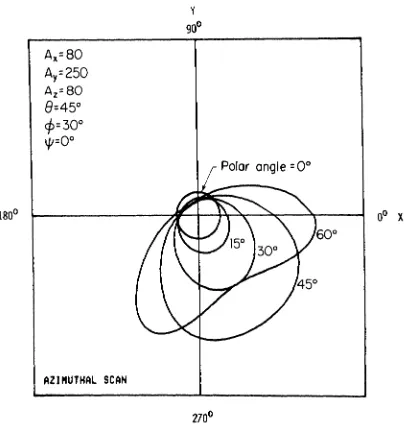
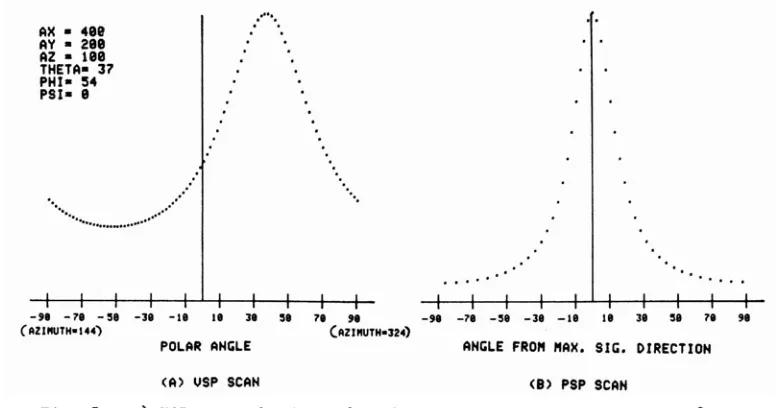
To illustrate the flaw shape and orientat ion estimation, we computed the high frequency signal amplitude (AxAyAz/r2) for a prolate spheroid with Ax=Az=80~m, Ay=250~m, and with the majoreaxis of the prolate pointed at an azimuthal angle of 120° and a polar angle of 45° in the laboratory coordinates fixed on the sample. Figure 1 shows azimuthal scans at five polar ang1es: O, 15, 30, 45, and 60°. The distance from the origin to a point on the curve represents the amplitude of the computed flaw signal. As can be seen, a plane of mirror symmetry exists at an azimuthal angle of 120° (or 300°). A polar scan at this azimutha1 angle, shown in Fig. 2(a), shows a peak at a=45° and 8=300°; thus revealing the tilt ang1e of the pro1ate flaw. Here we use the notations a and 8 for the polar and azimutha1 ang1es, respectively. A second scan in a plane
containing the direction of maximum signal (a=45°, 8=300°) and perpendicular to the plane of mirror symmetry is shown in Fig. 2(b). (The second
scan requires changing the polar angle a and the azimutha1 angle 8 simulta-neous1y). The second scan shows a constant signal amplitude; thus confirming the prolate spheroidal shape of the f1aw. For the convenience of discussion, we shall caII the plane of mirror symmetry containing the normal to
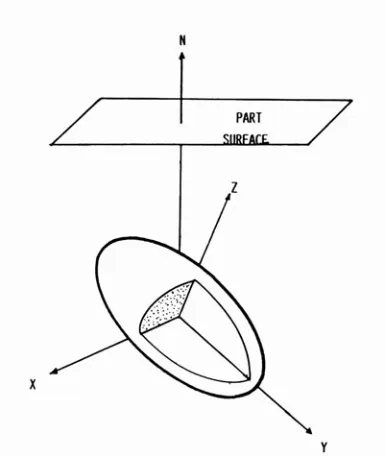
the part surface the vertical sagitta1 p1ane (or VSP). The VSP bisects the flaw and is normal to the part surface. The p1ane of the second scan perpendicular to the VSP and also bisecting the flaw, is ca1led the perpendicular sagittal plane (or PSP), as shown in Fig. 3.
The angular scan pattern of a general el1ipsoid characterized by semiaxes Ax=400~m, Ay=200~m, Az=100~m and Eu1er ang1es 9=37°, ~=54°, and W=O° is shown in Fig. 4. Pictoria11y, the long axis of the el1ipsoid lies a10ng an azimutha1 ang1e of 144° (or 324°) and the tip in the second quadrant is tilted out of the figure. The symmetry of the pattern in Fig. 4 shows that the VSP is at an azimutha1 ang1e of 144° (or 324°). The VSP and PSP scans are shown respectively in Figs. Sa and b. As can be seen, the VSP curve shows a peak at the expected 37° and, because
1800
A,=80 Ay=250 Az=80 8=45° 4>=30° '1'=0°
00 x
[image:3.505.154.356.408.622.2]AX - ee
AY - 251
AZ - .1 THETA- 45 PHr- 31 PSI-I
.~
...
_....
_... .
.'
-ti -1' -se -31 -II II 31 se 11 " AZ I MlTH- I 21
POLAR AHlilE (A) USP SCAH
AZIIlUTH-JH
-ti -71 -51 -3'
-1'
II li ,. 11 ,.AHlilE FROM MAX. SIli. DIRECTION (8) PSP SCAH
Fig. 2. a) Scan in the vertical sagittal plane revealing the 45° tilt angle of the flaw. b) Scan in the perpendicular sagittal plane revealing the prolate shape of the flaw.
"
x
y
Fig. 3. yz plane is the vertical sagittal plane (containing the normal to the part surface). xz plane is the perpendicular sagittal plane.
[image:4.505.60.448.32.224.2] [image:4.505.153.346.292.520.2]A.=400 Ay=200 Az=IOO 8=3r cp=54°
.p=oo
00 Polar ongleFig. 4. Computed angular scan pattern of a general ellipsoid .
AX - 411
AV - ZII AZ - III
THETA- J7
PHI- ~4
PSI- I
'f
...
.,' [image:5.505.149.384.28.253.2].
....
...
..
...
,.'
.
'.. .. ..
. ....
-fI -71 -SI -li -II II l i SI 7 1 " -,. -71 -SI -li -II II 31 5. 71 ,. ( AZ IIIUTHo 144) (AZI IIIITNo324)
POLAR AH"LE AH"LE FRO" "AX. SIC. DIRECTIOH
(A) USP SCAH (8) PSP SCAH
[image:5.505.65.454.441.645.2]Using computer simulation, the angular scans of a large numbe'r of flaw shapes and orientations have been studied. It was noticed that spheroidal flaws of any orientation always have a VSP. A VSP also exists for general ellipsoids if the third Euler angle ~ is zero. The angular
scan of a general ellipsoid with a nonzero ~ possesses no mirror symmetry. Further investigations are needed to extract its orientat ion information and to distinguish it from nonellipsoidal flaws. Based on this rather extensive simulation study, a flow chart, as shown in Table 1, has been made for characterizing the shape and orientat ion of ellipsoidal flaws.
COMPARISON WITH EXPERIMENTS
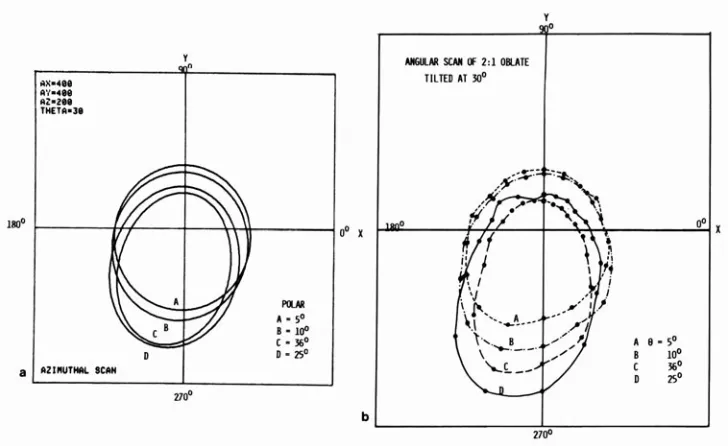
To compare with the predicted signal amplitude contours in angular scans, we obtained experimental data on a tilted oblate spheroidal void in titanium. The sizes of the flaw are Ax=Ay=400~m and Az=200~m. The
azimuthal and polar angles of its z-axis (normal to the "flat" surface) are respectively 255° and 30°. Experimental data in Fig . 6(a) show that the VSP occurs near the expected azimuthal angle of 255° and that the signal amplitude at this azimuth first increases with polar angle and then decreases after the polar angle exceeds the tilt angle 30° of the oblate flaw. The frequency spectrum of the transducer used in the angular scans is such that ka ranges approximately from 0.5 to 3. As a comparison, the computed high frequency limit signal amplitude contours are shown in Fig. 6b. Although the computed results are made for the large ka limit, they clearly display qualitatively the same features as the experimental results. It should also be noted that the experimental data represent the raw flaw signal amplitude without correcting for diffraction and interface refraction effects, except
':'>:"4" 111'1 · ....
_:_2" TMlTII·lI
1110" r----j1H- --t----\'iMt-- ----10" x
'110·
PIUIt
li. SO
•• 10"
C • 36° D·25°
.lll'.ll.NI SCAI Il' 2: 1 01U1I
lIlm Al1AJo
A 9· 5· a 10"
C 36· D '15°
o" x
b ~ ____________ ~~ ____________ -J
2/0"
[image:6.505.72.436.399.622.2]Table 1. Flow chart for flaw shape characterization based on angular scans of the flaw signal amplitude. ---{ Nonellipsoidal
I
Planes of mirror symmeter1
NO .. General-ellipsoid and
1jJ " O YES One mirror
I
~
Two mirrorJ
Axial symmetry symmetries symmetryI
Scan inI
Scan in two Degenerate YES SphericalI
VSP, PSP symmetry planes contours flaw (one circle) NOI
l
VSP PSP VSP Sig.=Const. Signal Signal. Signalt
·PSP ·const. ;PSP in one plane varies in as ~t as ~t
I
I
both planes I Titled Titled Tilted Min. atl
Max at oblate prolate general ~=O ~·Oellipsoid but
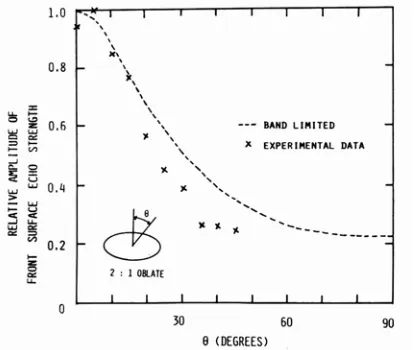
that the acoustic propagat ion time was equalized for the various look angles. The important conclusion to be drawn from this comparison is that the symmetry and Gaussian curva ture of the flaw surface are such strong features that they are observable even in the intermediate frequency regime . Furthermore, the flaw signal amplitude is dominated by the
front surface o-function of the impulse response, which conta ins most of the high frequency components.
To investigate the angular dependence of the flaw signal amplitude (the front surface echo strength) more quantitatively, a polar scan was made in the VSP of the 2:1 oblate and the results are shown in Fig. 7. The experimental flaw signal was proces sed with the measurement model algorithm [9] to correct for diffraction and refraction effects in order to extract the front surf ace echo strength of the impulse response function the experimental results are shown in Fig . 7 as crosses. As a comparison, the dashed line in Fig. 7 represents Opsal's calculated resul ts [10] bandlimi ted by the transduc.er response used in the experiment. Although the experiment and the calculation show some discrepancy, the trend supports the conclusion reached above.
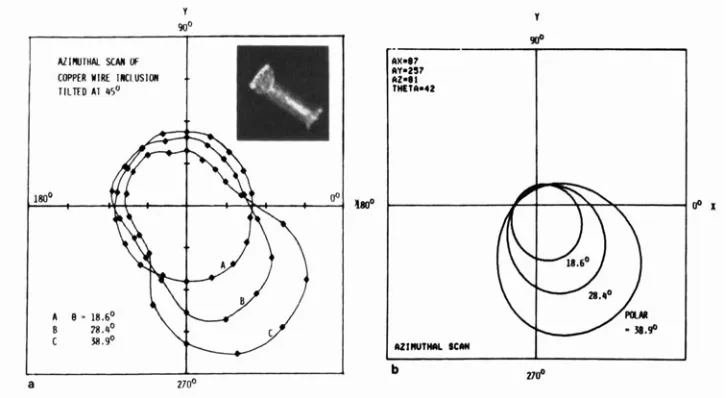
In Fig. 8 we compare the experimental and computed angular scan
contours of a copper wire inclusion tilted 45°. The experimental amplitude contours clearly differ from the computed results by having a bulge
in the second quadrant. This difference, in fact, was caused by a strongly
1.0
0.8
0.2
\
"\
d)
1 , 1 OIllAT[
lO
--- BAND LUUTED
x EXPE R I ~HTAL DA TA
-
-
" ,"
.
•
---60 90
e (D€GREESl
[image:8.505.153.360.454.629.2]reflecting flat facet on one end of the copper wire (cut by a wire cutter, see micrograph inset). This shows that the angular scan contours are sensitive to detailed surface features of the flaw. A PSP scan perpendi-cular to the axis of the wire section is shown in Fig. 9. As expected, the signal amplitude is a constant. In contrast, the PSP scan of the oblate spheroid tilted 30° (also shown in Fig 9) shows a peak.
CONCLUSIONS
We have deomonstrated that angular scans of the flaw signal amplitude cannot only reveal considerable flaw shape and orientation informat ion , but also may be used to position the finite aperture of the multiviewing apparatus for a spatial data acquisition pattern that greatly improves the reconstruction reliability. The angular scan method has therefore provided an alternative approach for flaw reconstruction using the multi-viewing transducer system. Instead of determining the full flaw character-ization (size, shape, and orientation) by relying on the iterative fitting of the sizing data to the best-fit ellipsoid, the approximate shape
and orientation of the flaw may be first determined with angular scans of the flaw echo amplitude prior to any sizing measurements. It should be stressed that the angular scan method is not limited to any particular flaw sizing inversion algorithm. Instead, it is a preliminary step that provides useful information to make the subsequent sizing and recon-struction more stable and reliable. Future work will be directed toward extracting more quantitative information such as aspect ratios and develop-ing reconstruction methods based on the Gaussian curva ture of the flaw surface.
a
Al IIIJ IHAl SCNI ()'
COPP(A ~ IR( 1IICtl/S laI III n:c AI os·
ZIrf'
I---F--+--~~"T---...j fi' I
AlJIIJ'''' ltMI
b
[image:9.505.71.434.446.645.2]'"
"
:o
~ OI 'O
lor----r---.r---,----r----r---,
Ti,30·
6
,g
4îi.
E
<l:
"
.c
•
•
•
•.
.
.
~ 2 CW-l
•
?6~O--~~--~--~O~--2~O----4LO---J60
e-(deQ)
Fig, 9. PSP scans of the copper wire inc1usion and the ob1ate spheroida1 void in titanium. Here 9 is the ang1e measured from the maximum signa1 direction.
ACKNOWLEDGEMENT
The Ames Laboratory is operated for the U.S. Department of Energy by Iowa State University under Contract No. $-7405-ENG. This work was supported by the Director of Energy Research, Office of Basic Energy Sciences.
REFERENCES
1. D. O. Thompson, S. J. Worm1ey, and D. K. Hsu, "Apparatus and tech-nique for reconstruction of f1aws using mode1-based elastic wave inverse u1trasonic scattering", to be published in Rev. Sci. Instrum., Dec., 1986.
2. J. H. Rose and J. A. Krumhans1, J. App1. Phys. ~, 2951 (1979).
3. J. M. Richardson and K. Fertig, in Proc. DARPA/AF Review of Progress in Quantitative NDE, AFWAL-TR-80-4078 (1980), p. 528.
4. J. H. Rose, R. K. E1s1ey, B. R. Tittmann, V. V. Varadan, and V. K. Varadan, in Acoustic, Electromagnetic, and Elastic Wave
Scat-tering--Focus on the T-Matrix Approach, Edited by V. K. Varadan and V. V. Varadan (Pergamon, NY, 1980), p. 605.
5. D. K. Hsu, J. H. Rose, and D. O. Thompson, J. App1. Phys. 55, 162
(1984).
--6. S. J. Worm1ey and D. O. Thompson, "Error sensitivity of long and intermediate wave1ength f1aw reconstruction", in Review of Progress in Quantitative NDE, 4A, D. O. Thompson and D. E. Chimenti,
Eds., (P1enum Press, NY, 1985), pp. 203-211.
7. S. J. Worm1ey, D. K. Hsu, and D. O. Thompson, "The effects of flaw orientation and finite aperture on model based reconstruction using mu1tiprobe transducers", ibid, 5A, pp. 529-539 (1986). 8. D. O. Thompson and S. J. Worm1ey, "Absolute magnitude of front
surface ref1ections in u1trasonic measurements", ibid, 3A, pp.
385-393 (1984).