This article is based on the presentation at the 7th Thai Society of Mechanical Engineers-International Conference on Mechanical Engineering, (TSME-ICoME 2016) in Chiang Mai, Thailand, 13th-16th December 2016.
Article
Heat Transfer Behavior and Physiological Effects of
Living Human Skin under Local Radiative Thermal
Stimulation
Sinichi Kinoshita
a,*and Atsumasa Yoshida
bDepartment of Mechanical Engineering, Osaka Prefecture University, 1-1 Gakuen-cho, Naka-ku, Sakai, 599-8531, Japan
E-mail: akinosita@me.osakafu-u.ac.jp (Corresponding author), bayoshida@me.osakafu-u.ac.jp
Abstract. In order to develop a moxibustion treatment device that can heat appropriately
by radiation while lowering the risk of burning by the moxa, a local radiative heating device for skin was fabricated and the unsteady response of the skin surface and internal temperature during infrared radiative heating were evaluated based on subjective experiments and numerical analysis. Because it was necessary to perform non-contact temperature measurements of the heated surface to control the heat, methods of evaluating and correcting the impact on measurement precision were studied. The study clarified that as skin was heated, the skin surface temperature rose, and the blood flow speed around the heated part increased. A local thermal sensation corresponded to the increase. Absorption of radiation by skin occurred only near the surface, so it was concluded that a useful way to effectively heat skin, was to set a certain temperature as the upper limit of the surface temperature, and lower the heat when this temperature has been reached, wait for the heat to penetrate more deeply, then restart heating.
Keywords: Radiative heating, biological heat transfer, physiological response, numerical
analysis, subjective experiment.
ENGINEERING JOURNAL Volume 21 Issue 7
1.
Introduction
Moxibustion treatment, which is an oriental method unlike modern medical treatment, is used as heat treatment to maintain health and to treat diseases [1]. Moxibustion treatment is used to heat acupoints and diseased parts by burning moxa taken from the backs of the leaves of mugwort on the skin to mitigate various symptoms. When skin is thermally stimulated, erythema and localized swelling appear and the skin temperature at the stimulated locations rises [1]. Both the erythema and localized swelling reactions spread widely through bifurcation of axons, so it is said to be a reaction caused by the axon reflex. The axon reflex is expressed even if the medulla of the neurofibroma is severed, so it has been confirmed that it is a reflex that does not pass through the brain, spinal cord or other nerve center. This axon reflex does not occur only on the periphery of the stimulated location; the axon reflex acts at a higher part far from the stimulated part to also be expressed in parts far from the stimulated part. Stimulation of feet or hands occasionally causing the rise of skin temperature on upper and lower limbs is a result of an axon reflex at a higher part far from the stimulated location. Characteristics of moxibustion treatment that can be mentioned are its long history based on practical medical science, the fact that it permits simple treatment without side effects, and its non-invasiveness. But because past moxibustion treatment has been based on facts empirically obtained from subjective statements, there have been almost no cases of the quantitative evaluation of the increase of the temperature of parts heated by moxibustion treatment. It is important to accurately clarify temperature change of heated parts in order to consider the risk of low-temperature burns.
Kimura et al. [2] measured the skin temperature of stimulated parts and skin temperature of the soles of feet by jointly using infrared stimulation and acupuncture stimulation of the interscapulum and pelvic region. The results showed that by also using acupuncture stimulation, the skin temperature of the stimulated part, skin temperature of the soles of the feet, and the deep temperature were each higher than when only infrared stimulation was done. Kimura [3] clarified the fact that the skin sympathetic nerve activity (SSNA) made only a small contribution to change of skin blood flow caused by acupuncture stimulation. Skin sympathetic nerve activity is activity that causes perspiration and encourages a biological reaction in the skin that increases blood flow. Okubo et al. [4] used near-infrared spectroscopy to measure differences in stimulated parts in trapezius muscle during acupuncture stimulation and moxibustion stimulation and the tissue blood volume in the center and outside of the acupoint. The tissue blood volume increased significantly during the period of rest in both the acupuncture stimulation and moxibustion stimulation cases. It showed that the central stimulated part (center of the acupoint) increased significantly more than outside the stimulated part (outside the acupoint). Sato et al. [5] performed a time-series evaluation of blood circulation trends in endocranial blood vessels during indirect moxa treatment of the “gokoku” acupoint (the base part between a thumb and a forefinger on the back side of the hand) by measuring the cerebral blood flow using the Doppler method, discovering that the blood flow increases. Maruyama et al. [6] developed an abdomen heating device that can perform highly precise temperature control, and quantitatively evaluated the heat treatment by performing clinical testing of patients. The maximum heating temperature which the patients reported to be comfortable did not appear to be correlated with sex or BMI value, but the older the patient, the higher maximum heating temperature. The internal body temperature distribution during treatment with the abdominal heating control device was calculated by numerical analysis. The results revealed a small increase of the temperature or the internal organs, so it was concluded that the effect of heat treatment was the indirect stimulation of the functions of the internal organs by the action of autonomic nerves. The past research outlined above shows that the greater the quantity of stimulation by heat stimulation, the greater the effectiveness of the treatment. But away from the acupoint, either the stimulation is not very effective or completely ineffective. The change of the blood flow is caused by change of the muscle blood flow during skin stimulation, and it is reported that cerebral blood flows changes during skin stimulation. There is a constant relationship between age and the optimum heating temperature that is considered to be the most comfortable stimulation temperature, and the intervention of an individual thermal sensation is predicted.
unsteady response of the skin surface and internal temperature were obtained by a numerical calculation. The physiological response during radiative heating of the skin was also evaluated.
2.
Evaluation of Heat Transfer of the Organism Simulation Sample Accompanying
Radiative Heating
To develop an electronic moxibustion device, an accurate non-contact method of measuring the surface temperature of a specimen that has been radiatively heated must be established. It is also important to measure the internal temperature of the specimen in order to evaluate effectiveness of indirect moxa treatment and to study safety to prevent burning. This section uses agar, which is the organism simulation sample, to analyze factors related to non-contact measurement of the sample surface temperature. And the temperature inside the sample is measured and compared with the numerical simulation to clarify the characteristics of heat transfer from the surface to the interior of the sample.
2.1. Experimental Apparatus and Method
Figure 1 shows a schematic diagram of the heating test device. The ceramic heater dimensions are 25[mm] × 25[mm], it is 2mm thick, and it houses an R-typed thermocouple to measure the temperature of the heater. The heater is inserted between two thermocouples with dimensions of 40[mm] × 40[mm] and thickness of 25[mm] (Isowool board, heat resistant temperature of 1,000[°C]) and the surface to be heated is radiated from the heater surface through a hole with section of 22[mm] × 22[mm] formed inside heat-resistant material. Ceramic has low emissivity so it is coated with a heat-heat-resistant black coating. The emissivity of the heater radiative surface is 0.96[-]. On one side of the heat-resistant material, a hole is bored in order to measure the heated surface temperature with an infrared thermometer. Heating is done by electro-conductive heating and radiating the heat from a high-temperature ceramic heater. The temperature of the heater is adjusted to the specified temperature by varying the applied voltage. The temperature of the inside surface of the heat-resistant material is measured using a T-typed thermocouple.
The surface temperature of the heated object was measured using an infrared thermometer (measuring range: 0 to 500[°C], reproducibility: ±0.5[°C]) and a T-typed thermocouple. The radiation temperature sensor was installed at a location where it was directed diagonally toward the heated surface in order to minimize the impact of the high-temperature heater. The measurement area was a range with diameter of about 6[mm] from around the heated surface. The measurement area of the infrared thermometer could be finely adjusted using an x-axis stage and rotating stage. The heater unit and infrared thermometer were fixed on a single pedestal, and a z-axis stage fixed to this pedestal could integrally adjust the distance from the heated surface. To develop a portable electronic moxibustion device, an infrared thermometer was used to measure the surface temperature.
Fig. 1. Schematic of the experimental apparatus (heater unit, temperature measurement device and specimen).
Specimen (agar gel) Ceramic heater
Infrared thermometer
Voltage
converter Data logger
Thermocouples
40 25 22
25
25 20
2
[image:3.595.92.512.546.737.2]A heating test was done with agar used as the simulation sample. The agar concentration was a weight ratio of 1% and it was 20[mm] thick. T-typed thermocouples were installed in the center of the sample at five points in the depth direction. The installation locations were the surface and depths of 2, 4, 6, and 8[mm]. The inner wall surface temperature of the container was also measured. The test conditions were heater temperature of 350[°C] and heating time was 20[min].
The heater temperature stabilized 10[min] after the heater was supplied with power. To prevent the sample from being heated during this 10[min] period, a wood panel of thickness 10[mm] covered with aluminum foil as an insulation material was prepared. After having sandwiched it between a heater unit and samples, the heating of the heater was started. When the heater temperature was achieved to the specified temperature, a shutter was inserted in the lower part of the heater, and a wood panel was removed. The heater unit was brought close to the sample surface, and a shutter was opened afterwards, and the measurement was started.
The output of the infrared thermometer used to measure the surface temperature was also impacted by the energy that the heater and inside wall of the heater reflected from the agar. The following is the relational equation for the surface temperature of the sample.
(1)
Where, a[-]: emissivity set on the infrared thermometer, 'a[-]: emissivity of the agar, hea[-]t: emissivity of
the heater, wall[-]: emissivity of the interior inner wall around the heater, TA[K]: value measured by the
infrared thermometer, Ta[K]: surface temperature of the agar, Theater[K]: heater temperature, Twal[K]: inner
wall temperature, F1: radiation shape factor of heater according to the agar, F2: radiation shape factor of
the inner wall according to the agar. For each emissivity,a=0.97[-] and heater=wall =0.94[-]. According to the
coefficient of relationship, F1=0.164, if it is assumed that the heated part is enclosed only by the heater and
heater inner wall, F2=0.836.
2.2. Numerical Analysis
Figure 2 shows the model used for the numerical analysis. The numerical analysis was done assuming that a flat heater with diameter of 20[mm] is installed at a fixed height above the heated surface. Radiation from the heater and its inner wall was presumed to be applied uniformly only to an area with diameter of 20[mm] in front of the heater. It was thought that the heat transport phenomenon is uniform in the circumferential direction around the central axis of the heater, and can be represented axisymmetrically in two dimensions. The temperatures of the heater surface and of the surface of its inner wall were Theater=350[℃]and
Twall=145[℃], their emissivity was heater =0.94[-] and it was gray-body radiation. The agar was 20[mm] thick
in the depth direction and its interior was uniform. The basic formula used is the following thermal conduction equation. The physiological response such as blood flow and metabolism is not included.
rad
q
z
T
k
z
r
T
rk
r
r
t
T
c
1
(2)Where, [kg/m3]: density of agar, c[J/(kgK)]: specific heat of agar, T[K]: temperature, t[s]: time, r[m]:
distance from the central axis in the radial direction, k[W/mK]: thermal conductivity, z[m]: distance from surface in depth direction. qrad[W/m3] represents the heat generating rate according to radiation absorption,
which is found by the following formula.
1 2 1 2 ) ( ) ( d F a I z d
dz z dI F q i i i i rad (3)
Where, F: shape factor of heated surface viewed from heater surface, I[W/(m2m)]: spectral radiation
intensity, a[1/m]: spectral absorption coefficient, [m]: wavelength. The shape factor was set at F=0.164 to
match test conditions. The spectral absorption coefficient was presumably equal to that of liquid water [7].
4 2 4 1 4 4 ) 1 ( ) 1
( a heater wall a wall
heater a
a A
aT T FT FT
The radiation radiated from the heater surface was black-body radiation with temperature Theater, and it
conformed to the spectral radiation intensity incident to the sample surface.
Fig. 2. Numerical analysis model (case of the organism simulation sample).
The boundary condition on the sample surface was balanced convective heat transfer at the surface and thermal conduction from the surface to the interior of the sample. The air temperature was 18[°C]. It is presumed that radiation from the heater completely penetrates to the interior without being reflected by the surface. In the radial direction of the center axis, it was so-called insulation condition without any temperature gradient. At the bottom edge and circumferential edge in the radial direction of the sample, the temperature was constant. The initial condition was uniform temperature of 18[°C].
As the numerical solution, based on the finite difference method, secondary precision centered differencing was adapted for the diffusion term and the full implicit method was adapted to the temporal progress. The difference grid was assumed to be 0.02[mm] from the surface to 0.5[mm], 0.05[mm] to 2[mm], 0.2[mm] to 10[mm] and 0.5[mm] to 20[mm] in the depth direction, and 0.2[mm] at equal intervals in the radial direction. The total number of grids in the depth direction was 112. The time interval was assumed to be 0.001[s]. The agar density , specific heat c, and thermal conductivity k were 1.00x10³
[kg/m3], 4.15x10³ [kJ/kg], and 0.607 [W/mK] respectively [8].
2.3. Results and Discussion
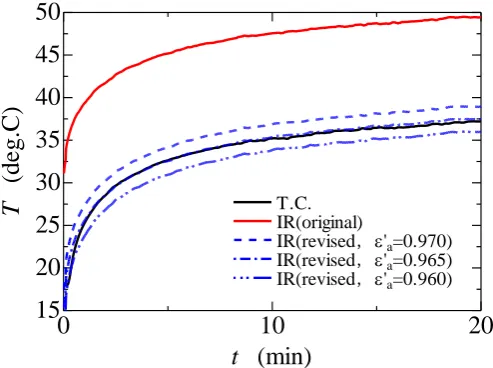
Figure 3 shows the measurement results. The agar surface was heated, raising its temperature to 35[°C]. The measurement values obtained by the infrared thermometer were nearly 15[°C] higher than those obtained by the thermocouples. When the surface temperature was obtained by Eq. (1) assuming the emissivity of the agar was 'a=0.97[-], it differed from the value measured by the thermocouples by about 3[°C]. Figure 4 shows the results in the case where the agar’s emissivity 'a[-] is varied. This shows that if it is assumed that
'a = 0.965[-], it conforms to the values measured by the thermocouples. Figure 5 compares the measurement results and calculation results. The thermal conductivity of the surface impacts the results of the calculation of the surface temperature, so the heat transfer coefficient was decided so that the change over time of both surface temperatures conformed most closely. The thermal conductivity that was decided is 26.2[W/(m2K)]. This revealed that numerical calculation can generally reproduce change over time of the
[image:5.595.156.442.125.363.2]thermophysical properties of the sample such as specific heat. It also reveals that change over time of the temperature inside the layer is large near the surface, but below a constant depth, almost no change of the temperature can be seen.
Fig. 3. Results of measurements of change over time of the surface and interior temperature of the organism simulation sample (agar) (comparison of surface temperature measured by the thermocouples and infrared thermometer).
Fig. 4. Impact of emissivity of the organism simulation sample (agar) on skin temperature obtained from values measured by the infrared thermometer.
0
10
20
15
20
25
30
35
40
45
50
t
(min)
T
(d
e
g.C
)
T.C. IR (original) IR (revised)
0mm 2
4 6
8
Fig.3
0
10
20
15
20
25
30
35
40
45
50
t
(min)
T
(d
e
g.C
)
T.C. IR(original)
IR(revised,'a=0.970)
IR(revised,'a=0.965)
IR(revised,'a=0.960)
[image:6.595.173.422.143.329.2] [image:6.595.175.422.393.577.2]Fig. 5. Comparison of measurement results and calculation results of change over time of surface temperature of the organism simulation sample (agar).
Fig. 6. Comparison of measurement results and calculation results of change over time of temperature distribution in the organism simulation sample (agar).
3.
Evaluating the Surface Temperature Measurements and Physiological Response of
Human Skin Accompanying Radiative Heating
This chapter evaluates the increase of skin temperature and physiological response when human skin was radiatively heated based on testing using human subjects and on numerical calculations.
3.1. Experimental Method
The heating test device is the same as that shown in Fig. 1. To confirm the method of obtaing the skin temperature based on the infrared thermometer, a test heating of the subject’s palm was done at heater temperature of 350[°C]. The skin temperature was obtained according to the output from the infrared thermometer in the same way as explained in the previous chapter. Figure 7 shows the test results. The skin temperature was raised to almost 48[°C] by the heating. The skin temperature obtained by the infrared thermometer was found to conform almost perfectly to the skin temperature measured by the thermocouples.
Heating was done until the subject felt heat pain in order to stimulate the nervous system in the skin to simulate actual moxibustion treatment. Therefore, heating started then ended when the subject felt heat
0
10
20
15
20
25
30
35
40
Measured
Calculated (h=10(W/(m2 K)))
Calculated (h=26.2(W/(m2 K)))
t
(min)
T
(d
e
g.C
)
15
20
25
30
35
40
0
10
20
T
(deg.C)
z
(
m
m
)
[image:7.595.176.421.79.262.2] [image:7.595.176.424.316.500.2]pain. The decision to end heating was, therefore, made when the subject reported feeling heat pain. As testing time, the subject was observed in resting state for 5[min], then heating was started. And assuming the heating time and observation time was 10[min], the total test time was 15[min]. Four subjects were tested, with each tested three times to evaluate individual differences in the thermal response and physiological response of their skin. All the subjects were healthy men in twenties and were medium flesh and height. The heater temperature was 350[°C]. The center of the trapezius muscle on the shoulder was heated. The items measured were the skin temperature of the heated part, blood flow speed around the heated part, average skin temperature (forehead, brachium, back of hand, abdomen, thigh, lower leg, top of the feet), deep temperature, heart rate, local thermal sensation, comfort, air temperature, and relative humidity. The measuring instruments used were an infrared thermometer, a rheometer, a thermistor skin thermometer, an ear thermometer, a heart rate monitor, and subjective reports (local thermal sensation, comfort), a thermometer and a hygrometer. The measurements were made at intervals of 0.5[s], and subjective reports given at intervals of 5[min]. The average skin temperature was obtained by Hardy-Dubois’ 7-point method [9]. A subjective report table is shown in Fig. 8. The subjects were asked to record thermal sensation and comfort state at the reporting time on the lines in the lined part of the report table, then based on ASHRAE’s thermal sensation indices [10], the thermal sensation was converted to -3(cold) to +3 (hot) and comfort was converted to -2 (uncomfortable) to +2 (comfortable).
Fig. 7. Comparison of change over time of human skin surface temperature measured by thermocouples and by the infrared thermometer.
Fig. 8. Local thermal sensation and comfort report table.
3.2. Numerical Analysis
It is important to predict the temperature distribution on and under the skin surface in order to lower the risk of burning on the skin surface, and it is necessary in order to perform heat control to transfer heat into the skin. The heat transfer behavior to and inside the skin surface were analyzed by numerical analysis and the results were compared with the experimental results.
t
(sec)
T
(deg.
C
)
0 10 20 30
20 30 40 50 60
Elapsed time [s] T.C.
IRT(pre-revision) IRT(revision)
T.C.
IR (original) IR (revised)
Fig.7
Discomfort Comfort
Cold Hot
Comfortable sensation Thermal sensation
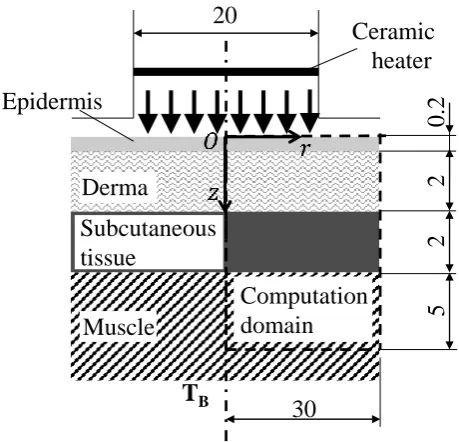
[image:8.595.185.411.307.475.2] [image:8.595.165.430.543.655.2]Figure 9 shows the analysis model. The calculation area is a rectangular area from the skin surface to 5[mm] deep in the muscle layer in the depth direction and 30[mm] from the center axis in the radial direction. The heater is handled in the same way as it was during numerical analysis using gelatin. The temperature and emissivity of the surfaces of the heater and its inner wall were Theater=350[°C], heater=0.94
[-], Twall=145[°C], andwall=0.94[-] respectively. The radiation from the surfaces of the heater and its inner
wall was gray-body. The phenomenon assumed to be reproduced axisymmetrically in two dimensions. The following biological heat transfer formula of Pennes [11] is applied as the basic equation.
rad met a
b b
bc T T q q
z T k z r T rk r r t T
c
) (
1
(4)Where, [kg/m3] and b[kg/m3] are the density of the skin and blood, c[J/(kgK)] and cb[J/(kgK)] are the
specific heat of the skin and blood, T[K] is the skin temperature, k[W/mK] is the thermal conductivity of the skin, Ta[K] is the arterial temperature, b[m3/(sm3)] is the blood perfusion rate, and qmet[W/m3] is the
metabolism. The radiation absorption of the skin is assumed to be based on liquid water. The heat generating rate qrad [W/m3] of radiative absorption can be obtained by Eq. (3). As the structure of the skin
in the depth direction, four layers, epidermis, derma, subcutaneous tissue, and muscle, were considered shown in Fig. 9. The thicknesses of the epidermis, derma, and subcutaneous tissue layers were assumed to be 0.2[mm], 2[mm], and 2[mm] respectively. Thermophysical properties and quantities of state of skin are shown in Table 1 [11, 12]. It is assumed that the biological materials constituting each layer are isotropic, and for tissue other than epidermis and for tissue under the derma, metabolism and blood perfusion respectively were considered. It was assumed that metabolism qmet is identical in all layers at 4,200[W/m3],
and that physical properties and blood perfusion rate were not temperature dependent.
The boundary condition on the surface is balanced convective heat transfer at the surface and thermal conduction to the interior. Deep boundary condition was the deep temperature TB[K]given as a constant
value. TB is obtained by the following equation.
b b b met a B c q T T (5)
The arterial temperature Ta was 38[°C]. If the air temperature is considered to be 25[°C], the initial values
of the skin surface and deep temperature before heating are 36.2[°C] and 38.2[°C] respectively. Initial conditions are steady state before heating and one-dimensional temperature distribution in the depth direction. The boundary on the outside in the radial direction is fixed to its temperature distribution. The temporal interval t was set as 0.0001[s], the spatial interval z was 0.02[mm] for the epidermis and derma,
Fig. 9. Numerical simulation model (case of human skin).
Table 1. Thermophysical properties and blood perfusion rate of each layer of skin [11, 12].
3.3. Results and Discussion
Figure 10 shows change over time of skin temperature and blood flow speed obtained by the second test on subject C. The blood flow speed was measured at the skin surface by a Doppler rheometer. The defined blood flow rate or the blood perfusion rate used in the numerical simulation cannot be measured. Figure 11 shows the correlation of heating time with skin temperature increase, and Fig. 12 shows the correlation of hearing time with blood flow speed increase for three tests of all four subjects. The skin temperature increase and blood flow speed increase values represent maximum increase values after heating. These appearance times were the heating end time for the skin temperature and approximately one minute later of the heating end for the blood flow speed. Figure 10 shows that the skin temperature and blood flow speed both increased at the same time as heating. The heating time in this case is 30[s], and after heating was stopped, the skin temperature fell rapidly, but the rise of blood flow speed continued, showing that it takes much longer than the heating time for the blood flow speed to return to its state before heating. Figure 11 shows that the average skin temperature increase of subject A is slightly higher than that of other subjects. The thermal ache of subject A was assumed to be higher. Therefore heating time of subject A was longer than other subjects. The rise rate in skin temperature of prolonged time was not so large. Figure 12 shows that if the heating time is long, the blood flow speed around the heated part increases greatly. It can be concluded that the blood flow speed is increased by the heat stimulation on the skin reaching the nerve system. And erythema that is often seen during real acupuncture and moxibustion treatment was actually seen during the test. And no significant differences between the average skin temperature and deep temperature were observed. Figures 13 and 14 show change over time of local thermal sensation and comfort respectively. The data of one subject whom the local thermal sensation fell down after heating
Ceramic
heater
T
B30
Derma
Subcutaneous
tissue
Epidermis
20
0.
2
2
2
5
Computation
domain
Muscle
Fig.9
Heat conductivity
(W/(m・K))
Specific heat J/(kg・K)
Density
(kg/m3)
Blood perfusion rate
(m3/(s・m3))
Epidermis 0.45 3300 1200 0.0
Dermis 0.45 3300 1200 1.3 x 10⁻³
Adipose tissue 0.27 3100 950 5.0 x 10⁻⁴
Muscle 0.50 3465 1050 9.0 x 10⁻⁴
[image:10.595.182.412.82.303.2] [image:10.595.155.444.370.483.2]---were removed. These values signify a difference from the state before heating. They show that after heating starts, subjects feel heat and their comfort increases. These changes of state are seen to continue for some time even after heating is stopped.
Fig. 10. Change over time of skin temperature and blood flow speed.
Fig. 11. Correlation of heating time with skin temperature increase.
0
20
40
60
80
100
120
30
35
40
45
50
0
1
2
3
4
5
Skin temperature Blood flow speed
t
(sec)
T
skin(deg.
C)
Blood
flow
spee
d
(m
m
/s)
0 20 40 60 80 100
0 10 20
Heating time (sec)
T
(
de
g.C)
[image:11.595.173.419.367.551.2]Fig. 12. Correlation of heating time with blood flow speed increase.
Fig. 13. Change over time of local thermal sensation.
Fig. 14. Change over time of comfort.
Figure 15 compares measurement and calculation results. It shows that calculated skin temperature is higher than measured skin temperature. So the specific heat and density of the epidermis and derma used
0 20 40 60 80 100
0 1 2 3 4 5
Heating time (sec)
V
(
m
m
/s
)
A B C D
Fig.13
0 5 10 15
-1 0 1 2 3
B C D
Local thermal sensation
t
(min)
T
S
V
(
t
)
T
S
V
(0)
0 5 10 15
-1 0 1 2
t
(min)
B C D
Comfortable sensation
CS
V
(
t
)
CS
V
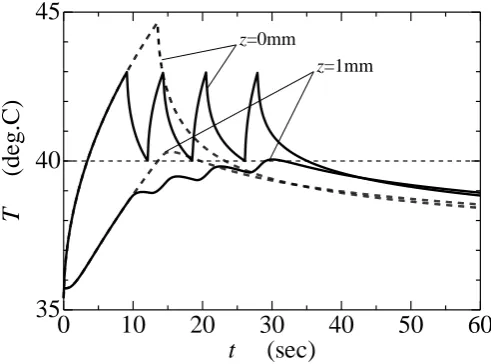
for the calculation were varied. As a result of this operation, the calculated results confirmed to the measured results. It can be concluded that accurate thermophysical properties of skin are very important. However, it is difficult to measure the thermophysical properties of each skin layer in vivo. These values are influenced by individual difference and physical condition. Figure 16 shows a vertical distribution of heat generating rate by radiation absorption. It shows that the heat generating rate near the surface is high, and the heat generating rate inside the skin tends to decline abruptly. Figure 17 shows change over time of temperature distribution of skin layers when repetitive heating was done. The heater and wall temperatures were assumed to be 450 and 188[°C], respectively. The thermal ache was assumed to occur at 40[°C]. When the inner temperature at 1[mm] in depth reached 40[°C], heating was finished. In the case of repetitive heating, when the skin temperature became 43[°C], heating was stopped, and heating was reopened when it returned to 40[°C]. Heating was performed repeatedly until the inner skin temperature at 1[mm] in depth reached 40[°C]. The inner skin temperature raises while avoiding overheat at the skin temperature by heating repeatedly. The inner temperature drop is relaxed after heating, too. To the deeper position, it is thought that heat is conveyed. Judging from observations of thermotherapy, the rise of the skin temperature at a constant depth is important. It clarified that to avoid burning, it is necessary to hold down the increase of the skin temperature, and to realize temperature increase inside the skin, it is necessary to perform repetitive heating.
Fig. 15. Comparison of measurement results and calculation results of change over time of surface temperature of human skin.
Fig. 16. Vertical distribution of heat generating rate by radiation absorption.
0
10
20
30
40
50
60
30
35
40
45
50
t
(sec)
T
(
de
g.C
)
Calculated (=1200[kg/m3], c=3300[J/(kg・K)])
Calculated (= 600[kg/m3], c=2500[J/(kg・K)])
Measured
0
0.1
0.2
0.3
0.4
0.5
0
1
2
[
10
8]
z
mm
Q
rad
W
/m
3
Theater = 300deg.C
heater = 1.0
Tair = 25deg.C
hskin = 10.0 W/(m 2
deg.C)
z
(mm)
q
rad(W/
m
[image:13.595.163.432.542.736.2]Fig. 17. Change over time of temperature distribution of skin layer under repetitive heating.
4.
Conclusions
Heating tests of organism simulation samples and human skin using infrared radiation were done accompanied by numerical calculations. Their impact on measurement precision of non-contact type temperature measurements of heated skin was studied. Numerical calculations of change over time of temperature of the surface and interior were done, verifying their suitability. And the physiological response to skin radiation heating was evaluated. The results obtained are summarized below.
(1) The non-contact measurements of surface temperature using an infrared thermometer obtained results identical to contact measurements by considering the radiation transfer from the surroundings and radiation properties of the specimen.
(2) It showed clearly that in the case where a numerical calculation of radiative heating of skin was performed, the thermophysical properties of each tissue of the skin had a great impact on the calculation results. Radiation absorption of skin was limited to near the surface, and heat transfer by thermal conduction to the inside of the skin was predicted.
(3) Blood flow speed increased along with skin heating. This was a result of axon reflex acting under heat stimulation to the nervous system of the skin, causing erythema. And this impact continued for a fixed period even after heating was stopped. The results of subjective reports of local thermal sensation and comfort also conform to this.
(4) Repetitive heating is an effective way to mitigate the possibility of burning caused by the increase of skin temperature and to increase the temperature of affected part inside the skin as thermotherapy.
Acknowledgments
This research study is an achievement of joint research by Yoshimura Medical Welfare Corporation and this university. We are deeply grateful to Mr. Yoshimura Kazunari and other related members for their support. We are also grateful to Mr. Hosomi Yusuke who was a student in the Master Course at Osaka Prefecture University for his contribution to this research study.
References
[1] M. Hyodo, New Method for Curing Pain: Modern Application of the Oriental Medicine. Tokyo, Japan: Chugai Igakusha, 1969.
[2] K. Kimura, T. Yano, I. Watanabe, M. Hiro, and N. Yamada, “Effect of acupuncture stimulation combined with extreme infra-red rays radiation on both skin surface and deep temperature,” Journal of
the Japan Society of Acupuncture and Moxibustion, vol. 47, no. 2, pp. 42-48, June 1997.
[3] K. Kimura, “Effects of acupuncture stimulation on skin blood flow and skin sympathetic nerve activity,” The Autonomic Nervous System, vol. 38, no. 5, pp. 415-419, Oct. 2001.
0
10
20
30
40
50
60
35
40
45
z=0mm
z=1mm
t
(sec)
T
(
de
g.C
[4] M. Ohkubo, T. Hamaoka, N. Murase, T. Osada, R. Kime, Y. Kurosawa, A. Sakamoto, and T. Katsumura, “Examination of muscle tissue blood volume by acupuncture and noxibustion stimulation using near infrared spectroscopy,” The Journal of Japanese College of Angiology, vol. 46, no. 1-2, pp. 37-43, March, 2006.
[5] R. Sato, T. Fujimoto, M. Mukouyama, H. Ohtaki, and T. Satoh, “The effect of indirect moxibustion on cerebral circulation,” Neurosonology, vol. 13, no. 4, pp. 175 -178, Oct. 2000.
[6] S. Maruyama, S. Takashima, A. Komiya, T. Seki, and T. Yambe, “Thermal therapy and evaluation by precise temperature control device,” Transactions of the JSME, Series B, vol. 75, no. 758, pp. 2055-2059, Oct. 2009.
[7] M. I. William and B. P. James, “Infrared optical properties of water and ice spheres,” ICARUS, vol. 8, pp. 324-360, 1968.
[8] JSME, JSME Data Book: Heat transfer, 5th ed. Tokyo, Japan: Maruzen, 2009.
[9] J. D. Hardy, E. F. Bois, and G. F. Soderstrom, “The technic of measuring radiation and convection: One figure,” Journal of Nutrition, vol. 15, no. 5, pp. 461-475, May 1938.
[10] ASHRAE, ASHRAE Handbook Fundamentals. Atlanta: ASHRAE, 2005, ch. 8.
[11] H. H. Pennes, “Analysis of tissue and arterial blood temperature in the resting human forearm,”
Journal of Applied Physiology, vol. 1, no. 2, pp. 93-122, Aug. 1948.