Article
Motion-Resistant Pulse Oximetry Processing
Based on Time-Frequency Analysis
Theera Leeudomwong
1,a, Tayard Deesudchit
2, and Chedsada Chinrungrueng
3,b,*1 Biomedical Engineering Programme, Chulalongkorn University, Bangkok 10330, Thailand
2 Department of Paediatrics, Faculty of Medicine, Chulalongkorn University, Bangkok 10330, Thailand 3 Department of Electrical Engineering, Faculty of Engineering, Chulalongkorn University, Bangkok
10330, Thailand
E-mail: a[email protected], b[email protected] (Corresponding author)
Abstract. This paper proposes an alternative method for pulse oximetry processing based
on time-frequency analysis. Instead of using the fast Fourier transform (FFT), the continuous wavelet transform (CWT) together with the median calculation was proposed for finding the frequency components of the normalized first derivative red and infrared photoplethysmographic signals (PPG). In order to estimate the arterial oxygen saturation (%𝑆𝑝𝑂2), the ratio of each red CWT modulus to each corresponding infrared CWT modulus was computed at each frequency, and then converted to the oxygen saturation by using the saturation equation obtained from calibration. All of the oxygen saturation data were plotted on a histogram. The greatest oxygen saturation with the most occurrences was considered to represent the %𝑆𝑝𝑂2. The experiments were held to evaluate the performance of the proposed processing method compared with the conventional pulse oximetry (CPO) processing. The red and infrared PPGs were acquired from left and right index fingers simultaneouslyby using the PPG measurement system constructed in the laboratory. During measurement, the left index finger was stationary, while the right index finger was performed the finger bend to induce the motion artifact (MA) in transient and periodic manners. All detected PPGs were processed by the proposed method and the CPO processing. The %𝑆𝑝𝑂2 obtained from different
processing methods and positions were compared. Experimental results showed that the proposed method was more resistant to the MA than the conventional method.
Keywords: Photoplethysmography, pulse oximetry, motion artifact, time-frequency
analysis, continuous wavelet transform.
ENGINEERING JOURNAL Volume 21 Issue 7
1.
Introduction
Pulse oximetry, an optical technique for measuring functional oxygen saturation, was invented by Takuo Aoyagi in 1972 [1, 2]. By this invention, the arterial blood oxygenation can be measured conveniently, quickly, inexpensively, continuously, and non-invasively. Conventional pulse oximetry (CPO) relies on detecting the photoplethysmogram (PPG), of which the amplitude varies with the light absorption of the arterial blood and depends on the arterial blood volume and oxygenation [3]. CPO processing generally requires two PPGs, approximately red and infrared (IR), for finding the ratio of the arterial light absorption between red and IR, which theoretically relates to the arterial oxygen saturation. The pulse oximeter, which is an instrument using the pulse oximetry for measuring the arterial oxygen saturation (%𝑆𝑝𝑂2), plays a significant role in providing
the patient’s oxygen status, and has been extensively used for patient monitoring in critical care units as well as for diagnostic purposes [4, 5].
The motion artifact (MA), an undesired signal induced by body movement, is a major problem of the pulse oximeter using CPO processing. It often misinterprets the MA as the PPG and leads to an inaccurate reading, false desaturation alarm, and missed true desaturation alarms [6].
Over the years, there have been a number of attempts to reduce the impact of MA on CPO processing. A primary method was to improve the probe design, which helped reduce and protect against probe displacement and ambient light interference. Most studies focused on the elimination of MA from the corrupted PPG by applying different signal processing techniques; for example, the Fourier series analysis [7], the adaptive filtering [8-12], the independent component analysis [12-15], and the wavelet transform [15, 16]. A major drawback of these techniques is the overlapping of the frequency band between the MA and PPG.
One possible solution was to develop motion resistant algorithms for pulse oximetry processing instead of the CPO. The main concept of this approach is to revise the conventional PPG model by adding a term representing the attenuation of light intensity induced by movement, and to develop a signal processing method for estimating the %𝑆𝑝𝑂2 from the revised model. Goldman, Petterson, Kopotic, and Barker (2000) and Diab et al. (2009) presented several pulse oximetry technologies developed by the Masimo Corporation. The PPG model was revised in the belief that the MA originated from the variation of light absorption from venous blood and other non-arterial substances as they move. A renowned algorithm is the discrete saturation transform (DST), which is a motion-resistant algorithm implemented by using the adaptive filter [17].
Frequency domain analysis is another interesting approach for pulse oximetry processing. Diab et al. (2009) presented an algorithm based on using the fast Fourier transform (FFT). In this algorithm, the red and IR PPGs are normalized by using the logarithmic method and decomposed into different frequencies by using the FFT. Then, the ratio of each red FFT coefficient to each corresponding infrared FFT coefficient is computed at each frequency. The oxygen saturation relating to each ratio is determined by using the saturation equation. Finally, all of the saturation data are counted on a histogram, and the oxygen saturation with the highest number of occurrences is considered to represent the %𝑆𝑝𝑂2 [18].
According to the algorithm proposed by Diab et al. (2009) mentioned above, we noticed that the efficiency of this algorithm was limited by the resolution of the frequency spectrum provided by the FFT. The low-frequency resolution results in less saturation data, which may lead to misidentifying the %𝑆𝑝𝑂2,
especially when the detected PPGs are corrupted with the MA. Therefore, this algorithm could be more powerful if the spectral resolution of the frequency spectrum can be increased.
In this work, we focused on the development of motion-resistant pulse oximetry processing. We propose an alternative signal processing method based on the time-frequency analysis that improves the algorithm proposed by Diab et al. (2009). Instead of the frequency analysis using the FFT, we suggest applying time-frequency (TF) analysis together with the median calculation in order to increase the spectral resolution of the frequency spectrum of the normalized PPG, resulting in increasing the number of saturation data to be plotted onto a histogram. Therefore, the %𝑆𝑝𝑂2 is revealed more clearly, and can be identified more easily,
relate to the %𝑆𝑝𝑂2 [20]. Details of the proposed processing methods and the experiments are provided in the rest of this paper in more detail.
2.
Materials and Methods
2.1. The Data Acquisition
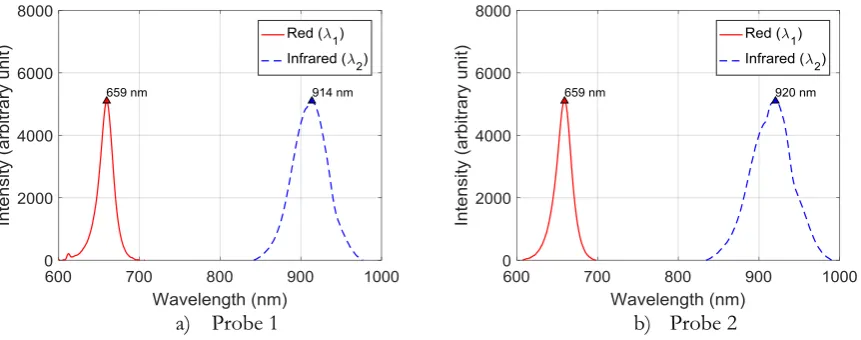
We designed and constructed the PPG acquisition system in our laboratory to detect the red and IR PPGs for the experiments. There were two measurement channels so that both the red and IR PPGs can be measured at two different positions simultaneously. For convenience, we used two commercial pulse oximeter probes. The wavelengths of light emitted from the light source inside each probe were measured using a spectrometer, USB4000-UV-VIS Ocean Optics. As shown in Figs. 1(a) and 1(b), the peak wavelengths of light emitted from the light source inside each probe are 659 nm and 914 nm for probe 1, and 659 nm and 920 nm for probe 2, respectively.
a) Probe 1 b) Probe 2
Fig. 1. The peak wavelengths emitted from the light source inside each probe.
All the detected PPGs were converted into a digital format using 12-bit analog-to-digital converters, and sent to a personal computer for recording and post-processing with MATLAB. The sampling frequency is 50 Hz.
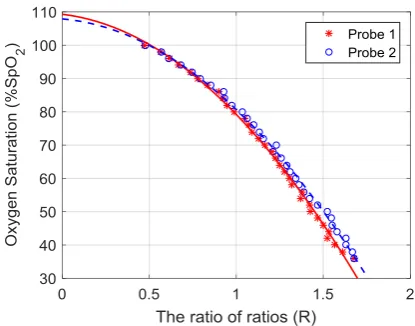
A calibration was performed in order to derive the appropriate calibration curve for measuring the
%𝑆𝑝𝑂2 with each probe using the Fluke Biomedical %𝑆𝑝𝑂2 Simulator Index 2, working as an artificial finger. The calibration curve provides the relationship between the %𝑆𝑝𝑂2 and the ratio 𝑟𝑎, which is the ratio of red absorption to IR absorption due to the arterial blood. The %𝑆𝑝𝑂2 defined at the simulator and the averaged ratio 𝑟𝑎 derived from the measurement were fitted into a second-order polynomial equation. Equations (1) and (2) are the calibration equations appropriate for measuring %𝑆𝑝𝑂2 with probe 1 and 2, respectively. The plots of the %𝑆𝑝𝑂2 versus the averaged ratio 𝑟𝑎 and their fitted calibration curves are shown in Fig. 2.
𝑃𝑟𝑜𝑏𝑒 1 ∶ %𝑆𝑝𝑂2= −23.90 𝑟𝑎2− 6.17 𝑟𝑎+ 109.29 (1)
[image:3.595.78.509.275.445.2]Fig. 2. The calibration curves appropriate for each probe.
2.2. The PPG Model
PPG measurement is normally accomplished by emitting light from the light source to the biological tissue, and detecting the light travelling through the tissue by either reflectance or transmittance mode. In the CPO, the detected PPG is modelled by considering that the light absorbers have two main groups; pulsatile and non-pulsatile tissues. According to the Beer
–
Lambert’s law, the PPG can be modeled as follows:𝐼𝜆(𝑡) = 𝐼
0𝜆𝑒−𝐴𝑎𝑐(𝑡)𝑒−𝐴𝑑𝑐+ 𝑛(𝑡) (3)
where 𝐼𝜆(𝑡) is the detected light intensity, 𝐼
0𝜆 is the light intensity emitted from the light source, 𝐴𝑎𝑐(𝑡) and
𝐴𝑑𝑐 represent the light absorption due to the pulsatile and non-pulsatile tissues, respectively, and 𝑛(𝑡) is the additive noise. Under the assumption that the pulsatile tissue is the arterial blood, which contains only the oxyhaemoglobin (𝐻𝑏𝑂2) and deoxyhaemoglobin (𝐻𝑏), the PPG model can therefore be written as follows:
𝐼𝜆(𝑡) = 𝐼
0𝜆𝑒−(𝜀𝐻𝑏𝑂2
𝜆 [𝐻𝑏𝑂
2]𝑎+𝜀𝐻𝑏𝜆 [𝐻𝑏]𝑎) 𝐿𝑎𝜆(𝑡)𝑒−𝐴𝑑𝑐+ 𝑛(𝑡) (4)
where 𝜀𝐻𝑏𝑂𝜆 2 and 𝜀
𝐻𝑏𝜆 represent the extinction coefficient of 𝐻𝑏𝑂2 and 𝐻𝑏 at the wavelength 𝜆, [𝐻𝑏𝑂2]𝑎
and [𝐻𝑏]𝑎 represent the concentration of 𝐻𝑏𝑂2 and 𝐻𝑏 in the arterial blood, respectively, and 𝐿𝑎𝜆(𝑡)
represents the optical path length of light in the arterial blood at the wavelength 𝜆. The 𝐿𝑎𝜆(𝑡) varies with
the arterial blood volume changing with the cardiac pulsation.
Equation (4) is the conventional PPG model that generally appears in the pulse oximetry context, and is widely used in CPO processing to determine the %𝑆𝑝𝑂2. However, this model works well only when the
PPG is not contaminated with the MA. The 𝐴𝑑𝑐 is no longer constant when the body is moved. The 𝐴𝑑𝑐
becomes 𝐴𝑑𝑐(𝑡) and an error occurs because the CPO processing misinterprets 𝐴𝑑𝑐 as 𝐴𝑎𝑐(𝑡).
Presumably, the MA is caused by multiple factors, such as the movement of the sensor relative to the skin, deformation of tissues due to external pressure, and changes of haemodynamics. These factors directly affect the optical path length between the light source and detector, making the MA contaminated in the PPG. In this study, the conventional PPG model was revised by adding a term describing the attenuation of light caused by the motion as follows:
𝐼𝜆(𝑡) = 𝐼
0𝜆𝑒−(𝜀𝐻𝑏𝑂2
𝜆 [𝐻𝑏𝑂
2]𝑎+𝜀𝐻𝑏𝜆 [𝐻𝑏]𝑎)𝐿𝑎𝜆(𝑡)𝑒−𝐴𝑑𝑐𝑒−𝜇𝑚𝑜𝑡𝑖𝑜𝑛𝜆 𝐿𝑚𝑜𝑡𝑖𝑜𝑛𝜆 (𝑡)+ 𝑛(𝑡) (5)
where 𝜇𝑚𝑜𝑡𝑖𝑜𝑛𝜆 and 𝐿 𝑚𝑜𝑡𝑖𝑜𝑛
𝜆 (𝑡) represent the absorption coefficient of the non-pulsatile tissues and the
optical path length in the non-pulsatile tissues that varies during the body movement, respectively. Among the non-pulsatile tissues, the venous blood is considered to be the main component that changes the most during movement. We consider the term 𝜇𝑚𝑜𝑡𝑖𝑜𝑛𝜆 𝐿
𝑚𝑜𝑡𝑖𝑜𝑛
[image:4.595.184.392.86.249.2]2.3. %𝑺𝒑𝑶𝟐 Estimation Method
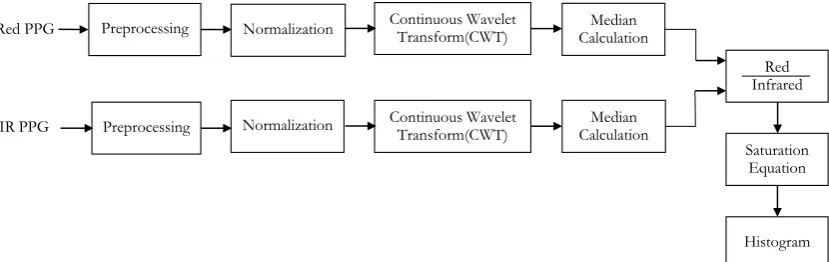
The block diagram of our proposed processing method is shown in Fig. 3. The operation and description of each block is described below.
Fig. 3. Block diagram of the proposed processing method.
2.3.1. Preprocessing
A main objective of the preprocessing is to eliminate the noise and MA outside the frequency band of interest. On the understanding that the maximum human pulse is 240 beats per minute (BPM), or approximately 4 Hz, the raw PPG was preprocessed using a low-pass filter with the cutoff frequency of approximately 5 Hz, in order to cover the maximum desired frequency. We propose applying the Savitzky-Golay (SG) filter, a least-squares polynomial smoothing filter [21], for use as the low pass filter. The SG filter can provide the smoothed PG and its first derivative simultaneously, which are required for the normalization process. After preprocessing, the detected PPG can be described by the following equation:
𝐼𝜆(𝑡) = 𝐼
0𝜆𝑒−(𝜀𝐻𝑏𝑂2
𝜆 [𝐻𝑏𝑂
2]𝑎+𝜀𝐻𝑏𝜆 [𝐻𝑏]𝑎)𝐿𝜆𝑎(𝑡)𝑒−𝐴𝑑𝑐𝑒−𝜇𝑚𝑜𝑡𝑖𝑜𝑛𝜆 𝐿𝜆𝑚𝑜𝑡𝑖𝑜𝑛(𝑡) (6)
2.3.2. Normalization
Normalization is a process used to separate the light absorption of the pulsatile tissues from the non-pulsatile tissues. In principle, the normalization can be performed in several ways, such as dividing by the maximum intensity, dividing by the average intensity, the derivative method, and the logarithmic method. In this study, we prefer and propose using the derivative method because of its simplicity. No additional algorithms, such as peak detection and/or interpolation, are needed in order to perform the normalization. The normalization with the derivative method provides the normalized first derivative PPG as follows:
−(𝑑𝐼𝜆(𝑡) 𝑑𝑡⁄ )
𝐼𝜆(𝑡) = (𝜀𝐻𝑏𝑂2
𝜆 [𝐻𝑏𝑂
2]𝑎+ 𝜀𝐻𝑏𝜆 [𝐻𝑏]𝑎)𝑑𝐿𝑎
𝜆(𝑡)
𝑑𝑡 + 𝜇𝑚𝑜𝑡𝑖𝑜𝑛
𝜆 𝑑𝐿𝑚𝑜𝑡𝑖𝑜𝑛𝜆 (𝑡)
𝑑𝑡 (7)
As seen in Eq. (7), the normalization process transforms the MA from the multiplicative form into the additive form. When there is no motion (𝑑𝐿𝑚𝑜𝑡𝑖𝑜𝑛𝜆 (𝑡)/𝑑𝑡 = 0), the normalized first derivative PPG
provides a term resulting from the arterial light absorption. When there is motion (𝑑𝐿𝜆𝑚𝑜𝑡𝑖𝑜𝑛(𝑡)/𝑑𝑡 ≠ 0), it
provides terms, which are the combination of the arterial light absorption and the MA.
Generally, two wavelengths of light, i.e. red and infrared, are required in pulse oximetry processing. Under the assumption that the variation of the optical path length is equal for both wavelengths, the PPG model for pulse oximetry processing can then be expressed as follows:
𝑥1(𝑡) = 𝑎11𝑠(𝑡) + 𝑎12𝑚(𝑡) (8)
𝑥2(𝑡) = 𝑎21𝑠(𝑡) + 𝑎22𝑚(𝑡) (9)
Normalization
Preprocessing Continuous Wavelet Transform(CWT) CalculationMedian
Red Infrared Saturation Equation Histogram Continuous Wavelet
Transform(CWT) CalculationMedian Red PPG
Normalization Preprocessing
[image:5.595.94.509.154.285.2]where 𝑥1(𝑡) and 𝑥2(𝑡) represent the normalized first derivative of the red and IR PPG. 𝑠(𝑡) and 𝑚(𝑡)
represent the first derivative of changes in the optical path length in the pulsatile and non-pulsatile tissues, respectively. 𝑎11 and 𝑎21 represent the absorption coefficient of the arterial blood at the wavelength 𝜆1 and
𝜆2, respectively. 𝑎12 and 𝑎22represent the absorption coefficient of the non-pulsatile tissues, i.e. the 𝜇𝑚𝑜𝑡𝑖𝑜𝑛𝜆1
and 𝜇𝑚𝑜𝑡𝑖𝑜𝑛𝜆2 , respectively.
The main objective of pulse oximetry processing is to determine the %𝑆𝑝𝑂2by finding the ratio of the arterial light absorption between two wavelengths (𝑟𝑎), which is the ratio of 𝑎11 to 𝑎21. Using Eq. (8) and
(9), this ratio can be determined as follows:
𝑟𝑎=𝑎11
𝑎21=
(𝜀𝐻𝑏𝑂2𝜆1 [𝐻𝑏𝑂2]𝑎+𝜀𝐻𝑏𝜆1[𝐻𝑏]𝑎)
(𝜀𝐻𝑏𝑂2𝜆2 [𝐻𝑏𝑂2]𝑎+𝜀𝐻𝑏𝜆2[𝐻𝑏]𝑎) (10)
Since the definition of functional haemoglobin saturation (𝑆𝑎𝑂2) is
𝑆𝑎𝑂2= 𝐻𝑏𝑂2
𝐻𝑏𝑂2+𝐻𝑏 , (11)
the ratio 𝑟𝑎 is determined as follows:
𝑟𝑎=𝑎11
𝑎21=
(𝜀𝐻𝑏𝑂2𝜆1 𝑆𝑎𝑂2+𝜀𝐻𝑏𝜆1 (1−𝑆𝑎𝑂2))
(𝜀𝐻𝑏𝑂2𝜆2 𝑆𝑎𝑂2+𝜀𝐻𝑏𝜆2 (1−𝑆𝑎𝑂2)) (12)
Note that 𝑆𝑎𝑂2 is changed to 𝑆𝑝𝑂2 to emphasize that it is obtained from the pulse oximetry. After
rearranging the terms, we obtain the theoretical relationship between the %𝑆𝑝𝑂2 and the ratio 𝑟𝑎 as
%𝑆𝑝𝑂2= (𝜀𝐻𝑏𝜆1−𝜀𝐻𝑏𝜆2)𝑟𝑎
𝜀𝐻𝑏𝜆1−𝜀
𝐻𝑏𝑂2 𝜆2 +(𝜀
𝐻𝑏𝑂2𝜆2 −𝜀𝐻𝑏𝜆2)𝑟𝑎
× 100 . (13)
In practice, this relationship is obtained from the calibration. The calibration equation used in this study is described in the previous section.
The ratio of light absorption of the non-pulsatile tissues (𝑟𝑣), which is the ratio of 𝑎12 to 𝑎22, only appears when the MA is present. As the venous blood is considered to be the main component that varies during movement, and the venous oxygen saturation is normally lower than the arterial oxygen saturation, the ratio
𝑟𝑣 is theoretically higher than 𝑟𝑎.
2.3.3. Continuous wavelet transform and median calculation
According to the pulse oximetry model in Eq. (8) and (9), when the ratios 𝑟𝑎 and 𝑟𝑣 are assumed to be constant over the time interval of interest, the frequency domain representation of the pulse oximetry model in Eq. (8) and (9) can thus be expressed as
𝑋1(𝑓) = 𝑎11𝑆(𝑓) + 𝑎12𝑀(𝑓) (14)
𝑋2(𝑓) = 𝑎21𝑆(𝑓) + 𝑎22𝑀(𝑓) (15)
where 𝑋1(𝑓), 𝑋2(𝑓), 𝑆(𝑓), and 𝑀(𝑓) are the frequency domain representations of 𝑥1(𝑡), 𝑥2(𝑡), 𝑠(𝑡), and
𝑚(𝑡) respectively.
The main objective of this stage is to derive the frequency spectrum of the normalized first derivative PPG corresponding to Eq. (14) and (15). Instead of using the FFT, we propose applying TF analysis, which can be accomplished by using the CWT together with the median calculation.
axis every one second, resulting in an overlap of five seconds. The CWT of the normalized first derivative PPG is defined as [19]
(𝑇𝑖(𝛼, 𝛽) =√𝛼1 ∫ 𝑥−∝∝ 𝑖(𝑡)𝜓∗(𝑡−𝛽𝛼 )𝑑𝑡 (16)
where 𝑥𝑖(𝑡) is the normalized first derivative PPG in each time window, 𝜓∗(𝑡) is the complex conjugate of
the mother wavelet function 𝜓(𝑡), 𝛼 is the dilation parameter of the wavelet and 𝛽 is its location parameter. The Morlet function, one of the most popular wavelets used for the biosignal analysis, was chosen to be the mother wavelet, as it was formerly shown to be effective for pulse oximetry processing [20]. The Morlet wavelet is defined as
𝜓(𝑡) = 1
√𝜋
4 𝑒𝑖𝜔0𝑡 𝑒− 𝑡2
2 . (17)
where 𝜔0 is the central frequency of the mother wavelet.
Then, the CWT modulus, |𝑇𝑖(𝛼, 𝛽)|, at the specific 𝛼 scale and 𝛽 location was computed and plotted
into the TF plane. In principle, the wavelet 𝛼 scale is inversely proportional to the frequency (𝑓) as follows:
𝑓 = 𝑓𝑐
𝛼 (18)
where 𝑓𝑐 is the characteristic frequency of the mother wavelet. From the TF plot, the median calculation along the time axis is proposed to determine the frequency spectrum of the normalized first derivative PPG.
2.3.4. Finding the ratio of red to IR
From the frequency spectrum of the normalized first derivative PPG obtained in the previous stage, the ratio of each red CWT modulus to each corresponding infrared CWT modulus (𝑅(𝑓)) was computed at each frequency. Under the assumption that the frequency components of the cardiac pulsation (𝑓𝑎) are different from those of the motion artifact (𝑓𝑣), the ratio 𝑅(𝑓) can be written as the combination of 𝑟𝑎 and 𝑟𝑣 as follows:
𝑅(𝑓) =𝑎11𝑆(𝑓𝑎)
𝑎21𝑆(𝑓𝑎)+
𝑎12𝑀(𝑓𝑣)
𝑎22𝑀(𝑓𝑣)= 𝑟𝑎(𝑓𝑎) + 𝑟𝑣(𝑓𝑣) . (19)
2.3.5. Computing the the oxygen saturation and identifying the %𝑆𝑝𝑂2
The ratio R(f) in each frequency was then converted to the oxygen saturation by using the saturation equation, i.e. Eq. (1) or (2) depending on the probe used. Only the frequency range from 0.5 to 5 Hz corresponding to a pulse rate of 30 to 300 BPM is considered. The calibration curve in Figure 2 implies that the higher the ratio 𝑅(𝑓), the lower the oxygen saturation becomes. As mentioned earlier, the ratio 𝑟𝑣 appears
only when there is the MA and it is normally higher than the ratio 𝑟𝑎. Therefore, there may be variation in
the oxygen saturation, especially when the PPG is corrupted with the MA. In order to identify the %𝑆𝑝𝑂2
2.4. Experiments
Experiments were held to evaluate the proposed method in processing both the clean PPG and the motion- corrupted PPG for determining the %𝑆𝑝𝑂2. The developed PPG acquisition system was used to detect the
red and IR PPGs from a healthy human subject at two different positions, simultaneously. A probe connected to channel 1 was clipped on the left index finger, while another was connected to channel 2 and clipped on the right index finger. The MA was generated by bending the finger. The measurement consists of 3 protocols. For the first protocol, both fingers were stationary. The second protocol was divided into 3 states; resting, moving, and resting, respectively. In the resting states, both fingers were stationary. In the moving stage, the left index finger remained stationary, while the right index finger performed a transient finger bend. The third protocol is similar to the second protocol, except that the right index finger was periodically bent in the moving stage.
All the detected PPG signals were then processed using both the proposed method and the CPO. The
%𝑆𝑝𝑂2 obtained from the proposed method was compared to that from the CPO, and also the %𝑆𝑝𝑂2
measured from the left index finger was compared to that from the right index finger.
For the CPO processing, the ratio 𝑟𝑎 was computed based on using the linear regression analysis (LRA)
as follows [22]:
𝑟𝑎
=
𝑛 ∑ 𝑥𝑖𝑦𝑖−∑ 𝑥𝑖∑𝑦𝑖𝑛 ∑ 𝑥𝑖2−(∑ 𝑥𝑖)2 (20)
where 𝑥 and 𝑦 represent the normalized first derivative red and IR PPG, respectively, 𝑖 represents the sample number, and
𝑛
represents the number of samples.
Then, the ratio 𝑟𝑎 was converted to the %𝑆𝑝𝑂2 byusing Eq. (1) or (2) depending on the probe used.
2.5. Performance Measurement
The Bland
–
Altman analysis [23], which is a statistical method for comparing two different measurement techniques, was used to compare the %𝑆𝑝𝑂2 measured from both methods and positions. The bias is defined as the mean difference between the two methods (𝑑̅), the precision is defined as the standard deviation (𝑠) of differences, and the limits of agreement (LOA) indicating the boundary of the 95% of difference is defined as 𝑑̅ ± 1.96𝑠. As the left index finger was stationary in all measurement protocols, the %𝑆𝑝𝑂2 obtainedfrom the CPO at channel 1 was used as a reference. An LOA of less than ±3% is considered to be clinically acceptable [24].
3.
Results and Discussion
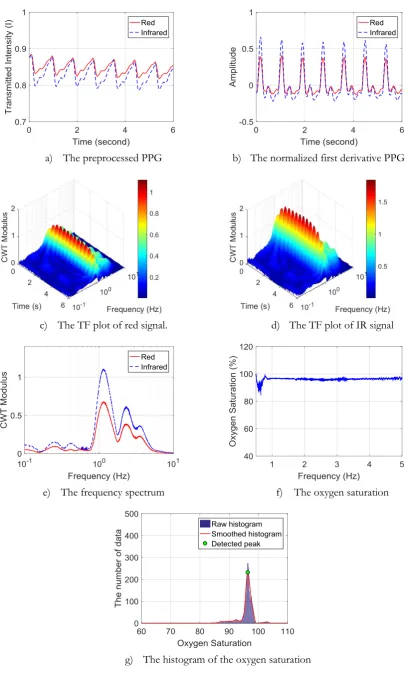
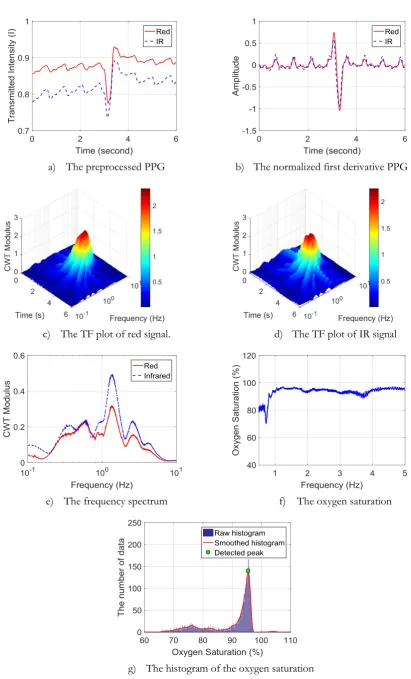
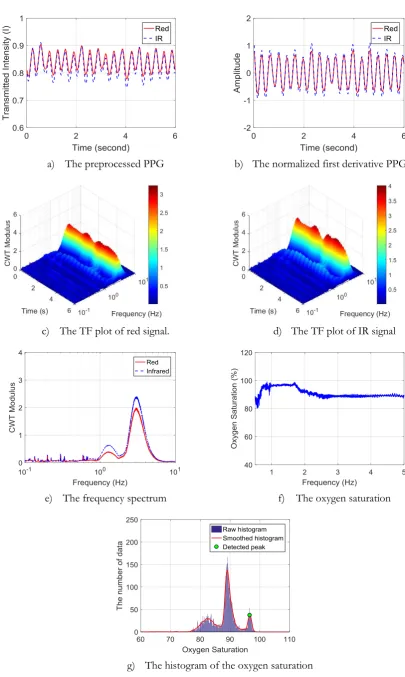
Figure 4 provides an example of applying the proposed processing method to the clean PPG, while Figs. 5 and 6 depict examples of applying the proposed processing method to the motion corrupted PPG, of which the MA was induced by a transient finger bend and the periodic finger bend, respectively. Each figure is composed of 7 subfigures identified as “a” to “g”.
Figure (f) shows the oxygen saturation at each frequency. When there is no MA, the oxygen saturation at each frequency is quite consistent as shown in Fig. 4(f). Because of the effects of the MA, the oxygen saturation at some frequencies deviates in the lower direction, as shown in Fig. 5(f) and 6(f). The histogram of the oxygen saturation data is shown in Fig. (g). When there is no MA, all saturation data correspond to the ratio 𝑟𝑎 and represents the %𝑆𝑝𝑂2, as shown in Fig. 4(g). The MA causes changes in the distribution of the saturation data. The saturation data corresponding to the ratio 𝑟𝑣 are distributed separately from those corresponding to the ratio 𝑟𝑎. However, the %𝑆𝑝𝑂2 corresponding to the ratio 𝑟𝑎 can still be identified, as shown in Figs. 5(g) and 6(g).
The examples of results of using the CPO and the proposed method to process the clean PPG , and the PPG corrupted with the transient and periodic MA, are shown in Figure 7, 8, and 9, respectively. The result obtained from the left index finger was considered as reference, and it was compared to that from the right index finger.
Figure 7 reveals that, when there was no MA, the %𝑆𝑝𝑂2 obtained from both methods and positions was quite similar. For the CPO, the slopes of linear regression lines, which relate to the ratio 𝑟𝑎 and the
%𝑆𝑝𝑂2, are quite coincident, as shown in Fig. 7(a). The ratio 𝑟𝑎 measured from the left and right index finger are 0.6116 and 0.6188, corresponding to the %𝑆𝑝𝑂2 at 96.9% and 96.5%, respectively. For the proposed method, the peaks of histograms that indicate the %𝑆𝑝𝑂2 are almost overlap. As shown in Fig. 7(b), the %𝑆𝑝𝑂2 measured from the left and right index finger are 96.6% and 96.4%, respectively.
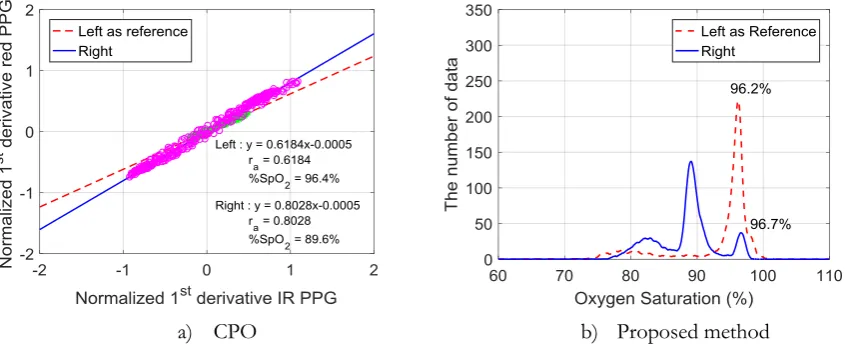
Figure 8 and 9 show that the CPO is sensitive to the MA, but the proposed method has resistance to the MA. The CPO tends to provide the false desaturation, when the MA is present. The slope of the linear regression line tends to be increased, when the detected PPGs were corrupted with the transient or periodic MA. Because of the MA, the %𝑆𝑝𝑂2 measured from the right index finger was, therefore, lower than that from the left index finger as shown in Fig. 8(a) and 9(a). The proposed method has more resistant to the transient and periodic MA than the CPO. As shown in Fig. 8(b) and 9(b), although the MA makes changes in the distribution of the saturation data in the histogram, the %𝑆𝑝𝑂2 can still be specified by a peak of the highest level of oxygen saturation.
Figure 10 depicts the results of the %𝑆𝑝𝑂2 measurements at channels 1 and 2. Figure 10(a) shows the
normalized first derivative red and IR PPGs detected from the left index finger at channel 1 without the MA. Figure 10(b) is the normalized first derivative red and IR PPG detected from the right index finger at channel 2 with the MA induced by the periodic finger bend. Figures 10(c) and 10(d) show the %𝑆𝑝𝑂2 obtained from the proposed method and the CPO at channels 1 and 2, respectively. Figure 10(c) reveals that when there is no MA, the proposed processing method can provide the %𝑆𝑝𝑂2 similar to the CPO. As shown in Fig. 10
(d), the CPO provides a false desaturation when the red and IR PPGs are contaminated with the MA, while the %𝑆𝑝𝑂2 obtained from the proposed method remains consistent. These results reveal that the proposed method is more resistant to the MA than the CPO.
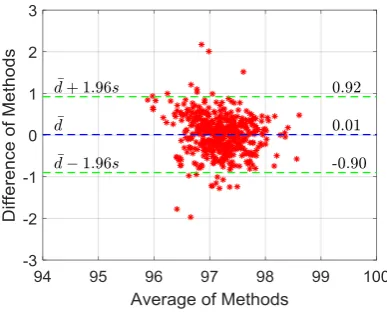
Figure 11 is the Bland
–
Altman plot comparing the %𝑆𝑝𝑂2 obtained from the proposed processing method at channel 2 versus that from the CPO measured at channel 1 when there is no MA. There were 500 samples (𝑛) of analyzed data. The bias is 0.01, and the LOA is in the range of -0.90 to 0.92. It can be interpreted that the proposed method can provide the %𝑆𝑝𝑂2 similar to the CPO when there is no MA. On the other hand, the %𝑆𝑝𝑂2 obtained from the proposed method can be used interchangeably with that fromthe CPO when there is no MA, and the %𝑆𝑝𝑂2 measured from the right index finger represents the arterial
oxygen saturation similar to the %𝑆𝑝𝑂2 measured from the left index finger.
Tables 1 and 2 show the results of the Bland
–
Altman analysis comparing the %𝑆𝑝𝑂2 obtained from thea) The preprocessed PPG b) The normalized first derivative PPG
c) The TF plot of red signal. d) The TF plot of IR signal
e) The frequency spectrum f) The oxygen saturation
g) The histogram of the oxygen saturation
[image:10.595.88.498.78.756.2]a) The preprocessed PPG b) The normalized first derivative PPG
c) The TF plot of red signal. d) The TF plot of IR signal
e) The frequency spectrum f) The oxygen saturation
g) The histogram of the oxygen saturation
[image:11.595.85.497.69.749.2]a) The preprocessed PPG b) The normalized first derivative PPG
c) The TF plot of red signal. d) The TF plot of IR signal
e) The frequency spectrum f) The oxygen saturation
g) The histogram of the oxygen saturation
[image:12.595.86.492.72.750.2]a) CPO b) Proposed method Fig. 7. Examples of results of using the CPO and the proposed method to process the clean PPG.
a) CPO b) Proposed method
Fig. 8. Examples of results of using the CPO and the proposed method to process the PPG corrupted with the transient MA.
a) CPO b) Proposed method
[image:13.595.83.506.308.478.2] [image:13.595.83.506.528.700.2]a) The normalize first derivative red and IR PPG measured from left index finger at channel 1
b) The normalize first derivative red and IR PPG measured from right index finger at channel 2
c) The %𝑆𝑝𝑂2 measured from left index
finger at channel 1. d) The
%𝑆𝑝𝑂2 measured from right index finger at channel 2.
Fig. 10. Example of the %𝑆𝑝𝑂2 measurement obtained from two different positions and two methods simultaneously
[image:14.595.83.509.89.468.2] [image:14.595.196.390.536.692.2]Table 1. The Bland
–
Altman analysis plot showing the comparison between the %𝑆𝑝𝑂2 obtained from the CPO and the proposed method at channel 2 versus that from the CPO at channel 1 during transient finger bend (𝑛 = 110).Ch 2 : CPO vs Ch 1 : CPO
Ch 2 : Proposed Method vs
Ch 1 : CPO
Bias (𝑑̅) -8.02 -1.01
Precision (𝑠) 3.09 1.20
+ LOA (𝑑̅ + 1.96𝑠) -1.97 1.34
- LOA (𝑑̅ − 1.96𝑠) -14.07 -3.37
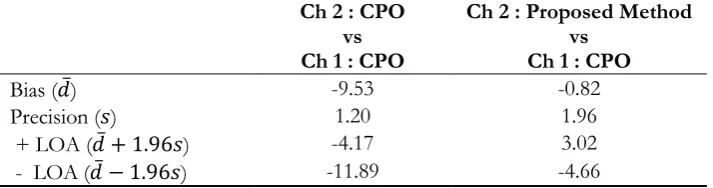
Table 2. The Bland
–
Altman analysis between the %𝑆𝑝𝑂2 obtained from the CPO and the proposed method at channel 2 versus that from the CPO measured at channel 1 during periodic finger bend (𝑛 = 110).Ch 2 : CPO vs Ch 1 : CPO
Ch 2 : Proposed Method vs
Ch 1 : CPO
Bias (𝑑̅) -9.53 -0.82
Precision (𝑠) 1.20 1.96
+ LOA (𝑑̅ + 1.96𝑠) -4.17 3.02
- LOA (𝑑̅ − 1.96𝑠) -11.89 -4.66
4.
Conclusions
In this paper, we proposed a motion resistant pulse oximetry processing based on time-frequency analysis. It was suggested that the SG filter be used in the preprocessing stage, because it can simultaneously provide both the smoothed PPG and its derivative, which are required for normalization. The normalization with the derivative method was recommended because of its simplicity in computation. However, it provided the normalized first derivative PPG indicating the arterial blood flow rather than the normalized PPG indicating the arterial blood volume. The CWT together with the median calculation was proposed for finding the frequency spectrum of the normalized first derivative red and IR PPG, instead of using the FFT. Using this method, the spectral resolution of the frequency spectrum can be arbitrarily increased, leading to an increase in the number of data points to be plotted on the histogram. Experimental results showed that the proposed processing method was more resistant to the MA than the CPO. The increased spectral resolution helped reveal the correct %𝑆𝑝𝑂2 more clearly, and made the estimation of the %𝑆𝑝𝑂2 more accurate, especially when there was a MA. As many signal processing techniques have been proposed to eliminate the MA, the pulse oximetry processing would be more powerful if those techniques are combined with the method proposed in this study.
References
[1] T. Aoyagi, “Pulse oximetry: its invention, theory, and future,” Journal of Anesthesia, vol. 17, no. 4, pp. 259-266, 2003.
[2] J. W. Severinghaus, “Takuo Aoyagi: discovery of pulse oximetry,” Anesth Analg, vol. 105, no. 6 Suppl, pp. S1-4, Dec. 2007.
[3] J. Allen, “Photoplethysmography and its application in clinical physiological measurement,” Physiol Meas, vol. 28, no. 3, pp. R1-39, Mar. 2007.
[4] W. Tin and M. Lal, “Principles of pulse oximetry and its clinical application in neonatal medicine,” Semin
Fetal Neonatal Med, vol. 20, no. 3, pp. 192-7, Jun. 2015.
[5] S. DeMeulenaere, “Pulse oximetry: Uses and limitations,” The Journal for Nurse Practitioners, vol. 3, no. 5, pp. 312-317, 2007.
[image:15.595.120.478.132.226.2] [image:15.595.121.478.280.374.2][7] K. A. Reddy, B. George, and V. J. Kumar, “Use of fourier series analysis for motion artifact reduction and data compression of photoplethysmographic signals,” IEEE Transactions on Instrumentation and
Measurement, vol. 58, no. 5, pp. 1706-1711, 2009.
[8] H. H. Asada, J. Hong-Hui, and P. Gibbs, “Active noise cancellation using MEMS accelerometers for motion-tolerant wearable bio-sensors,” in The 26th Annual International Conference of the IEEE Engineering
in Medicine and Biology Society, 2004, vol. 1, pp. 2157-2160.
[9] P. Gibbs and H. H. Asada, “Reducing motion artifact in wearable bio-sensors using MEMS accelerometers for active noise cancellation,” in Proceedings of the 2005, American Control Conference, 2005, vol. 3, pp. 1581-1586.
[10] L. B. Wood and H. H. Asada, “Noise cancellation model validation for reduced motion artifact wearable PPG sensors using MEMS accelerometers,” in 2006 International Conference of the IEEE Engineering in
Medicine and Biology Society, 2006, pp. 3525-3528.
[11] M. R. Ram, K. V. Madhav, E. H. Krishna, N. R. Komalla, and K. A. Reddy, “A novel approach for motion artifact reduction in PPG signals based on AS-LMS adaptive filter,” IEEE Transactions on
Instrumentation and Measurement, vol. 61, no. 5, pp. 1445-1457, 2012.
[12] F. Peng, Z. Zhang, X. Gou, H. Liu, and W. Wang, “Motion artifact removal from photoplethysmographic signals by combining temporally constrained independent component analysis and adaptive filter,” Biomed Eng Online, vol. 13, p. 50, Apr. 24, 2014.
[13] B. S. Kim and S. K. Yoo, “Motion artifact reduction in photoplethysmography using independent component analysis,” IEEE Transactions on Biomedical Engineering, vol. 53, no. 3, pp. 566-568, 2006. [14] R. Krishnan, B. Natarajan, and S. Warren, “Two-stage approach for detection and reduction of motion
artifacts in photoplethysmographic data,” IEEE Transactions on Biomedical Engineering, vol. 57, no. 8, pp. 1867-1876, 2010.
[15] M. R. Ram, K. V. Madhav, E. H. Krishna, N. R. Komalla, K. Sivani, and K. A. Reddy, “ICA-based improved DTCWT technique for MA reduction in PPG signals with restored respiratory information,”
IEEE Transactions on Instrumentation and Measurement, vol. 62, no. 10, pp. 2639-2651, 2013.
[16] C. M. Lee and Y. T. Zhang, “Reduction of motion artifacts from photoplethysmographic recordings using a wavelet denoising approach,” in IEEE EMBS Asian-Pacific Conference on Biomedical Engineering, 2003, pp. 194-195.
[17] J. M. Goldman, M. T. Petterson, R. J. Kopotic, and S. J. Barker, “Masimo signal extraction pulse oximetry,” Journal of Clinical Monitoring and Computing, vol. 16, no. 7, pp. 475-483, 2000.
[18] K. D. Mohamed, K.-A. Esmaiel, M. E. Ibrahim, J. M. Rex, M. W. Walter, and A. S. Robert, Signal
Processing Apparatus. United States, 2009.
[19] P. Addison, J. Walker, and R. Guido, “Time-frequency analysis of biosignals,” IEEE Eng Med Biol Mag, vol. 28, no. 5, pp. 14-29, Sep.-Oct. 2009.
[20] P. S. Addison and J. N. Watson, “Oxygen saturation determined using a novel wavelet ratio surface,”
Med Eng Phys, vol. 27, no. 3, pp. 245-8, Apr. 2005.
[21] R. W. Schafer, “What is a Savitzky-Golay filter?,” IEEE Signal Processing Magazine, vol. 28, no. 4, pp. 111-117, 2011.
[22] S. Palreddy, “Signal processing algorithms,” in Design of Pulse Oximeter, J. G. Webster, Ed. Institute of Physics Publishing, 1997.
[23] J. M. Bland and D. G. Altman, “Statistical methods for assessing agreement between two methods of clinical measurement,” Lancet, vol. 1, no. 8476, pp. 307-10, Feb. 8, 1986.