1 1
Body shape-shifting during growth permits tests that distinguish between
2competing geometric theories of metabolic scaling
34
5
Andrew G. Hirst
a,b, Douglas S. Glazier
c, David Atkinson
d,*6
a School of Biological and Chemical Sciences, Queen Mary University of London, E1 4NS,
7
UK. 8
b Centre for Ocean Life, National Institute for Aquatic Resources, Technical University of
9
Denmark, Kavalergården 6, 2920 Charlottenlund, Denmark. 10
c Department of Biology, Juniata College, Huntingdon, PA 16652, USA.
11
d Institute of Integrative Biology, University of Liverpool, Biosciences Building, Crown
12
Street, Liverpool, L69 7ZB, UK 13
*Corresponding author: davida@liverpool.ac.uk (telephone +44 (0)151 7954527)
14
15
Keywords: Energetics, geometry, body size, respiration 16
Runing title: Shape-shifting and metabolic scaling 17
Article type: Letter 18
Number of words in Abstract: 150 19
Number of words in main text body: 4068 20
Number of Figures: 5 21
Number of Tables: 0 22
Number of references: 40 23
24
Author Contributions
25
AGH, DA and DSG designed and performed the work, analysed the data, and wrote the 26
paper. 27
2 29
Abstract
30
Metabolism fuels all of life’s activities, from biochemical reactions to ecological interactions. 31
According to two intensely-debated theories, body size affects metabolism via geometrical 32
influences on the transport of resources and wastes. However, these theories differ crucially 33
in whether the size-dependence of metabolism is derived from material transport across 34
external surfaces, or through internal resource transport networks. We show that when body 35
shape changes during growth, these models make opposing predictions. These models are 36
tested using pelagic invertebrates, because these animals exhibit highly variable intraspecific 37
scaling relationships for metabolic rate and body shape. Metabolic scaling slopes of diverse 38
integument-breathing species were significantly positively correlated with degree of body 39
flattening or elongation during ontogeny, as expected from surface-area theory, but 40
contradicting the negative correlations predicted by resource-transport-network models. This 41
finding explains strong deviations from predictions of widely-adopted theory, and underpins 42
a new explanation for mass-invariant metabolic-scaling during ontogeny in animals and 43
plants. 44
3
Introduction
46
The speed of metabolism, or the rate at which organisms transform resources into 47
biological work and structures, has profound physiological, ecological and evolutionary 48
implications (Brown et al., 2004; Kooijman, 2010; Sibly et al.,2012). In aerobic organisms, 49
this process can be estimated by aerobic respiration (R), which is typically related to body 50
mass (M) using a power function, R = aMb. Debates that started over 75 years ago about how 51
to predict the value of the respiration scaling exponent b (henceforth bR) (Brody, 1945; 52
Kleiber, 1961; Brown et al., 2004; Makarieva et al., 2008), have recently become very 53
intense, as contrasting theories compete to explain variation in rates of metabolism of 54
different-sized organisms (West et al., 1999; Kozlowski et al.,2003; Banavar et al., 2010; 55
Dodds, 2010; Glazier, 2010; Kooijman, 2010; Price et al., 2012). 56
Two groups of theories that predict metabolic rates based on geometrical relationships 57
between body mass and resource supply (or waste removal) have become prominent. These 58
theories differ crucially in whether metabolic scaling is assumed to be more strongly 59
influenced by transport of materials through external exchange surfaces such as those of skin, 60
lungs and gills (“Surface Area” or SA theory) (Rubner, 1883; Kooijman, 2010; Okie, 2013), 61
or by physical and geometrical properties of internal networks for transport of materials, 62
including animal and plant vascular systems (“Resource Transport Network” or RTN theory) 63
(West et al., 1999; Savage et al., 2008; Banavar et al., 2010). A major empirical challenge 64
has been to distinguish between the very similar metabolic (respiration) scaling exponents 65
predicted by various SA and RTN models (Kearney & White, 2012). SA theory, which 66
invokes Rubner’s (1883) surface law applied to surfaces that exchange energy or materials, 67
predicts that when size increase involves no change in body shape, surface area will decline 68
relative to volume or mass. Thus, the simplest SA theory, which assumes that respiration rate 69
4
its relative shape), predicts that bR = ⅔. Alternatively, models based on the geometry of 71
resource-transport networks predict a slightly higher bR value of ¾ (West et al., 1999; 72
Banavar et al., 2010), though this value may vary depending on network properties (Price et
73
al., 2007; Savage et al., 2008; Banavar et al., 2010; Dodds, 2010; Price et al., 2012). A 74
second outstanding challenge has been for these general theories to account for substantial 75
and systematic deviations from these predictions, as occurs during the ontogeny of diverse 76
animals and plants, including cases where bR-values are near, and sometimes greater than 1 77
(Glazier, 2005, 2006). 78
Here, we overcome both of these challenges by performing a test that clearly 79
distinguishes between predictions of SA- and RTN-models. Our test is powerful because it 80
exploits the greater divergence in the predictions of these models when growth is associated 81
with large body-shape changes (see also Kearney and White, 2012), and it uses the most 82
comprehensive set of intraspecific measurements of pelagic invertebrate body-shape change 83
and metabolic scaling collected to date. Pelagic animals are ideal for this test, because they 84
are physiologically and taxonomically diverse (occuring in many different phyla), they 85
change shape markedly during ontogeny (Hirst, 2012), show varied intraspecific metabolic 86
scaling exponents (Glazier, 2005, 2006), and commonly exchange oxygen and wastes across 87
large portions of their body surface throughout much or all of their ontogeny (Graham, 1988; 88
Pirow et al., 1999), even in relatively large active species such as cephalopods (Seibel, 2007). 89
90
Methods
91
Euclidean Surface Area Predicitions
92
In order to overcome the challenge posed by the paucity of data on invertebrate body-93
surface area, and the area of uptake surfaces during ontogeny, we developed a model that 94
5
exponent bL, extending previous predictions (Okie, 2013) (Supplementary Information 1). We 96
next apply this Euclidean geometric model to the abundant literature data on body mass-97
length scaling exponents, bL. These bL values for ontogenetic growth are least-squares 98
regression (LSR) slopes of log body mass against log body length, measured along the long 99
body axis, or as the diameter of oblate medusal forms, which all grow primarily by radial 100
increase rather than bell-height increase (Hirst, 2012). Given a lack of strong systematic 101
variation in mass-density during ontogeny, relative to size increase (see Supplementary
102
Information), we make the reasonable approximation that mass (M) Volume (V) during 103
ontogeny. Thus, when body shape remains unchanged during growth (i.e. growth is 104
isomorphic), M VL3, and therefore bL = 3 (Fig. 1A). In this case, smooth or Euclidean 105
surface area (A) is proportional to M 2/3, as predicted from Rubner’s (1883) surface law, and 106
therefore bA = ⅔ (Fig. 1B). To identify limits to Euclidean shape-shifting, consider an 107
extreme case of when a body, including its appendages, elongates from an initially miniscule 108
size solely along the longest body axis: here at the limit, ML1, hence bL = 1 (Fig. 1A). 109
Moreover, it is evident that such pure elongation produces A L1, hence bA = 1 (Fig. 1B). 110
Another extreme shape shift results when growth, again from an initially miniscule size, 111
occurs in equal proportion, but only in the two longest dimensions (shape flattening); here at 112
the limit, ML2, hence bL = 2 and again bA = 1 (Fig. 1). Thus, both elongation and shape-113
flattening during growth reduce bL below 3, and increase bA from 2/3 to 1 (Fig. 1). By 114
contrast, when body shape becomes more squat (thicker), caused by proportionately less 115
growth along the long axis than along the shorter axes (described mathematically in 116
Supplementary Information 1 Predicting bA from bL using Euclidean geometry), bL > 3, with 117
possible bA values somewhat above or below 2/3, depending on the exact nature of the shape 118
change(Fig. 1). The contribution of body thickening to Euclidean surface area when size 119
increase is dominated by growth in one or both of the longest axes is also discussed in 120
6
scaling accounts for different degrees of growth in different dimensions, it can be applied to 122
any Euclidean body shape and shape change, and it can be compared with actual, rarely 123
measured, surface area changes as well. However, unique values of bA usually cannot be 124
predicted from bL. To solve this problem, we used dimensional analysis to define the limits of 125
the surface-area scaling exponents bA that correspond to body mass-length exponents bL over 126
a biologically realistic range of shape changes (Supplementary Information 1); these 127
boundaries are shown in Fig. 2. 128
129
Resource Transport Network Predictions
130
The model of West et al. (1999) predicts that when growth increases proportionately 131
in three dimensions (isomorphic), bR = 3/4, whereas when growth involves proportionate 132
increases in only two dimensions, bR = 2/3, and for growth in only one dimension, bR = ½. 133
Another related RTN model, the “radial explosion network” model of Banavar et al. (2010) 134
was also extended to consider how body-shape change (estimated as bL) would alter the 135
predicted scaling of metabolic rate (bR). Based on different assumptions, this model predicts 136
either the same values as the model of West et al. (1999) or somewhat smaller bR values for 137
2D and 1D growth (bR = 5/8 and 1/4, respectively: see Supplementary Information 2). Price et
138
al. (2007) also claimed that the predictions of the model of West et al. (1999) should be 139
modified for relatively small organisms, predicting that bR should = 1, 0.86 and 0.60 for 3D, 140
2D and 1D growth, respectively. These predictions were not explicitly considered here 141
because (1) Price et al. (2007) did not specify precisely what should be considered a small 142
versus large organism, and (2) our analyses show that bR is positively correlated with body 143
mass, the opposite of that predicted by the model of Price et al. (2007) (see Supplementary
144
Information 3.5). In the case of all these RTN models, there is a decline in predicted 145
metabolic scaling exponent as shapes increasingly flatten or elongate. In summary, all current 146
7
metabolic mass-scaling exponent bR, whereas SA theory predicts the opposite – that such 148
shape-shifting will increase bR. 149
150
Empirical Data (bR and bL) 151
We obtained bR values by searching the literature for least-squares regressions of log10
152
respiration rate versus log10 body mass during ontogeny of pelagic marine and freshwater
153
invertebrates at controlled constant temperatures. Routine metabolic scaling datasets were 154
screened to remove less reliable regressions having correlation coefficients (r) below 0.8. 155
Additional screening that excluded regressions with body-size ranges less than an order of 156
magnitude did not materially alter our findings (Supplementary Information 3). We also 157
discounted mass-type as driving the observed relationship between bL and bR (Supplementary
158
Information 3). 159
To characterize ontogenetic shape change in a single statistic, we used mass-length 160
exponents (bL), adding to the bL dataset of Hirst (2012) and following his methodology for 161
screening by correlation coefficients. The higher than predicted bR values were not due to 162
choice of regression model, as Reduced Major Axis regressions would increase these values 163
further (Supplementary Information 3). To avoid systematic over-representation of commonly 164
measured species, species means for bR and bL were derived, and these used to calculate 165
means for taxonomic groups listed in Table S2. Our Euclidean surface-area model (Fig. 2 and 166
Supplementary Information 1) and the radial explosion network model (Fig. 3 and 167
Supplementary Information 2) both predict linear relations between bR and 1/bL, so we 168
performed all regressions using 1/bL. As errors are expected to be of similar magnitude for 169
both metabolic and shape changes, and because the evolution of each depends on the other, 170
the scaling exponent bR was related to 1/bL using Reduced Major Axis regression (Figs. 3 and 171
5). We searched the literature for direct measurements of surface area-mass scaling exponents 172
8
smooth surface. Appropriate data for bL and measured bA values were available for just three 174
aquatic species, the euphausiid Thysanoessa raschii (Harding, 1977), the amphipod 175
Gammarus zadacchi (Wang & Zauke, 2002), and the scyphomedusan Aurelia aurita
176
(Deighton, 2013). The surface area of G. zadacchi was estimated indirectly by an acid-base 177
titration method (Wang & Zauke, 2002), and was considered to equal both internal and 178
external surfaces permeable to ions (and thus may include cell membrane surfaces). All these 179
values are presented in Fig. 4, showing how in each case the Euclidean prediction of surface 180
scaling is lower than that achieved, hence suggesting an increase in the fractal dimension of 181
the surface during ontogeny (including the addition of limbs and surface convolutions). 182
183
Results
184
To illustrate the contrasting predictions between the SA- and RTN-models, consider the 185
extremes of shape flattening and pure elongation during growth compared with no shape 186
change (isomorphy). Values of bL are 3 for isomorphic growth, and approach 2 for shape 187
flattening, and 1 for pure elongation (Fig. 1A). For the latter two extremes, AM1(i.e. bA = 188
1), hence a match between surface area and metabolic scaling would predict bA = bR = 1 189
(Figs. 1B and 2). In stark contrast, existing resource-transport network models predict the 190
opposite effect of shape change on bR: for equal proportional length increases in just two 191
dimensions, bR is reduced to either ⅔ (West et al., 1999) or even ⅝ using a more recent 192
model(Supplementary Information 2); and for pure elongation bR is reduced further to ½ 193
(West et al., 1999), or to ¼ (Supplementary Information 2). 194
To make full use of the bR values from 237 regressions for 89 pelagic invertebrate 195
species, and the bL values from 580 regressions for 259 species, we first show, among 12 196
taxonomic groups that have distinct body forms and characteristic mass-length (Hirst, 2012) 197
and respiration-mass scaling (Glazier, 2005)(Fig. S2), that taxon-mean bR is positively 198
9
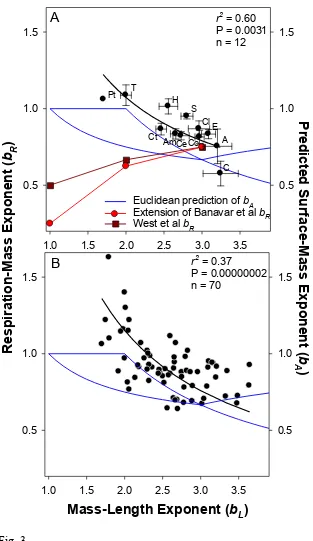
similar regression obtained across 70 species-specific values (r2 = 0.37; p = 0.00000002; Fig. 200
3B). 201
Intriguingly, the predicted surface-area scaling exponents (bA) derived from bL values 202
(between the upper and lower blue lines in Fig. 3A) are below the observed mean bR values. 203
A resolution of this discrepancy is suggested by examining rare measurements of surface 204
areas throughout the ontogeny of two crustaceans and a scyphomedusan, which included 205
surface convolutions from gill development, additional appendages and other surface “frills” 206
(hence fractal dimension) (Okie, 2013). These actual measurements showed steeper scaling 207
with body mass than did Euclidean estimates (Fig. 4), thereby supporting the argument that 208
fractal dimension of the uptake surface scales positively with mass. Notably, chaetognaths 209
with simple, smooth body surfaces throughout ontogeny have the lowest bR values, closest to 210
predicted bA values (Fig 3A). Our findings therefore show that shape-shifting during 211
ontogenetic growth among phylogenetically and morphologically diverse pelagic 212
invertebrates accounts for substantial deviation from ¾- or ⅔-power scaling (Glazier, 2005, 213
2006) in the direction predicted by theories based on surface-area influences (blue lines in 214
Fig. 3A), but in the opposite direction predicted by existing RTN models (red lines in Fig. 215
3A). To distinguish clearly between opposing predictions of these SA and RTN models, we 216
next focus on the range of body-shape changes over which their predictions are in opposite 217
directions. This range encompasses the majority of species, whose shape change is 218
characterized by bL ≤ 3. 219
Further support for the role of a permeable surface area in explaining metabolic scaling 220
comes from a comparison of taxa with and without an impervious external surface covering. 221
The strength of the relation between metabolic scaling and mass-length change differed 222
among five phyla (ANCOVA; 1/bL: F1,45 = 18.54, p < 0.0005; Phylum: F4,45 = 3.53, p =
223
0.014; 1/bL x Phylum: F4,45 = 3.9, p = 0.008; r2 = 0.62), with chordates showing greater
224
10
permeable general body surface later in ontogeny or in larger species (Lockwood, 1967), 226
coupled with increased reliance on localised respiratory organs (e.g. gills) may explain why 227
their metabolic scaling shows little sensitivity to body-surface area (Fig. 5). 228
Values of bR also tend to be higher in gelatinous than in non-gelatinous taxa, but a 229
General Linear Model analysis of species for which bL ≤ 3 showed a stronger effect of 1/bL
230
than of gelatinous categorization (G: gelatinous and semi-gelatinous vs non-gelatinous 231
(Larson, 1986) (1/bL: F1,51 = 7.32, p =0.009; G: F1, 51 = 2.46, p < 0.097; see also
232
Supplementary Information 3.4 Effects of body composition). Overall, therefore, the negative 233
relationship between bR and bL paralleled the predicted effect of the scaling of permeable 234
surface area (Figures. 3A, 5). 235
236
Discussion
237
The observed increase in bR with increased shape-shifting, as represented by a 238
reduction in the mass-body length scaling exponent, bL, was consistent not just with our SA-239
model, but also with the more detailed dynamic energy budget (DEB) theory of Kooijman 240
(1986, 2010; Maino et al., 2014). In DEB theory, maintenance metabolism is proportional to 241
structural volume (which is the overall volume minus volume of non-metabolizing 242
“reserve”), and total metabolic rate combines maintenance cost of this structure and, the 243
overhead costs of growth (and assimilation), and potentially also surface-area related costs 244
such as osmotic control. Thus, for isomorphic size increase, DEB theory predicts that 245
metabolic rate during ontogeny should scale with mass raised to a power between 2/3 and 1, 246
depending on the relative weighting of different components of metabolism. Without data on 247
these weightings, we were not able to distinguish DEB predictions for isomorphically 248
growing animals from those of current RTN models. However, for the extreme shape changes 249
at the limits of pure elongation and shape-flattening, both our SA-model and DEB theory 250
11
SA is also isometrically related to body mass. Moreover, the findings of two previous studies, 252
which compared the intraspecific size-scaling of metabolic rates of colonial bryozoans of 253
different shapes and growth characteristics (White et al., 2011; Hartikainen et al., 2014), also 254
supported the DEB theory of Kooijman (2010) rather than predictions of the RTN model of 255
West et al. (1999). Therefore, the observed increase in bR with increased shape-shifting 256
towards elongation or shape-flattening is consistent with predictions of SA theory, 257
represented by either the model presented in this paper or DEB theory, but contradicts 258
predictions of current RTN models. 259
However, delivery of resources and wastes between the external environment and 260
mitochondria throughout the body depend on both the area of exchange surfaces and the 261
design of the transport network within the organism, and both would be expected to be 262
consistent with metabolic scaling relationships with body size. If they were not, a mismatch 263
would arise in material and energy exchange with the environment, especially for resources 264
such as oxygen that are typically stored in only small amounts in bodies. Falsification of 265
predictions of current RTN models is therefore surprising, particularly so because we 266
deliberately chose to test models that not only represent different network geometries (West 267
et al., 1999; Banavar et al., 2010), but also have few specific details and hence potentially 268
wide applicability. Moreover, their predictions were falsified despite being based on 269
observations of diverse animal taxa, including cephalopods with closed cardiovascular 270
systems, as well as other animals with open or no obvious circulatory systems. We therefore 271
need to consider why current RTN models may not predict changes in metabolic rate during 272
ontogenetic growth of aquatic invertebrates when body shape changes. 273
As resource transport networks must connect to mitochondria distributed throughout 274
the body, RTN models assume that the networks are space-filling. However, we suggest that 275
the geometry of this space-filling may differ fundamentally depending on whether materials 276
are distributed from a central hub (e.g. heart), as assumed in current RTN-models (West et
12
al., 1999; Banavar et al., 2010; Dodds, 2010), or from much of the external surface, which 278
may be a more reasonable assumption for many aquatic invertebrates that respire through 279
their integument and whose shape becomes more elongate or flattened during growth. The 280
functionally important paths within transport networks would therefore be between the 281
external surface and each mitochondrion rather than radiating from a central heart to each 282
mitochondrion. When body shape changes during growth, average path lengths within 283
transport networks that match the distribution of exchange surfaces over the body surface 284
should be expected to respond differently from those in radiating transport networks, thereby 285
producing different size-scaling of both resource transport and metabolic rate. For example, 286
when growth is achieved largely by elongation of body shape, the minimum or mean path 287
lengths from a central heart will scale more closely with body length (l1 in Fig. 2 and S.I.), 288
but when the network is space-filling from the external surface, these path lengths are 289
expected to scale more closely with the length of the shortest, slowest growing axis (l3 in Fig. 290
2 and S.I.). We are currently investigating such modifications to the RTN model of Banavar 291
et al. (2010) to try to reconcile RTN model predictions with metabolic scaling data for shape-292
shifting aquatic invertebrates. Even for some species with closed circulatory systems, such as 293
cephalopods, predictions of current network models based on a single centralised heart may 294
not apply: for example, the squid species in our dataset have several hearts located in 295
different parts of the body (O'Dor & Hoar, 2000). Therefore, our findings suggest the 296
intriguing possibility of a major transition in metabolic scaling in multicellular eukaryotes 297
when respiratory uptake shifts from being widely distributed over the body surface to being 298
more localised in specialised respiratory organs, and that this is also expected to coincide 299
with a shift in the geometry of RTNs. 300
Hitherto underappreciated shape-shifting effects on external surface area also help to 301
resolve a major contradiction between the conventional prediction that mass-specific 302
13
interspecifically, within groups of multicellular eukaryotes (West et al., 1999; Banavar et al., 304
2010; DeLong et al., 2010), and the surprisingly common observation that metabolic rate is 305
directly proportional to body size, or nearly so. Such near-isometric metabolic scaling is 306
observed not only during the ontogeny of pelagic invertebrates (Glazier, 2005; 2006), as 307
studied here, but also in growing pelagic fish larvae, and during the early ontogeny of other 308
animals and plants (Post & Lee, 1996; Glazier, 2005; Mori et al., 2010). Kooijman (2010) has 309
also argued that the external surface area during the early ontogeny of trees is isometrically 310
related to volume (see also Glazier 2010), which under SA theory (including Kooijman’s 311
DEB theory) would predict the near isometric metabolic scaling that is observed (Mori et al., 312
2010). Banavar et al. (2014) link shape change to mass-scaling of metabolic rate as well, but 313
argue that bR = ¾, regardless of whether growth is isomorphic or whether surface area is 314
linearly related to volume (“trees” in their terminology): this clearly contradicts the effects of 315
shape-shifting that we have observed in pelagic invertebrates. However, the model described 316
by Banavar et al. (2014) differs critically from ours and from the data presented in the 317
Supplementary Information 3. Specifically, although we did not detect or assume a systematic 318
change in body composition, hence density, as body mass increases, Banavar et al. (2014) 319
predict that density scales as M1/4 in organisms whose external surface area is linearly related 320
to volume. 321
To understand the role of shape-shifting in generating near-isometric metabolic 322
scaling, we propose that constraints on the scaling of resource encounter, uptake and internal 323
transport should all be considered. Thus the usual diminishing supply and delivery of limiting 324
resources to mitochondria as body size increases (Palzenberger & Pohla, 1992; Banavar et
325
al., 2010) needs to be overcome. Specifically, over ontogeny the encounter, uptake and 326
internal transport of a limiting resource or resources (e.g. energy and/or oxygen) should be 327
directly proportional to body mass. This can happen in integument-breathing pelagic animals 328
14
potential rates of encounter and consumption of food also scale with body mass nearly 330
isometrically (actually with slightly positive allometry) when food is encountered in a 3-331
dimensional (e.g. pelagic) environment (Pawar et al., 2012). Therefore, we propose that near-332
isometric scaling of both oxygen and food uptake permits the evolution of near-isometric 333
scaling of routine metabolism during ontogeny. This situation contrasts with the negatively 334
allometric food uptake (i.e. b < 1) observed when encounters are in two dimensions (e.g., 335
non-pelagic and terrestrial consumption) (Pawar et al., 2012). Near-isometric metabolic 336
scaling in pelagic fish larvae is also associated with steep initial scaling of gill-surface area, 337
which then becomes shallower later in life (Post & Lee, 1996). During early ontogeny, fish 338
and other organisms showing isometric metabolic scaling may also rely heavily on 339
integumentary exchange of respiratory gases, which when coupled with shape change, 340
parental resource supplements, or both, can prevent negatively allometric resource encounters 341
(Brody, 1945; Mori et al., 2010). Our data do not allow us to test interspecific scaling 342
exponents, but future tests at this scale may benefit from attention to SA constraints. 343
Our tests have clearly distinguished between predictions of SA- and existing RTN-344
metabolic scaling models. However, the relative importance of resource supply, waste 345
removal and metabolic demand in driving the slopes of the scaling relationships that we have 346
observed remains an open question. Further research is needed to determine when and 347
whether: (1) surface-area constrained resource supply (or waste removal) primarily limits the 348
level and scaling of metabolism in integument-breathing organisms, (2) natural selection on 349
vital energy-demanding activities (e.g. growth, reproduction and locomotion) related to 350
specific life-styles and environmental challenges is of primary importance, and this has led to 351
adaptive secondary adjustments in body-shape related surface area and associated resource 352
supply to match size-specific metabolic requirements, or (3) the processes of resource supply 353
and use have coevolved in such a tightly symmorphic way that no one process can be 354
15
In any case, our findings not only resolve major empirical contradictions with predictions 356
of general metabolic scaling theory, but also help to explain why near-isometric scaling of 357
routine metabolism occurs in nature. We can also now better understand why isometric 358
metabolic scaling was not completely replaced by negatively allometric scaling when unicells 359
evolved into multicellular organisms (DeLong et al., 2010), but rather persists in many 360
multicellular species during all or parts of their ontogeny. 361
362
References
363
1. Banavar, J.R., Moses, M.E., Brown, J.H., Damuth, J., Rinaldo, A., Sibly, R.M. et al.
364
(2010). A general basis for quarter-power scaling in animals. Proc. Natl. Acad. Sci.
365
USA 107, 15816-15820. 366
367
2. Banavar, J.R., Todd, J., Cooke, T.J., Rinaldo, A., Maritan, A. (2014). Form, function, 368
and evolution of living organisms. Proc. Natl. Acad. Sci. USA 111, 3332-3337. 369
370
3. Brody, S. (1945). Bioenergetics and Growth. Hafner, New York. 371
372
4. Brown, J.H., Gillooly, J.F., Allen, A.P., Savage, V.M. & West, G.B. (2004). Toward a 373
metabolic theory of ecology. Ecology 85, 1771-1789. 374
375
5. Deighton, H.M. (2013). An Examination of the Surface Areas of Two Marine
376
Invertebrates. MS thesis, Queen Mary, University of London. 377
16
6. DeLong, J.P., Okie, J.G., Moses, M.E., Sibly, R.M. & Brown, J.H. (2010). Shifts in 379
metabolic scaling, production, and efficiency across major evolutionary transitions of 380
life. Proc. Natl. Acad. Sci. USA 107, 12941-12945. 381
382
7. Dodds, P.S. (2010). Optimal form of branching supply and collection networks. Phys.
383
Rev. Lett. 104, 048702, doi: 10.1103/PhysRevLett.104.048702. 384
385
8. Glazier, D.S. (2005). Beyond the ‘3/4-power law’: variation in the intra- and 386
interspecific scaling of metabolic rate in animals. Biol. Rev. 80, 611-662. 387
388
9. Glazier, D.S. (2006). The 3/4-power law is not universal: evolution of isometric, 389
ontogenetic metabolic scaling in pelagic animals. BioScience 56, 325-332. 390
391
10.Glazier, D.S. (2010). A unifying explanation for diverse metabolic scaling in animals 392
and plants. Biol. Rev. 85, 111-138. 393
394
11.Graham, J.B. (1988). Ecological and evolutionary aspects of integumentary 395
respiration: body size, diffusion and the Invertebrata. Amer. Zool. 28, 1031-1045. 396
397
12.Harding, G.C.H. (1977). Surface area of the euphausiid Thysanoessa raschii and its 398
relation to body length, weight, and respiration. J. Fish. Res. Board Can. 34, 225-231. 399
17
13.Hartikainen, H., Humphries, S. & Okamura, B. (2014). Form and metabolic scaling in 401
colonial animals. J. Exp. Biol. 217, 779-786. 402
403
14.Hirst, A.G. (2012). Intra-specific scaling of mass to length in pelagic animals: 404
Ontogenetic shape change and its implications. Limnol. Oceanogr. 57, 1579-1590. 405
406
15.Kearney, M.R. & White, C.R. (2012). Testing metabolic theories. Am. Nat. 180, 546-407
565. 408
409
16.Killen, S.S., Atkinson, D. & Glazier, D.S. (2010). The intraspecific scaling of 410
metabolic rate with body mass in fishes depends on lifestyle and temperature. Ecol.
411
Lett. 13, 184-193. 412
413
17.Kleiber, M. (1961). The Fire of Life. Wiley, New York. 414
415
18.Kooijman, S.A.L.M. (1986). Energy budgets can explain body size relations. J. Theor.
416
Biol. 121, 269-282. 417
418
19.Kooijman, S.A.L.M. (2010). Dynamic Energy Budget Theory for Metabolic
419
Organisation. Cambridge University Press, Cambridge. 420
18
20.Kozlowski, J., Konarzewski, M. & Gawelczyk, A.T. (2003). Cell size as a link 422
between DNA and metabolic rate scaling. Proc. Natl. Acad. Sci. USA 100, 14080-423
14085. 424
425
21.Larson, R.J. (1986). Water content, organic content, and carbon and nitrogen 426
composition of medusa from the northeast Pacific. J. Exp. Mar. Biol. Ecol. 99, 107-427
120. 428
429
22.Lockwood, A.P.M. (1967). Aspects of the Physiology of Crustacea. Freeman, San 430
Francisco. 431
432
23.Maino, J.L., Kearney, M.R., Nisbet, R.M. & Kooijman, S.A.L. (2014). Reconciling 433
theories of metabolic scaling. J. Anim. Ecol. 83, 20-29. 434
435
24.Makarieva, A.M., Gorshkov, V.G., Li, B.-L., Chown, S.L., Reich, P.B. & Gavrilov, 436
V.M. (2008). Mean mass-specific metabolic rates are strikingly similar across life’s 437
major domains: Evidence for life’s metabolic optimum. Proc. Natl. Acad. Sci. U.S.A. 438
105, 16994-16999. 439
440
25.Mori, S., Yamaji, K., Ishida, A., Prokushkin, S.G., Masyagina, O.V., Hagihara, A., et
441
al.(2010). Mixed power scaling of whole-plant respiration from seedlings to giant 442
trees. Proc. Natl. Acad. Sci. USA 107, 1447-1551. 443
19
26.O'Dor, R.K. & Hoar, J.A. (2000). Does geometry limit squid growth? ICES J. Mar.
445
Sci. 57, 8-14. 446
447
27.Okie, J.G. (2013). General models for the spectra of surface area scaling strategies of 448
cells and organisms: fractality, geometric dissimilitude, and internalization. Am. Nat.
449
181, 421-439. 450
451
28.Palzenberger, M. & Pohla, H. (1992). Gill surface area of water-breathing freshwater 452
fish. Rev. Fish Biol. Fisheries 2, 187-216. 453
454
29.Pawar, S., Dell, A.I. & Savage, V.M. (2012). Dimensionality of consumer search 455
space drives trophic interaction strengths. Nature 486, 485-489. 456
457
30.Pirow, R., Wollinger, F. & Paul, J. (1999). The sites of respiratory gas exchange in 458
the planktonic crustacean Daphnia magna: an in vivo study employing blood 459
haemoglobin as an internal oxygen probe. J. Exp. Biol. 202, 3089-3988. 460
461
31.Post, J.R. & Lee, J.A. (1996). Metabolic ontogeny of teleost fishes. Can. J. Fish.
462
Aquat. Sci. 53, 910-923. 463
464
32.Price, C.A., Enquist, B.J. & Savage, V.M. (2007). A general model for allometric 465
covariation in botanical form and function. Proc. Natl. Acad. Sci. USA 104, 13204-466
20 468
33.Price, C.A., Weitz, J.S., Savage, V.M., Stegen, J., Clarke, A., Coomes, D.A., et al.
469
(2012). Testing the metabolic theory of ecology. Ecol. Lett. 15, 1465-1474. 470
471
34.Rubner, M. (1883). Über den Einfluss der Körpergrösse auf Stoff- und Kraftwechsel. 472
Zeitschrift für Biologie 19, 535-562. 473
474
35.Savage, V.M., Deeds, E.M. & Fontana, W. (2008). Sizing up allometric scaling 475
theory. PLoS Comput. Biol. 4, e1000171,doi: 10.1371/journal.pcbi. 1000171. 476
477
36.Seibel, B.A. (2007). On the depth and scale of metabolic rate variation: scaling of 478
oxygen consumption rates and enzymatic activity in the Class Cephalopoda 479
(Mollusca). J. Exp. Biol. 210, 1-11. 480
481
37.Sibly, R.M., Brown, J.H. & Kodric-Brown, A. (2012). Metabolic Ecology: A Scaling
482
Approach. Wiley-Blackwell, Chichester. 483
484
38.Wang, X. & Zauke, G.-P. (2002). Relationship between growth parameters of the 485
amphipod Gammarus zaddachi (Sexton 1912) and the permeable body surface area 486
determined by the acid-base titration method. Hydrobiol. 482, 179-189. 487
488
39.West, G.B., Brown, J.H. & Enquist, B.J. (1999). The fourth dimension of life: Fractal 489
21 491
40.White, C.R., Kearney, M.R., Matthews, P.G.D., Kooijman, S.A.L.M. & Marshall, 492
D.J. (2011). A manipulative test of competing theories for metabolic scaling. Am. Nat.
493
178, 746-754. 494
495
Competing financial interests: The authors declare no competing financial interests. 496
497
Acknowledgments
498
We thank Richard Sibly and Andrew Kerkhoff for extending the predictions of the radial 499
explosion network model of Banavar et al. (Supplementary Information 2). We are grateful to 500
Ron O’Dor and many other authors who kindly supplied data, and to Mike Begon, Andrew 501
Cossins, Andrew Kerkhoff and Mike Speed for helpful comments on an earlier draft. The 502
data reported in this paper are all available in Datasets S1 and S2. 503
504
Figure Legends
505
Figure 1 A. Illustration of Euclidean relationships between body length and mass. When 506
organisms grow isomorphically, they retain their original shape throughout ontogeny, and the 507
slope bL = 3. When the organism becomes more squat during ontogeny, bL > 3; and when 508
growth is proportionally greater along the longest axis, or along the two longest axes, bL < 3. 509
The value of bL approaches the limit of 1 when growth is solely by elongation, and 2 when 510
growth occurs solely and in equal proportion in the two longest dimensions. B. Illustration of 511
various Euclidean relationships between body mass and surface area. When growth is 512
isomorphic bA = 2/3; when growth is by pure elongation along the longest axis, or in equal 513
proportion along just the two longest axes, bA approaches the limit 1; when growth makes 514
body shape more squat, bA depends on specific details of shape change (see Supplementary
515
Information 1). 516
Figure 2. Conversions from mass-length exponents (bL) to surface area-mass exponents (bA), 517
predicted using Euclidean geometry (Supplementary Information 1). M denotes mass, V = 518
volume, A = surface area. The boundaries of the predicted bA values (shaded area) are 519
described by the four equations given. The points where these boundaries intersect (from left 520
to right) describe size increases from an infinitely small size by pure elongation of the body 521
along l1, by enlargement in 2 of 3 body dimensions along l1 and l2, and by isomorphic
522
22
a copepod. Because the medusa primarily increases its radius, simple elongation along one 524
axis alone is not illustrated. 525
Figure 3. Respiration-mass scaling exponents (bR) versus mass-length exponents (bL) for 526
pelagic invertebrates. A. taxon-specific means ± SEM (RMA regression described by: bR = 527
1.699(1/bL) + 0.224). Letters denote the taxa: A, appendicularians; Am, amphipods; E, 528
euphausiids; C, chaetognaths; Ce, cephalopods; Cl, cladocerans; Co, copepods; Ct, 529
ctenophores; H, hydrozoans; Pt, pteropods; S, scyphozoans and T, thaliaceans. Predictions of 530
bR resulting from effects of body-shape change on the geometry of resource-transport 531
networks, as specified by two theoretical models (West et al., 1999; Banavar et al., 2010) 532
(and Supplementary Information 2), are shown in red and brown for bL = 3, 2 and 1. B. 533
species-specific means (RMA regression described by: bR = 2.358(1/bL) - 0.027). In both 534
panels, the Euclidean predicted envelope of bA in relation to bL values (on right-hand axis) is 535
shown in blue (see Fig. 2 for details). 536
Figure 4. Euclidean predicted (cross) and also measured bA values (circles) are given for the 537
euphausiid Thysanoessa raschii, amphipod Gammarus zadacchi andscyphomedusan Aurelia
538
aurita, with values for individual species joined by a vertical line (Harding, 1977; Wang & 539
Zauke, 2002; Deighton, 2013). For comparison, the conversions from mass-length exponents 540
(bL) to surface area-mass exponents (bA), predicted using the Euclidean geometric model 541
developed herein is shown in blue. 542
Figure 5. Relationship between mass-scaling exponent for routine metabolic rate during 543
ontogeny (bR) and change in body shape, 1/bL, for individual species of pelagic invertebrates. 544
Data (black symbols) apply to species ranging from those with isomorphic growth (1/bL = 545
0.33) to those whose shape becomes increasingly elongate or flattened. RMA regression line, 546
in black, is drawn through significant trends only (p < 0.05). Blue dashed lines denote the 547
predicted maximum and minimum exponents derived from Euclidean surface area increase 548
(Supplementary Information 1); solid lines denote predictions from network model of West et
549
al. (1999)(brown line) and derived from Banavar et al. (2010) (red line). A. Chordata; B. 550
Mollusca, C. Cnidaria, D. Ctenophora; E. Arthropoda. The observed positive trends are 551
opposite to those predicted by resource transport network theories. The lack of relationship 552
among species of Arthropoda may be related to the development of a relatively impermeable 553
cuticle and localised respiratory organs. 554
23 556
557
558
559
[image:23.595.63.541.68.376.2]560
Fig. 1 561
24 563
564
565
566
[image:24.595.65.580.72.487.2]25
Mass-Length Exponent (
b
L)
1.0 1.5 2.0 2.5 3.0 3.5
Respir
at
ion-Mass Expone
nt
(
b
R
)
0.5 1.0 1.5
0.5 1.0 1.5
E A Ce
C Ct
A
Pt T H S
Co Cl
Am
r2 = 0.30 P = 0.0000006 n = 71
B
1.0 1.5 2.0 2.5 3.0 3.5 0.5
1.0 1.5
0.5 1.0 1.5
B
Extension of Banavar et al bR
bBL 3 2 1 bMR 0.75 0.625 0.25
Euclidean prediction of bA
Pr
edict
ed Sur
face
-Mass Expone
nt
(
b
A
)
West et al bR
r2 = 0.37
P = 0.00000002 n = 70
r2 = 0.60 P = 0.0031 n = 12
[image:25.595.74.387.82.623.2]568
26
1.0 1.5 2.0 2.5 3.0 3.5 0.5
1.0 1.5
S
urfa
ce-Ma
ss E
xpo
ne
nt (
b
A)
Mass-Length Exponent (
b
L)
Predicted and measured bA
570 571
572
[image:26.595.89.348.80.346.2]573
Fig. 4 574
27
0.50 0.75 1.00 1.25 1.50
0.50 0.75 1.00 1.25 1.50
0.50 0.75 1.00 1.25 1.50
0.50 0.75 1.00 1.25 1.50
0.35 0.40 0.45 0.50 0.55 0.60
0.50 0.75 1.00 1.25 1.50
A
B
C
D
E
r2 = 0.67
n = 15
r2 = 0.98
n = 5
r2 = 0.23
n = 11
r2 = 0.20
n = 10
r2 = 0.02
n = 14
Degree of shape shifting during ontogeny,1/bL
Re
spi
ra
tion
-Ma
ss
E
xpo
nent (
b R
)
[image:27.595.77.291.83.738.2]576