This is a repository copy of Modelling Urban Bus Service and Passenger Reliability..
White Rose Research Online URL for this paper:
http://eprints.whiterose.ac.uk/3686/
Conference or Workshop Item:
Liu, Ronghui and Sinha, Shalini (2007) Modelling Urban Bus Service and Passenger
Reliability. In: The Third International Symposium on Transportation Network Reliability,
19-20 July 2007, The Hague, Netherlands.
eprints@whiterose.ac.uk https://eprints.whiterose.ac.uk/ Reuse
See Attached
Takedown
If you consider content in White Rose Research Online to be in breach of UK law, please notify us by
Universities of Leeds, Sheffield and York
http://eprints.whiterose.ac.uk/
Institute of Transport Studies
University of Leeds
This is an author produced version of a paper given at the The Third International
Symposium on Transportation Network Reliability. For more information please
visit:
http://www.instr2007.com/
White Rose Repository URL for this paper:
http://eprints.whiterose.ac.uk/3686
Published paper
Ronghui Liu and Shalini Sinha (2007)
Modelling Urban Bus Service and
Passenger Reliability.
The Third International Symposium on Transportation
Network Reliability (INSTR) The Hague, the Netherlands, 19th-20th July 2007.
Modelling Urban Bus Service and Passenger Reliability
Ronghui Liu# and Shalini Sinha*
Institute for Transport Studies, University of Leeds, Leeds LS2 9JT, UK.
Reliability of public transport systems has been considered critically important by public transport users, operators and the government. Lack of reliability in public transport results in uncertainty and delays aggravating anxiety and discomfort for the passengers and increases costs due to lost mileage and lower fleet utilisation for the operators. The government emphasises a reliable bus-service in order to ensure its competitiveness to car use such that
it results in modal shift. Though reliability is of significance to a range of actors such as the bus operators and the passengers, its interpretations vary across different groups. For example, quality of service identified by the demand-oriented indicators, the travellers, is systematically different from what the supply-based quality indicators show. Reliability, as a
measure of quality of service, is related to the operational characteristics of the public transport system. Passenger’s wait time, on the other hand, is much more sensitive to schedule reliability than to service frequency.
This paper investigates some of the measures used to assess reliability of an urban bus network using a dynamic microsimulation model framework. The framework incorporates models of bus operation, passenger arrival and boarding for buses within a network model of
general traffic. It therefore allows explicit modelling of the interactions among cars, buses and passengers and of their effect on bus reliability. The model framework is applied to a case study based on a bus route in the city of York. Empirical analysis of the test route was carried out to understand the background of reliability issues and to establish a sound base scenario of the network. The simulation model is used to help understand the causes and
process of occurrence of unreliability and to study the impacts of possible scenarios such as increased congestion, rise in passenger demand, and reduction in ‘per passenger boarding time’ on the reliability of the test-route. The study measures reliability in terms of travel time, headways and excess passenger wait time, and sheds light on factors affecting them.
The results of the study reveal that excess passenger wait time is strongly correlated with the
variation of headways and an increase in passenger demand intensifies the ‘bunching and spreading out’ of buses. With increasing congestion and passenger demand, reliability is reduced. Reduction in per passenger boarding time proves to be an effective measure in improving reliability.
Beyond these specific case study results, the modelling framework developed may serve as
a useful tool to assess reliability levels for a future year and to evaluate proposed strategies
#
Corresponding author. Tel.: +44 113 343 5338; fax: +44 113 3435334. Email address: trarl@leeds.ac.uk. *
to improve reliability before implementation. Such a modelling framework, if extended to cover larger bus networks can serve as an important decision-making tool in the hands of the government and bus operators for offering more reliable bus services to the public.
Keywords: reliability indicators, public transport reliability, microsimulation
1. INTRODUCTION
Reliability of public transport systems has been considered critically important by most public
transport users because passengers are adversely affected by the consequences associated with unreliability such as additional waiting time, late or early arrival at destinations and missed connections, which increases their anxiety and discomfort (Bates et al., 2001; Reitvield et al., 2001). Reliability has also been identified as important in determining the mode choice (Turnquist and Bowman, 1980). Therefore, it may be stated that unreliability in
public transport drives away existing and prospective passengers.
This rationale of having a reliable bus service in order to ensure its competitiveness to car use such that it results in modal shift, has been emphasised by the UK government. Several local authorities in the UK have introduced a wide range of measures - such as park and ride, bus priorities, better public transport interchanges, improved bus-stops and bus
infrastructures etc – to restrain car demand by building a more reliable public transport system.
For the bus-operating companies, unreliability brings in associated costs due to a loss in mileage and lower fleet utilisation. They also risk losing revenue due to a loss in passenger numbers. Reliability is thus targeted by the operating companies, firstly to improve their
internal efficiency and reduce operating costs, and secondly to benefit from increased patronage due to service improvements.
Thus, the concept of reliability is of significance not only for public transport users, but also for the bus operators and the regulatory bodies such as the local authorities.
However, though several groups of people are interested at improving reliability, the term reliability itself has different interpretations for different groups and indeed various studies
have associated reliability with different aspects of the public transportation systems. While some studies relate reliability to consistency in journey travel times (e.g. Polus, 1978), others associate reliability with adherence to the time-table (e.g. Bates et al., 2001), maintaining headway regularity (Jonas & Furth, 2002), passenger waiting time at stops (Bowman &
both for assessing current reliability levels and for setting (reliability) improvement benchmarks.
This study is aimed to gain a better understanding of these different bus reliability indicators and to identify sources of unreliability and means to improve them. An empirical observation of a key bus route in the City of York was made and data analysed to help understand the causes and extent of unreliability and to identify possible improvement schemes. A
microsimulation model of the case study area was developed and calibrated. The model was then used to study further the dynamics of various factors affecting reliability, the degree of the impacts and to assess reliability in proposed future scenarios. Section 2 of the paper outlines the major factors affecting bus reliability and defines the reliability measures used in this study. Section 3 introduces the test route and reports on our empirical study of the route.
Section 4 describes the development of the microsimulation model of the test route and the scenarios studied, whilst section 5 reports on the model results. Finally conclusions are drawn in section 6.
2. RELIABILITY IN PUBLIC TRANSPORT
2.1 Factors Affecting Reliability
Many factors contribute to bus unreliability: day-to-day and within-day variability in traffic flow and congestion levels cause delays and make prediction of bus journey time uncertain, excess passenger demand causes longer dwell time at bus stops; buses do not always run on schedule, or appear in bunches; operators have insufficient spare capacity to cover for service breakdowns, etc. (Sterman & Schofer, 1976; Abkowitz & Tozzi, 1987).
Generally, the factors affecting bus reliability can be classified into the following groups:
Traffic characteristics, such as traffic composition, day-to-day and within-day variation in travel demand and traffic congestion levels.
Route characteristics, such as the length of the route, number of lanes, location of the bus-stops (on-road and bus-bays), provision of bus lanes (whether in short stretches or all along the route), number of intersections (signalised and priority), priorities at junctions for buses
(sensor/detector system), and street parking. Strathman et al (2001) have found that on-street parking, number of stops on the route, volume of passenger activity, seasonality, time of day, direction of travel, driver behaviour also have an impact on the bus running time and hence reliability.
link travel time variability and the service frequency may cause buses to bunch on a route, thus adversely affecting the service reliability.
Bus operational characteristics: scheduling system, staff shortages, fleet availability, fleet maintenance, ticketing system, and variability in driver behaviour and experience. Guenther and Sinha (1984) have shown that poor maintenance of the fleet and staff shortages result in poor level of service and reliability. Prashker (1978) has also identified mechanical reliability
as one of the three main components of reliability; the other two are parking and travel-time reliability.
2.2 Measures of Reliability
The term reliability can be defined as an attribute of any system that consistently produces same the result (www.dictionary.com). Along similar lines, Polus (1978) defined bus service
reliability as “the ability of the service to provide consistent service over a period of time”. A more comprehensive definition was given by Chapman (1976) covering all aspects of the service as “safety, punctuality, regularity, cleanliness, passenger comfort, documents, security”.
In this paper, three types of bus reliability measures are discussed. These are: travel time
reliability, headway reliability and passenger wait time reliability. The specific definitions of the individual reliability indicators used in this paper are given below. It should be noted that these are not exclusive definitions to the type of reliability measures. For example, the travel time reliability indicator defined in this paper is the mean over standard deviation in journey times of a particular route within a particular time period. In the literature, travel time reliability
has also been defined as the inverse of the standard deviation of journey times (e.g. Polus, 1978; Sterman & Schofer, 1976), the percentage of travel on a bus route that takes no longer than the expected travel time plus an acceptable additional time (Strathman et al, 2001), and the percentage of time that a bus’s journey time is no more than 10% higher than average (Meyer, 2002).
The following definitions and notations are used throughout the paper:
route: is a fixed set of road links and bus stops which are served by a set of bus vehicles (service) according to some schedule which, in this paper, is described by its frequency and the start of the first service
service: the set of bus vehicles which run along the fixed bus route
section: part of a route between two consecutive bus stops
x sample measurements
x
x
µ
mean of the sample {x}i index for a bus route
s index for a bus stop
n index for a bus trip or vehicle
m index for the mth day of observation or mth simulation run
tinm journey time of bus trip n on day (or simulation run) m along route i
hinms headway between bus trip n and n+1 on day m at bus stop s along route i
wims total passenger wait time at stop s for service i on day m
Travel Time Reliability
Travel time reliability discusses the variability in bus journey time for a specific bus routes
within a specific time interval and at a specific level of service or probability that a trip can be completed within a given time. Polus (1978) and Sterman and Schofer (1976) defined the travel time reliability as the inverse of the standard deviation of bus travel times, so to give a high reliability measure when the variability is small.
In this paper, the travel time reliability is defined as the mean over standard deviation of
travel time. The inclusion of the mean in addition to the standard deviation as in Polus (1978) is to allow for comparison of the variations in bus routes or sections of a route that have significantly different mean values. This definition can be written as:
i i
t t i RT
σ
µ
= for ti∈{tinm} (1a)
In this study, reliability of only one route was studied therefore the index i will be dropped hereafter. Sampled through all services along a route for a given time period (i.e. a morning peak period) and over a number of days, this definition represents the within-day journey
time variability of a whole route or sections of a route. In our case study, we sampled all services in a morning peak period and over a number of observed and simulated days. With this definition, a bigger value of RT indicates a better reliability.
Headway Reliability
buses getting full to its capacity and having to bypass subsequent stops due to inadequate capacity.
A number of different reliability measures have been proposed in the literature (e.g.
Chapman, 1976; Turnquist & Browman, 1980; Oort & Nes, 2003; Yin et al., 2003). In this paper, we adopt the definition of Bowman et al. (1991) and define headway reliability as the standard deviation over mean headway:
i i
h h i RH
µ
σ
= for h∈{hinms} (2)
Different to the definition of RT, smaller values of RH indicate better headway reliability.
Passenger Wait Time Reliability
Passengers value the waiting time for urban transit almost twice the in-vehicle time (Oort & Nes, 2003). High waiting times in a public transport network is highly likely to affect the patronage and is therefore an important factor to focus on.
The concept that bus service reliability should be measured from a passenger’s point of view
has been taken on by Transport for London who uses a excess wait time (EWT) measure as a key indicator of reliability for high frequency services (e.g. a service frequency at five or more buses per hour) (TfL, 2006). The EWT assessment includes calculation of the following two elements:
• Average scheduled wait time (SWT) – the time passengers would wait, on average, if the service ran exactly as schedule; and
• Actual wait time (AWT) – the average time that passengers actually waited.
Then EWT is the difference between AWT and SWT and represents the additional waiting time experienced by passengers. For frequent service, SWT can be taken as half of the service frequency and AWT the accumulated passenger wait time at the bus stop. In this
paper, we adopt EWT as the passenger wait time reliability measure and calculate it for each bus route and at each bus stop:
is is
is
is EWT AWT SWT
RW = = − (3)
It is clear that small values of RW indicate better passenger wait time reliability.
3. CASE STUDY: YORK ROUTE 4
First Group Company (FGC). There are three types of services: frequent services which have one bus at least every twelve minutes, standard services having a bus every 15 to 45 minutes, and less frequent services which have one bus per hour or less.
3.1 The Test Route
For an in-depth analysis and evaluation of reliability of bus services in York, it was decided to
take up one service as the test route. The selection of the route was made on three criteria:
• Frequent service having headways of less than 15 minutes: in cases of frequent service, the average wait time is half the headway as passengers arrive randomly at the bus stop.
• Availability of secondary information: FGC collects data on bus arrival times at the bus stops with their TRACKER system - an on-board GPS-based vehicle tracking system.
• Constant Headway Service: this is due to a constraint of the simulation model used in the study which can only model constant headways.
Three routes are covered by the TRACKER system, but only one of them, Route 4 meets the other two criteria and was therefore selected as the test route. The route runs from Acomb Green to the University via the York Railway Station (Fig. 1) and links up residential areas in the west of the city with the railway station and the University. It has a constant frequency of
[image:9.612.98.501.416.565.2]eight minutes during the morning peak period. The entire route from Acomb Green to the University has a scheduled journey time of 41 minutes and 35 bus stops.
Figure 1. The conceptual plan of Route 4 in York. The boxed section is chosen for the detailed study.
An initial survey was conducted on the number of passengers boarding and alighting and journey time between bus-stops along the route. It showed that, for the morning peak period,
Figure 2. Bus-stop locations.
3.2 Data Collection and Analysis
The primary survey of the selected route-section was carried out over three working days, from 21st July (Wednesday) to 23rd July (Friday) 2004 and during the morning peak period from 7:30am to 9:30am. There were 15 services from Eason View to the Railway Station during the peak period (07:30 – 09:30); the first service is scheduled to leave Eason View at 07:35 and the last at 09:27 (at eight minutes interval). The survey was planned such that a representative sample of each of the service could be collected with some overlaps to check
the variation. The data were collected on the number of alighting and boarding passengers, as well as the arrival and departure time of buses at each stop. A total sample of 18 trips was collected in the three days, of which 15 were for each of the peak period services and 3 overlapped to study the variation in the data collected over different days. Secondary information on the service from the TRACKER data was available for only one of the services
during the peak period; the service at departure time 08:23.
Figure 3 shows the observed trajectories along the test route for the sampled services. The scales on the y-axis correspond to the scheduled start time at Eason View and the eight minutes scheduled headway. A scheduled service trajectory (of service 09:27) was also plotted as a comparison. For services to have a regular headway, the trajectories should be
parallel to each other and have the same gradient and a gap of eight minutes throughout.
Two observations can be made from Figure 3. First, the actual arrival times (to Eason View) did not match the scheduled arrival times. Second, the headway of eight minutes was not maintained. Furthermore, it can be deduced that the 08:23 service which had a higher journey time of 17minutes, was delayed at two sections: between Eason View and Thanet
Road and between the Mount and the railway station.
1.Eason View-Lerecroft
2.Eason View-Turnmire
3. Thanet Road
4. Dringhouses 5. Nelson
Lane 6. Pulleyn Drive
7. Mount Vale 8. The Mount
9.Blossom Street 10.Rail Station
Bus lane
A1036, radial road
Residential streets
1.Eason View-Lerecroft
2.Eason View-Turnmire
3. Thanet Road
4. Dringhouses 5. Nelson
Lane 6. Pulleyn Drive
7. Mount Vale 8. The Mount
9.Blossom Street 10.Rail Station
Bus lane
A1036, radial road
Residential streets
1.Eason View-Lerecroft
2.Eason View-Turnmire
3. Thanet Road
4. Dringhouses 5. Nelson
Lane 6. Pulleyn Drive
7. Mount Vale 8. The Mount
9.Blossom Street 10.Rail Station
Bus lane
A1036, radial road
Figure 3: Observed vehicle trajectories along the test route.
Figure 4. Variation of travel time between consecutive bus stops for the 08:23 service. The arrows point to the sections with high run time variability.
Data over seven days was available from the TRACKER system for Route 4. This information was extracted to further analyse the reliability of the route. Figure 4 plots the actual travel time between consecutive stops for the seven services recorded by TRACKER.
O bse rve d tra ve l tim e a lo ng the route fo r Ro ute 4 se rvice s in p e a k pe riod (7:30-9:30a m )
7:35:00 7:43:00 7:51:00 7:59:00 8:07:00 8:15:00 8:23:00 8:31:00 8:39:00 8:47:00 8:55:00 9:03:00 9:11:00 9:19:00 9:27:00 9:35:00 Ea s o n Vi e w ( C h a lo n e r' s ) E a s o n Vi e w ( T ur nm ir e ) T ha n et R o ad D ri n gh ou s e s N el s on L a ne Pu lle y n D ri v e M o unt Val e Th e M o u n t Bl o s s o m S tre e t R a il S ta tio n Bus-stop s T im e (H rs :M in s :S e c
Scheduled Service 9:27
Observed 8:23 service
V A R I A B L E H E A D W A Y S 5 mins 15 mins 12 mins
Travel time variation between consecutive bus-stops
00:00 00:01 00:02 00:04 00:05 E as onV iew -C ha loner 's t o T u rn m ire Ea s o n V iew( T urn m ir e ) to T hane t R d T h anet R d t o D ri ngho us es D ri ng hous es t o N e ls o n la n e N e ls on l a ne to P u lle y n D ri v e P u lle y n D riv e t o M ount V al e M oun t V al e t o T he M ount T he M ount t o B los s on S t Bl o s so m St re e t to R a il Stn
Test Route Sections
Ti m e i n sec s
07/06/2004(Mon) 10/06/2004(Thurs) 17/06/2004(Thurs) 18/06/2004(Fri) 24/06/2004(Thurs) 05/07/2004(Mon) 06/07/2004(Tue) Scheduled time Average
Travel time variation between consecutive bus-stops
00:00 00:01 00:02 00:04 00:05 E as onV iew -C ha loner 's t o T u rn m ire Ea s o n V iew( T urn m ir e ) to T hane t R d T h anet R d t o D ri ngho us es D ri ng hous es t o N e ls o n la n e N e ls on l a ne to P u lle y n D ri v e P u lle y n D riv e t o M ount V al e M oun t V al e t o T he M ount T he M ount t o B los s on S t Bl o s so m St re e t to R a il Stn
Test Route Sections
Ti m e i n sec s
[image:11.612.109.456.411.615.2]The averaged and scheduled run times are also shown on the graph. Travel time variations are most clearly seen on four sections: Thanet Road to Dringhouses, Mount Value to The Mount, The Mount to Blosson Street, and Blosson Street to the railway station. Similar observation was made from the primary survey results. Further analysis suggested that the high travel time in the first section was due to delays at the priority intersection from the
Thanet Road to the main radial corridor.
[image:12.612.95.397.231.420.2]The observed passenger numbers for boarding and alighting and bus dwell time are shown in Figure 5. It can be seen that there are significant variations in dwell times at bus stops and that the dwell times correlate strongly with the number of boarding passengers.
Figure 5. Observed bus dwell time and number of boarding and alighting passengers at the bus stops en-route the test section.
In our primary survey, an average 2 sec/passenger alighting time was recorded. From the observed dwell time and taking off 5 sec for door opening and closing (Clark & Pretty, 1992) and time for passenger alighting, the passenger boarding times were derived. A very high proportion of passengers (60%) have a boarding time of less than 8 seconds and 85% of
passengers boarded less than 12 seconds. Ignoring the boarding times higher than 16sec, the data gave an average boarding time per passenger of 6 sec/passenger. This value was used in the simulation study.
4. MODELLING BUS RELIABILITY IN YORK
In this section, bus reliability along Route 4 in York is further analysed through a
microsimulation modelling approach. A model of the Route 4 was developed and used to investigate the relative effect of different factors on bus unreliability and to test proposed future scenarios on reliability improvements.
Dwell time at the bus-stops and number of passengers boarding and alighting
0 1 2 3 4 5
Ea
so
n
V
iew
(C
ha
lone
r's
)
Eason
Vi
e
w
(T
ur
nmire)
Tha
net R
oad
D
ring
hou
s
es
Ne
ls
on
La
n
e
Pulleyn D
rive
M
o
unt Vale
T
h
e M
o
un
t
Blos
som St
re
e
t
Stops
No
. of
pass
en
gers
00:00:00 00:00:04 00:00:09 00:00:13 00:00:17 00:00:22 00:00:26 00:00:30 00:00:35 00:00:39 00:00:43
Dwell
T
ime in hrs:
mins:
s
e
c
s
4.1 Model Development
The model is built on an existing network model of the whole City of York calibrated to represent the average distribution of traffic flows and congestion conditions during the peak period. The area covered by Route 4 is then cordoned off from the whole network and a microsimulation model for the area developed. The microsimulation model used is the
dynamic, network model DRACULA developed at the University of Leeds. DRACULA is a suite of models which represents directly the individual drivers’ route and departure-time choices and experiences as they evolve from day-to-day, combined with a detailed within-day traffic simulation model of the space-time trajectories of individual vehicles according to car-following and lane-changing models (Liu et al., 2005). In this study, the car drivers’ route
and departure-time choices probabilities are assumed fixed to those representing the calibrated average conditions. The day-to-day variability in network conditions and in driver composition, the latter in turn represents the variability in modelled driving behaviour and characteristics, is coupled with the simulation of the individuals movements through the network. Hence both the day-to-day and within-day variability in network congestion and its
effect on bus reliability can be represented. Bus operations are modelled explicitly in DRACULA in terms of bus service frequency, route, bus stops and bus lanes, passenger boarding and bus responsive signal controls. The key element of the bus model in DRACULA is described briefly below; the full description can be found in Liu et al. (1999).
Passenger demand: In this study, the passengers’ origin-destination movement data are not
available. Therefore the passenger demand in the model is presented simply in terms of average passenger flow boarding at each bus stop and the passenger alighting is not explicitly modelled. Hence it is not possible to model the passenger route choice behaviour. For the current study in which a single bus route is analysed, this is not a serious problem.
Nevertheless, the surveyed data have been analysed in a way that they fit in the modelled input-data requirements.
Passenger arrival: The arrival of passengers to the bus stop is considered a stochastic
process. For frequent bus services (of headway less than 15minutes as it is the case for Route 4), it is assumed that the passenger arrivals are random and that the average arrival rate remains constant throughout modelled peak period. When a passenger arrives at the
bus stop, its waiting time till the next arrival bus is recorded. The total number of passengers and the total passenger wait time at each bus stop are outputs from the model used to calculate passenger wait time reliability.
Bus dwell time: The model of dwell time of buses at a bus stop is represented in eq. (4):
J j
N p c c
Dwell j
j
j 1,2,...,
0 + =
=
∑
(4)was used in the model. In this study, only one ticket type was modelled. The alighting passengers were not explicitly represented, but the observed number of alighting passengers at each bus stop and the alighting time were converted to the boarding passenger flow and an average boarding time c1=8 sec/passenger was used.
Model outputs: For this study, four groups of simulation statistics were produced by the
model and used for reliability calculation. These are: (a) the link travel times of the general
traffic at an interval of ten minutes which were used to compare with the bus travel times; (b) bus journey time outputs which provide outputs for each bus vehicle in terms of their start and finish time, the running time along each road links and between consecutive bus-stops en-route; and (c) passenger delays outputs including the number of passengers boarding each bus service and the total passenger wait time for the service.
4.2 Model Validation
The surveyed data on bus schedule (including route, service frequency, bus stops en-route), public transport priority measures already in place (bus lane), passenger flow and boarding times were used as input to the traffic model. The combined microsimulation model of the
general traffic, bus service and passenger demand of the regions was then calibrated using the surveyed bus journey time data to form the base model of the study area. The result of the calibration is shown in Figure 6. The figure shows the modelled average, minimum and maximum trajectories along the test route, compared with the observed averages. The minimum and the maximum trajectories were used to depict the range of travel times
modelled. Also shown in Figure 6 were individual vehicle trajectories observed from the primary survey. It can be seen that the modelled journey times correspond very well with the observed one along the entire test route.
Travel time between bus-stops
0 0.5 1 1.5 2 2.5
Tur nmi
re
Th anet
Rd
Dr
ingh
ouses
Nels
on la
ne
Pul
leyn D
rive
Mo
unt Va
le
The M
oun t
Blos
son S
t
Rail
Stn
Route sections (to bus stop nam e)
Ti
me
i
n
m
ins
[image:14.612.96.421.461.660.2]Modelled average observed average
Figure 6. The observed and modelled travel time between bus stops. The error bars
A detailed comparison of the link travel times between consecutive bus stops (in Fig. 7) suggest that the model is correctly depicting the journey time delay at the key sections en-route as indicated by the arrows in the graph.
Figure 7. Modelled individual link travel times between consecutive bus stops along the test route. The modelled and observed averages are drawn for comparison.
4.3 Test Scenarios
The above validated model was taken as the base-case model of Route 4. Three future scenarios were also simulated to evaluate the relative effect of different factors which contribute to bus unreliability; these were:
1) Growth in traffic congestion: with total demand for travel increased by 5% and 10%;
2) Growth in passenger travel: with a 10% increase in passenger flows; and
3) Advanced ticketing system: reduced average boarding time to 6 sec/passenger.
The growth in congestion was modelled in terms of an increase of the total car demand
without changing the route choice distribution. The growth in passenger travel was modelled by increasing the average passenger flow to all bus stops. A proposal in York to introduce pre-boarding fare payment system at high-volume times and places was modelled through a reduction in average boarding time from 8sec to 6sec.
The study time period was 90minutes to represent the morning peak from 7:45 – 9:15am. The simulation started with a 15min “warm-up” period, followed by the “main” study period of
90 minutes and ended when all traffic (including the buses) departed during the main period has reached their destination. Five simulation runs with different random number seeds were conducted on each scenario to give confidence in simulation results.
Modelled Vs Observed Average Link Travel tim es in different
0.00 0.50 1.00 1.50 2.00 2.50 3.00
Tur nm
ire
Than et Rd
Dringho uses
Nel son l
ane
Pul leyn D
rive
Moun t Val
e
The Mou
nt
Blos
son St Rail S tn
Route Sections
T
im
e
in
m
in
s
mod_average Obs_average
Modelled Vs Observed Average Link Travel tim es in different
0.00 0.50 1.00 1.50 2.00 2.50 3.00
Tur nm
ire
Than et Rd
Dringho uses
Nel son l
ane
Pul leyn D
rive
Moun t Val
e
The Mou
nt
Blos
son St Rail S tn
Route Sections
T
im
e
in
m
in
s
5. RESULTS AND INTERPRETATION
5.1 Reliability Measures for the Base Case
Travel Time Reliability
The measure of travel time reliability as defined in eq. (1) was calculated for the entire journey as well as for individual bus links (between consecutive stops). The results are
presented in Table 1.
The standard deviations in travel times are high, and the result travel time reliability measures low, on route sections Thanet Road to Dringhouses and from Mount Vale to the railway station, indicating that the measure is capable of depicting the observed problem areas.
Route Sections Average travel
time (mins)
Standard Deviation (mins)
Travel time reliability
EasonView-Lerecroft to Turnmire 1.08 0.24 4.50
Eason View(Turnmire) to Thanet Road 1.19 0.34 3.50
Thanet Road to Dringhouses 1.74 0.65 2.68
Dringhouses to Nelson lane 0.79 0.19 4.26
Nelson lane to Pulleyn Drive 0.76 0.23 3.30
Pulleyn Drive to Mount Vale 0.92 0.25 3.68
Mount Vale to The Mount 1.25 0.59 2.12
The Mount to Blosson Street 1.61 0.66 2.43
Blossom Street to Rail Station 1.99 0.42 4.74
[image:16.612.93.495.280.434.2]Whole test route 11.58 2.17 5.22
Table 1. Travel time reliability measures
Headway Reliability
The simulation outputs the arrival times of individual buses at each bus stop, from which the time headway between two consecutive scheduled services was derived and the headway reliability measure as defined in eq (2) calculated. The results, as presented in Figure 8,
show an increase in headway variability with route length. It could be the result of a multitude of effects, including traffic congestion, intersection delays and passenger flows, which accumulate along the journey.
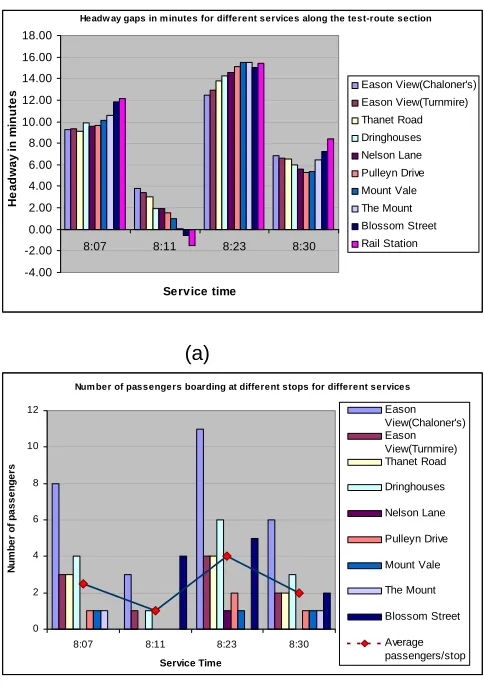
The modelled headway variation for four consecutive services and the number of passenger boarding on these services are shown in Figures 9. Two of the four services, the 08:07 and
Headway variability along the route 0.00 0.10 0.20 0.30 0.40 0.50 0.60 0.70 0.80 Ea s o n V iew (Le rec ro ft ) Ea s o n V iew (T ur n m ir e ) T han et R oad D ri ngho us e s N e ls on Lan e Pu ll e y n D ri v e M o unt V al e T he M oun t B los s om S tr e et Ra il S ta ti o n A v e rage Bus stops H e a d w a y r e lia bilit y
Figure 8: Headway reliability along the test route.
(a)
(b)
Figure 9. The headway gaps of (a) and the number of passengers boarding (b) at four of the simulated services at the bus-stops en-route.
Headw ay gaps in m inutes for different services along the test-route section
-4.00 -2.00 0.00 2.00 4.00 6.00 8.00 10.00 12.00 14.00 16.00 18.00
8:07 8:11 8:23 8:30
Service time H e a d wa y in m in u te
s Eason View(Chaloner's)
Eason View(Turnmire) Thanet Road Dringhouses Nelson Lane Pulleyn Drive Mount Vale The Mount Blossom Street Rail Station
Num ber of passengers boarding at different stops for different services
0 2 4 6 8 10 12
8:07 8:11 8:23 8:30
[image:17.612.102.344.331.676.2]Comparing with the number of boarding passengers at these services (Fig. 9b), it was clear that the higher the headways, the greater was the number of boarding passengers and vice versa. It could be interpreted that, when headway increases, the bus gets increasingly delayed along the route owing to the larger number of passengers accumulated at the bus stops. Conversely, if a bus arrives earlier, there would be fewer number of passengers
waiting to board which results in shorter dwell time at bus stops. Thus the number of passengers at stops (or bus dwell times) intensifies the bunching and spreading out of buses. As a result of this, there could be an uneven distribution of passengers on buses which in turn could result in overcrowding in some services and low capacity utilisation in others.
Passenger Wait Time Reliability
The last reliability measure calculated was the excess wait time (eq. (3)). The average wait time for boarding a frequent service is half the headway; in the case of Route 4, it was 4 min.
The actual wait time of passengers were derived from the model outputs on total passenger waiting time and the number of waiting (boarding) passengers. The expected wait time of 4 minutes was subtracted from this to get the excess wait time for each service at each bus stop. When averaged over all simulation runs, services and bus stops, the simulated average excess wait time was 1.47minutes which was slightly higher than the 1.4minutes target set
by Transport for London.
Excess waiting time for passengers
0.00 2.00 4.00 6.00 8.00 10.00 12.00
07:58 (7:58)
08:06 (8:07)
08:14 (8:17)
08:22 (8:21)
08:30 (8:33)
08:38 (8:40)
08:46 (8:50)
08:54 (8:54)
09:02 (9:06)
09:10 (9:10)
Scheduled Arrival time (Actual)
T
ime i
n
minu
te
s
Eason View(Chaloner's) Eason View(Turnmire) Thanet Road
Dringhouses Nelson Lane Pulleyn Drive
Mount Vale The Mount Blossom Street
[image:18.612.96.500.389.626.2]Rail Station
Figure 9: Excess wait time of passengers for different bus services.
with increasing headway. The highest excess wait time was observed on the 08:30 service which had an actual headway of 12minutes.
5.2 Reliability Measures of the Proposed Scenarios
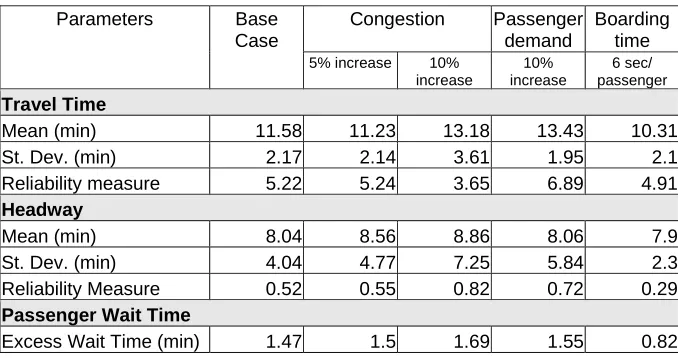
Each of the scenarios was tested separately and the results were therefore comparable directly with those of the base case. The reliability measures for the test route are tabulated in Table 2.
Congestion Passenger demand
Boarding time Parameters Base
Case
5% increase 10%
increase
10% increase
6 sec/ passenger
Travel Time
Mean (min) 11.58 11.23 13.18 13.43 10.31
St. Dev. (min) 2.17 2.14 3.61 1.95 2.1
Reliability measure 5.22 5.24 3.65 6.89 4.91
Headway
Mean (min) 8.04 8.56 8.86 8.06 7.9
St. Dev. (min) 4.04 4.77 7.25 5.84 2.3
Reliability Measure 0.52 0.55 0.82 0.72 0.29
Passenger Wait Time
[image:19.612.92.431.216.395.2]Excess Wait Time (min) 1.47 1.5 1.69 1.55 0.82
Table 2. Simulation results of the test scenarios compared to those of the base case.
Effect of increased congestion
It was clear from the results in Table 2 that increased congestion resulted in increases in both the average and the variability of bus journey times. The travel time reliability measures decreased from 6.58 to 5.24 and 3.65 for a 5% and 10% increase in travel demand respectively, indicating a steady reduction in travel time reliability.
Increased congestion also resulted in an increase in average headway which will cause bunching and spreading of buses. The effect on headway reliability was more significant with the higher level (10%) of congestion. The excess wait time also increased to 1.5 and 1.5minutes for the two scenarios; both exceeded the TfL’s target of 1.47 minutes.
Increased passenger demand
Increase in passenger demand resulted in a significant increase in total journey time, but not
only lead to an increase in dwell time, therefore total journey time. The effect on journey time variability was small suggested that run-time variability was the dominate factor in the overall journey time variability.
However, the effect on headway and passenger wait time reliability was more significant. Whilst the average headway remained more or less the same as in the base-case, the standard deviation in headways had increased. This is due to the non-uniform distribution of passenger demand along the route (see Figure 5); a proportional increase in passenger demand would intensify the non-uniform distribution of dwell times which in turn increases
the headway variability. Given the discussion on the close correlation between headway variability and excess wait time discussed in the base-case scenario (Section 5.1), it was not surprise to see the effect of increased passenger demand on excess wait time reliability.
Reduced boarding time
The average per passenger boarding time was reduced by 2sec. This led to reduced dwell time which in turn reduced total journey time. The real benefits of reduced boarding time were seen in terms of headways with headway reliability measure decreased from 0.52 to 0.29. This result strengthens further the interpretation above (on the discussion of passenger
demand) that increased dwell time would result in increased headway variation. Therefore, in a scenario where a significant increase of passenger demand is being observed, reduction in average passenger boarding time would help maintain or even improve reliability.
6. CONCLUSIONS
This study has attempted to develop a microsimulation modelling framework to evaluate bus
reliability levels on a test route in York. The advantage of using micro-simulation is that one
may test scenarios in an easier, faster and cheaper way than feasible in the field, and that
some measures of effectiveness may be impossible to be assessed in a field survey. The
developed model was used for studying impact of proposed scenarios in increased
congestion, rise in passenger demand and reduction in per passenger boarding time on the
reliability of the test-section of Route 4.
The model results show that the headway variation and number of boarding passengers are
strongly correlated, which suggests a chain effect in that irregular headways lead to irregular
passenger distribution and that in turn further intensifies the bunching and headway variation
in the service. The result show clearly that unreliability increases with increasing congestion
and passenger demand. The passenger demand has more serious impact on headway
variability and passenger wait time than on total journey time reliability. Reduced average
The current study has focused only for a small test-section of Route 4 in York which has a
frequent and regular bus-service. Also, while carrying out scenario tests, a limited set of
measures was used and options like signal improvements, bus-stop location etc. were not
tested. It would be useful however, to extend this approach to larger city networks. Also,
future studies which examine reliability issues in large and irregular headway services as well
as test a larger range of strategies
ACKNOWLEDGEMENTS
The research reported in the paper was carried out under the project FIT152 funded by the UK Department for Transport and the project DISTILLATE funded by the UK Engineering and Physical Science Research Council. We thank First Group for providing the TRACKER data and Dr Jose Sorritino for helpful discussion.
REFERENCES
Abkowitz, M. and Tozzi, T. (1987) Research contributions to managing transit service reliability. J. Advanced Transportation, 21, 47-65.
Bates, J., Polak J., Jones P. and Cook A. (2001) The valuation of reliability for personal travel, Transportation Research Part 37E, 191-229.
Bowman, L.A. and Turnquist, M. (1981), Service frequency, schedule reliability and passenger wait times at Transit stops, Transportation Research A, 15A, 465-471
Chapman, R.A. (1976). Bus Reliability – Definition and measurement, Research Report no.18, Transport Operations Research Group, University of Newcastle upon Tyne, UK.
Clark, S.D. and Pretty, R. L (1992), Measurement of bus waiting times along an arterial road. ITS Technical Note 328, Institute for Transport Studies, University of Leeds.
Guenther, R.P and Sinha, K.C. (1983) Maintenance, Schedule Reliability and Transit System Performance, Transportation Research A, 355-362.
Janos, M. and Furth, P.G. (2002) Bus priority with highly interruptible traffic signal control: Simulation of San Juan’s Avenida Ponce de Leon. Paper presented at TRB Annual Conference, Washington D.C.
Liu, R., Clark S.D., Montgomery F.O. and Watling D.P. (1999) Microscopic modelling of traffic management measures for guided bus operation. In Selected Proceedings of 8th World Conference on Transport Research, (eds. Meersman, H, Van de Voore E. & Winkelmans W), Vol 2, 367-380, Elsevier.
Meyer, M.D. (2002) Measuring system performance: The key to establishing operations as a core agency mission. Paper presented at TRB Annual Conference, January, Washington D.C..
Oort, N. and Nes, R. (2003), Service Regularity Analysis for Urban Transit Network Design, Paper presented at TRB Annual Meeting, January, Washington DC.
Polus, A. (1978) Modelling and measurements of bus service reliability, Transportation Research 12, 253-256.
Prashker, J.N. (1979) Scaling perceptions of reliability of urban travel modes using Indscal and factor analysis models. Transportation Research, 13A, 203-212.
Reitvield,P., F.R.Bruinsma and D.J. van Vuuren, (2001) Coping with unreliability in public transport chains: A case study for Netherlands, Transportation Research 35A, 539-559.
Sterman,B.P. and Schofer, J.L. (1976) Factors affecting reliability of Urban bus Services, Transport Engineering Journal, 147-159.
Strathman J.G, Kimpel T.J, Dueker K.J (2001) Evaluation of Transit Operations: Data Applications Tri-Met’s Automated Bus Dispatching system, Transportation Research Board Annual Meeting 2002.
TfL (2006) http://www.tfl.gov.uk/buses/about/performance/borough-report.asp (accessed on
6 Dec 2006).
Turnquist M.A and Bowman, L.A (1980) The effects of network structure on reliability of transit service. Transportation Research 14B, 79-86.