This is a repository copy of A Database for a Pedestrian and Pedal Cyclist Traffic Model.
White Rose Research Online URL for this paper:
http://eprints.whiterose.ac.uk/2256/
Monograph:
Van Schagan, I.N.L.G. (1990) A Database for a Pedestrian and Pedal Cyclist Traffic Model.
Working Paper. Institute of Transport Studies, University of Leeds , Leeds, UK.
Working Paper 303
Reuse
Unless indicated otherwise, fulltext items are protected by copyright with all rights reserved. The copyright exception in section 29 of the Copyright, Designs and Patents Act 1988 allows the making of a single copy solely for the purpose of non-commercial research or private study within the limits of fair dealing. The publisher or other rights-holder may allow further reproduction and re-use of this version - refer to the White Rose Research Online record for this item. Where records identify the publisher as the copyright holder, users can verify any specific terms of use on the publisher’s website.
Takedown
If you consider content in White Rose Research Online to be in breach of UK law, please notify us by
White Rose Research Online
http://eprints.whiterose.ac.uk/
Institute of Transport Studies
University of Leeds
This is an ITS Working Paper produced and published by the University of
Leeds. ITS Working Papers are intended to provide information and encourage
discussion on a topic in advance of formal publication. They represent only the
views of the authors, and do not necessarily reflect the views or approval of the
sponsors.
White Rose Repository URL for this paper:
http://eprints.whiterose.ac.uk/
2256/
Published paper
Drive Project V1031: An Intelligent Traffic System for Vulnerable Road Users Workpackage 6: Database Construction
DRIVE Project V1031
An Intelligent Traffic System for Vulnerable Road Users
A DATABASE FOR A PEDESTRIAN AND PEDAL CYCLIST TRAFFIC MODEL THEORETICAL CONSIDERATIONS AND EMPIRICAL DATA
I.N.L.G. van Schagen
Deliverable No. 9
Workpackage 6: Database Construction
Workpackage Leader: I.N.L.G. van Schagen, TRC, University of Groningen
ITS Working Paper 303
The research reported herein was conducted under the European Community DRIVE Programme. The project is being carried out by a consortium comprising: Institute for Transport Studies, The University of Leeds; West Yorkshire Highways Engineering and Technical Services; Traffic Research Centre, University of Groningen; Department of Traffic Planning and Engineering, Lund Institute of Technology, Lund University; and H.B. Modules Limited. The opinions, findings and conclusions expressed in this report are those of the author alone and do not necessarily reflect those of the EC or of any organization involved in the project.
Traffic Research Centre University of Groningen P.O. Box 69
9750 AB Haren The Netherlands
Tel.: +31 50 636780, Fax: +31 50 636784
ISSN number: 0142-8942
© 1990 Traffic Research Centre, University of Groningen, The Netherlands
PUBLIC REPORTS OF DRIVE PROJECT V1031
Workpackage 1
Ekman, L., Draskòczy, M. (1989) Problems for vulnerable road users in Sweden. Final report for workpackage 1 of DRIVE project V1031: An intelligent traffic system for vulnerable road users. WP 299, Institute for Transport Studies, University of Leeds.
Schagen, I.N.L.G. van, Rothengatter, J.A. (1989) Problems for vulnerable road users in the Netherlands. Final report for workpackage 1 of DRIVE project V1031: An intelligent traffic system for vulnerable road users. WP 300, Institute for Transport Studies, University of Leeds.
Tight, M.R., Carsten, O.M.J., Sherborne, D.J. (1989) Problems for vulnerable road users in Great Britain. Final report for workpackage 1 of DRIVE project V1031: An intelligent traffic system for vulnerable road users. WP 292, Institute for Transport Studies, University of Leeds.
Workpackage 2
Tight, M.R., Carsten, O.M.J. (1989) Problems for vulnerable road users in Great Britain, The Netherlands and Sweden. Final report for workpackage 2 of DRIVE project V1031: An intelligent traffic system for vulnerable road users. WP 291, Institute for Transport Studies, University of Leeds.
Workpackage 3
SUMMARY
A traffic model in general and more specifically a traffic model on a meso and micro level that takes into account pedestrians and pedal cyclists requires a great deal of empirical data and this data must be stored in a database in such a format that the model can retrieve it. Three categories of empirical data and therefore three types of databases must be distinguished:
–location-specific database –knowledge base
–safety base
In this report the theoretical considerations behind the three-part division are discussed and the location-specific data and the behavioural knowledge data are elaborated.
The required location-specific data are flow, origin-destination of pedestrian and pedal cyclist trips and the physical characteristics of the location to be modelled. A computer programme was developed to store these data in ASCII-format output files. This programme is described and the data collection procedures in each of the three experimental locations (Bradford (GB); Groningen (NL); and Växjö (S)) is specified. The data itself is available on floppy disc, but not discussed here.
TABLE OF CONTENTS
1 INTRODUCTION
I.N.L.G. van Schagen... 1
2 CONCEPTUAL FRAMEWORK OF DATABASE CONSTRUCTION J.A. Rothengatter... 5
2.1 LOCATION-SPECIFIC DATABASE ... 6
2.2 KNOWLEDGE BASE... 6
2.3 SAFETY BASE... 7
2.4 CONCLUSIONS ... 7
3 LOCATION SPECIFIC DATA I.N.L.G. van Schagen and P.K. Westerdijk... 8
3.1 THE DATABASE CONSTRUCTION PROGRAMME... 8
3.2 FLOW DATA AND ORIGIN-DESTINATION DATA IN BRADFORD, GRONINGEN AND VÄXJÖ... 10
4 KNOWLEDGE BASE... 12
4.1 DEFINITIONS AND DATA COLLECTION METHOD J.M. Spikman and I.N.L.G. van Schagen... 12
4.2 PEDESTRIAN BEHAVIOUR IN BRADFORD O.M.J. Carsten, F.C. Hodgson and M.R. Tight... 16
4.3 PEDESTRIAN AND PEDAL CYCLIST BEHAVIOUR IN GRONINGEN J.M. Spikman and E.J. Westra... 25
4.4 PEDESTRIAN AND PEDAL CYCLIST BEHAVIOUR IN VÄXJÖ M. Draskòczy ... 34
4.5 LOCATIONAL SIMILARITIES AND DIFFERENCES I.N.L.G. van Schagen... 41
5 CONCLUDING REMARKS I.N.L.G. van Schagen... 43
6 REFERENCES... 45
1
INTRODUCTION
I.N.L.G. van Schagen
Walking and pedal cycling are environmental friendly and, within built-up areas, efficient transport modes. Accident involvement and accident risk, however, are important negative characteristics (see Tight and Carsten, 1989). It is not without reason that pedestrians and pedal cyclists are commonly referred to as unprotected or vulnerable road users. Another negative factor for pedestrian and pedal cyclist traffic is that the needs of these modes are often disregarded or placed second to the needs of motorized traffic, for example by planners and traffic engineers.
The project, of which this report is one of the outcomes, is developing a set of tools to improve the situation for the vulnerable road users, both in terms of safety and in terms of mobility. Two approaches are being followed. On the one hand, a pedestrian and a pedal cyclist traffic model is being developed, that will be able to predict the effects of infrastructural and technical measures on vulnerable road user traffic flows and safety. On the other hand, a number of infrastructural measures will be applied and evaluated, in particular microwave detection equipment that makes it possible to adapt a traffic light cycle to the actual presence of pedal cyclists or pedestrians. The results of these evaluation studies will be used as a validation of the model's predictive power.
This report is part of the modelling approach of the project. It presents a theoretical framework for the representation of empirical data that feeds the model (database construction) and the results of a number of small-scale observation studies that were carried out to fill the database.
Given the objectives of this project, the pedestrian and cyclist model will focus on a meso situation, so that the effects of infrastructural changes on traffic behaviour, route choice and safety can be predicted. In each of the three participating countries (Great Britain, the Netherlands and Sweden) a three-junction area with high pedestrian flows and, for the Netherlands and Sweden, with high pedal cyclist flows was selected as the modelling area. A detailed description of the chosen sites can be found in Van Schagen (1990).
The location in Sweden is to be found in Växjö, a town in the south of the country. The three junctions, in the middle of the town centre (see figure 3), all have traffic lights and pedestrian crossing lights, which have to be activated by a push button. The pedestrian crossings are not conflict free: pedestrians have green at the same time as parallel road traffic.
Figure 3:The Experimental Site in Växjö (S)
3 CONCEPTUAL FRAMEWORK OF DATABASE CONSTRUCTION
J.A. Rothengatter
Basically, a meso model aims to predict a set of “performance” characteristics of a meso world consisting of several related junctions. Given the project's objectives, the output of the pedestrian model can be defined as follows:
a. Flow and junction capacity
Changes in signal set-up and cycle times will have major effects on flow and junction capacity. There are already models available that predict such effects for vehicular traffic (e.g. SATURN). Although capacity for pedestrian traffic will not be a factor of importance in most cases (as demand is unlikely to exceed supply), the main flow might be redirected because of changes in signal settings.
b. Delay times
Delay times are assumed to affect both red light violation and the attractiveness of routes for the different groups of road users. Red light violation is assumed to have a safety effect, but is in any case to be considered as a negative effect that should be minimized. The attractiveness factor is linked to pedestrian flow migration.
c. Safety effects
An objective measure should be found that predicts the effects of infrastructural changes upon safety for particular types of crossings. This is particularly important in relation with pedestrian flow migration.
The outcomes of the cyclist model are similar except for the flow prediction. The meso world that is modelled is too small to study flow migration of cyclists: the route choices within the area are limited. Junction capacity for cyclist traffic, on the other hand, is of concern, in particular, in the Netherlands.
In order to produce output the model needs to have information about the location whose performance it has to predict, and needs to have information about the behavioural and safety implications of the location's characteristics. This is the area of database construction.
considerations apply, mutatis mutandis, for the safety aspects: again general information is required to allow the model to produce predictions of safety effects. Hence a safety base is an additional requirement. These components — location-specific database, knowledge base, safety base — are further elaborated below.
4.1 LOCATION-SPECIFIC DATABASE
The location-specific database contains the information that needs to be collected for the junction(s) to which the model is applied. What information is essential to the functioning of the model needs to be established empirically. At present, this can only be logically inferred. Obviously, choosing a too limited set of variables will result in a model that has poor predictive validity, and choosing a too extended set of variables will result in a model that requires an unnecessary amount of data collection which will be prohibitive to the model application. At present, the following classes of variables are considered:
–Physical characteristics of the junction(s) –Signal characteristics and cycle times –Origin-destination matrix
4.3 KNOWLEDGE BASE
Much of the information relevant to the model's accuracy can be considered as general knowledge, contained in a separate knowledge base. Again, what information is relevant to the functioning of the model needs to be established empirically. However, in this case the trade-off is different. While a too limited set of information will, again, limit the model's power of prediction, a too extensive set may at most result in using unnecessary computing time. The main problem is that the information needs to be extracted from the available empirical studies, and, if not available, needs to be established by carrying out additional observation studies. If the latter are necessary, this does not need be carried out at the experimental locations. Indeed, it is advisable to obtain the information at other locations, since this would avoid possible overestimation of the model's predictive power.
The format of the information in the knowledge base can be twofold. For example, the likelihood of pedestrian red light violation can be presented in the form of a set of tables with percentages of different mean speeds for approaching traffic, different traffic intensities, different length of red phases, different road width and so on. However, it is also possible to present this information in the form of equations expressing the relationship between the above variables and red light violation. Though, in the end, the equation-like format is easier to apply, it requires so much detailed empirical data that it is not feasible within the scope of this project.
circumstances may require additional data collection or data adjustment. For example, if the situation that is modelled has a specific population as might be the case in the neighbourhood of homes for the elderly or schools, the general behavioural information about the “average” pedestrian no longer applies.
4.5 SAFETY BASE
For the construction of the safety base, two approaches could be followed. The first is to include empirical data concerning behaviour-safety relationships or the relationships between physical and/or signal characteristics and safety. If this approach is followed, the format and implementation would be the same as for the knowledge base. However, it should be anticipated that little empirical data about the above mentioned relationships is available, and that such data is not easily obtainable. It will therefore be necessary to include data which is not empirically-based and no more than educated guesses. The model's predictions will in that case be as good as the guesses. Establishing the validity of these guesses is likely to involve an extensive data collection effort.
The alternative approach is a mechanistic safety model. The model (to be distinguished from the movement model per se) would contain no more than a set of likelihood equations based on flow information. The simplest form of such equations would take into account the conflicting flows for each manoeuvre and the distribution of these flows. Further sophistication could be achieved by taking into account platooning and such like, while a third level of sophistication would take into account scenario-type information for each possible flow conflict. Of course, the more sophistication is built into this mechanistic approach, the more it starts resembling the empirical data approach. However, this approach has the advantage that it is far more systematic than the haphazard accumulation of empirical data.
4.7 CONCLUSIONS
Three separate databases were proposed: a location-specific database, a knowledge base and a safety base. Specific input for a location is required for the location-specific database only. The knowledge and safety bases contain general information, that is applicable to all or at least a specific set of locations. In this way the data collection effort for future use will be limited. If location-specific data on behaviour or safety is available, the model will have to be able to take into account the modifications of the general information. This will increase the predictive power of the model.
5 LOCATION SPECIFIC DATA
I.N.L.G. van Schagen and P.K. Westerdijk
6.1 THE DATABASE CONSTRUCTION PROGRAMME
As explained in the previous chapter, location-specific data must be collected for each location that is modelled. In order to make the data entering procedure in the model's application more user-friendly and to store the data in a format readable by the model, a computer programme was developed that asks for required flow and origin-destination information and stores this information in ASCII format data output files. The computer programme distinguishes between absolutely necessary information and additional information without which the model still runs though with decreased predictive power. The idea behind the distinction between necessary and additional information is that, in practice, specified data will often not be available and extensive data collection will be too demanding of effort. However, if it is available, the model must be able to deal with it, because it will probably improve the outcome of the model.
The programme can handle a location with maximally nine related junctions and an infinite number of exit and entry points between the junctions (e.g. side roads). A floppy disc containing the programme can be found at the back of the report. The programme is started by the command DB-VRU.
The first step in the programme is the description of the area that is to be modelled: the number and codes or names for the junctions, the extra exit and entry points between the junctions and the presence of pedestrian or traffic lights. These data are saved in a file called AREA.DAT and are referred to throughout the rest of the programme.
Then the flow data part of the programme can be started, beginning with motorized vehicles. The minimum requirement is the total car inflow by leg by junction for an hour period. The programme can handle a number of specifications in the motorized vehicle flow data:
–flow by manoeuvre by leg by junction –flow in peak and off-peak hours
–flow of different categories of motorized vehicles (buses, light good vehicles, heavy good vehicles, motor cycles, taxis, private cars)
and all combinations of these specifications.
Another requirement is the flow data (specified or not by manoeuvre) at the extra entry/exit points between the junction. All data on motorized vehicle flow is saved in file CARFLOW.DAT.
minimum requirement is the total inflow by leg by junction for an hour period. Specifications can be entered about:
–flow by manoeuvre by leg by junction –flow in peak and off-peak hours –flow by gender and/or (six) age groups
and all combinations of these.
The same applies for the extra entry/exit points between the junctions: the minimum is the inflow per hour; specifications in terms of manoeuvre, peak/off-peak hours, age and gender are possible. Pedal cyclists may also enter or leave the area at places that are not directly accessible by pedal cyclists (e.g. blocks of shops, pedestrian zones), because they can easily mount or dismount their bicycle. The number of entry and exit points might therefore be larger than for motorized vehicles. The data on pedal cycle flow is saved in a file CYCFLOW.DAT.
The next two steps in the programme concern pedestrian flow at junctions and other entry/exit points and pedestrian flow at midblocks, respectively saved in the files PEDFLOW.DAT and MIDBLOCK.DAT. If pedestrian movement is one of the objectives of the model's application, the total pedestrian inflow at junctions and other entry/exit points is again the minimum requirement. Contrary to motorized traffic and pedal cyclists, pedestrians can enter a junction at both sides of the road, so that the total number of inflow possibilities at a normal four legged junction is eight instead of four. Specifications can be given on:
–direction (crossing diagonally is considered as a separate direction) –peak/off-peak periods
–gender and (six) age categories
and on all combinations.
The inflow at entry/exit points other than junctions (side roads, blocks of shops, residential areas) is requested as well, if available, specified by direction, age and gender. A side road is considered as two entry/exit points to cover pedestrians at both sides of a road.
Midblock crossings are important movements of pedestrians that the model should take into account. The sections between junctions or side roads were divided into an arbitrary number of midblocks in the area description stage. A midblock can be a pelican crossing, a midblock non-signalised zebra crossing or a part of the road without pedestrian facilities. For all defined midblocks the number of crossing pedestrians must be entered. If available a distinction can be made between peak and off-peak hours and/or between different age and gender categories.
The last step of the programme is the correction of the default data in the knowledge base, if location specific data are available. This part of the programme is not yet worked out, as it requires discussion on the format and level of detail of the behavioural data. As was indicated in Chapter 2, this will be part of the next workpackage in this project: integration of model and empirical data. To illustrate the working of the programme, the average speeds of cars, pedal cyclists and pedestrians are already entered in the programme. The programme shows the default value of each variables and asks whether this default value is (seemingly) correct or that it should be replaced by another value on the basis of location-specific empirical data. The default data are stored in the file KNOWBASE.DAT.
When the programme is finished, seven files are created: AREA.DAT, CARFLOW.DAT, CYCFLOW.DAT, PEDFLOW.DAT, MIDBLOCK.DAT, MATRIX.DAT and KNOWBASE.DAT. A codebook of these files is presented in Appendix 1.
6.3 FLOW DATA AND ORIGIN-DESTINATION DATA IN BRADFORD, GRONINGEN AND VÄXJÖ
Flow data was collected in each of the three experimental locations, that is for a three-junction area. Video observations of the three-junctions during a peak period and an off-peak period were analyzed in the laboratory. Counts were made of the number of motorized vehicles (in Bradford split up into five categories, in Groningen into two categories), the number of pedal cyclists and the number of pedestrians by manoeuvre. In Bradford the peak period observations took place between 07:30 and 09:00 and between 15:00 and 18:00, the off-peak between 09:30 and 11:00. In Groningen the peak period observations were carried out between 15:30 and 17:30 and the off-peak between 09:30 and 11:30. The observations in Växjö were between 12:00 and 13:00 for the peak period and between 09:00 and 10:00 for the off-peak period.
Apart from flows on junctions, a number of other flows in the area were recorded as well: pedestrian crossings at midblocks, pedestrians entering and leaving shops, pedestrians entering and leaving buses (only if there were bus stops in the modelling area, which was the case in Groningen). Observations were carried out manually in both a peak period and an off-peak period. The observation time was generally shorter than the observation time on the junctions (see Table 1).
Table 1:Observation time (in minutes) for pedestrian flows at midblock crossings, in and out of buses and in and out of shops
Bradford Groningen Växjö
peak off-peak peak off-peak peak off-peak
buses – – 120 120 – –
midblock 40 40 60 60 60 60
Information on origin and destination was collected with the aid of a questionnaire, which was presented to approximately 1000 pedestrians in Bradford, Groningen and Växjö and to approximately 1000 pedal cyclists in Groningen and Växjö. The question on origin and destination was only part of the purpose of the questionnaire study. The other aspects of the questionnaire study are described in Van Schagen (1990).
7 KNOWLEDGE BASE
8.1 DEFINITIONS AND DATA COLLECTION METHOD J.M. Spikman and I.N.L.G. van Schagen
With regard to the development of a knowledge base, behavioural data has been collected on pedestrian and pedal cyclist red light violation, gap acceptance and rule compliance, to provide the model with data concerning vulnerable road users' behaviour in relation to other traffic and in relation to the use of cyclist/pedestrian facilities. As the ultimate purpose of this project is to increase safety and to decrease delay for vulnerable road users, information about behavioural aspects which can cause delay and/or unsafety for VRUs is necessary. Relevant factors are, for example, waiting for traffic lights, crossing a road and getting no priority when having right of way. Investigation of red light violation, gap acceptance and rule compliance could provide useful data about the type and duration of delays to vulnerable road users and the way they handle these situations. In part, these data has been collected by a review of the relevant literature in each of the three countries. In addition, small field studies have been carried out in each of the experimental areas.
In sections 4.2 through 4.4, the results of the literature review and the field studies in the experimental area are discussed for Great Britain, the Netherlands, and Sweden respectively. In the field studies carried out in each of the countries, as far as possible a similar methodology was applied and the same definitions were used. The definitions and methodology for data collection on red light violation, gap acceptance and rule compliance are discussed below.
For each factor, relevant sites within the experimental area were chosen and on every chosen location video recordings or manual counts took place during a peak and an off-peak period. These were all done on normal working days during hours that shops were open.
Red light violation
Both for pedestrians and cyclists four categories were distinguished, depending on the stage of the traffic light during arrival and departure:
Traffic light
Stage arrival Stage departure
a. Green cyclists/walkers green green
b. Green waiters red green
c. Red cyclist/walkers red red
d. Yellow cyclists/walkers yellow/flashing yellow/flashing
–total number of people arriving (a+b+c+d)
–number of people arriving at green and yellow/flashing (a+d), as a percentage of the total number of people arriving (a+b+c+d)
–number of people arriving at red (b+c)
–number of people arriving at red who don't wait for green (c), as a percentage of the total number of people arriving at red (b+c).
These percentages had to be computed for the total group and for the gender and age categories distinguished, if these variables were recorded.
Gap acceptance
To get an indication about the gaps that pedestrians and cyclists accept when crossing a road, a small field study was carried out. To compute the accepted gaps, the following data of each observed crossing had to be collected:
Pedestrians First lane crossing
T–1:the moment the pedestrian reaches the kerb T0:the moment the pedestrian leaves the kerb
T1:the moment the pedestrian reaches the centre line of the road
T2:the moment the first car (or other road traffic) reaches the (imaginary) crossing line of the pedestrian
Second lane crossing
T3:the moment the pedestrian leaves the centre line
T4:the moment the pedestrian reaches the kerb at the other side
T5:the moment the first car (or other road traffic) reaches the (imaginary) crossing line of the pedestrian.
Cyclists, going straight on First lane crossing
T–1:the moment the front wheel of the bicycle reaches the (imaginary) line between the kerbs of the side road
T0:the moment the front wheel of the bicycle crosses the (imaginary) line between the kerbs of the side road
T1:the moment that the cyclist (not the wheels) reaches the centre line of the road
T2:the moment the first car (or other road traffic) reaches the imaginary crossing line of the cyclist
Second lane crossing
T3:the moment the cyclist leaves the centre line
T4:the moment the cyclist rides parallel to the kerb of the chosen road
T5:the moment the first car (or other road traffic) reaches the (imaginary) crossing line of the cyclist.
with the exception of T1: the moment the cyclist rides parallel to the kerb of the chosen road.
Accepted gaps had to be computed by the formula T2–T1 (first lane) and the formula T5– T4 (second lane), only if the gap was smaller than 8 seconds. If there was no crossing traffic within 8 seconds, it was determined that there was no question of gap acceptance. Furthermore, approaching traffic had to go faster than 10 km/hr, otherwise there is also no question of gap acceptance, and the observation had to be made when traffic was effectively free-flowing, e.g. not approaching a red light.
This definition of gap, i.e. “the gap between the moment the pedestrian/cyclist reaches the centre line of the road or kerb and the moment the first vehicle reaches the imaginary crossing line of the pedestrian/cyclist” differs from the definition of gap generally used in gap acceptance studies. The definition used here was chosen for practical reasons, in that it is easier to observe the arrival at the centre line of a road than arrival at a not yet defined place somewhere in the middle of a lane, as is done in other gap acceptance studies. The consequence of this definition is that gaps can be negative (i.e. when a pedestrian/cyclist has not yet reached the centre line at the moment road traffic passes) and therefore that the gaps reported here are an underestimation of accepted gaps according to the “normal” definition.
On the basis of the recorded times per crossing, the delay times could be computed by the formula T0–(T–1) (first lane) and the formula T3–T1 (second lane). If a pedestrian/cyclist did not stop before crossing the road, T0–(T–1) will be zero.
If possible, pedestrians/cyclists were divided into gender and age (<12 yr, 12-60 yr and >60 yr) categories. For both groups, for every category and time period (peak and off-peak) of the computed gaps the medians had to be computed instead of the averages, to minimize the role of extreme values.
Rule compliance
Rule compliance, in particular vehicle compliance to priority rules, is a factor that influences the throughput of pedestrians and pedal cyclists. Again a small field study was carried out to obtain an indication about the effects of rule compliance of motorized road traffic towards pedestrians and cyclists.
Given the experimental situations in the three countries, six priority rules could be relevant. Not every rule was relevant in each country, because the situations in which a rule was relevant were not present everywhere.
For pedestrians there are four possible priority rules:
Rule 1:cars and other road traffic have to yield for pedestrians who cross during the green stage of the pedestrian light.
Rule 2:turning cars and other road traffic have to yield for pedestrians who are on the same road and want to cross.
For cyclists there were two possible priority rules:
Rule 1:turning cars and other turning road traffic have to yield for cyclists who go straight on at the same road, both when going in the same and in the opposite direction. Rule 2:cars and other traffic approaching a major road have to yield for cyclists who are
riding on the major road.
For both groups (pedestrians and cyclists) there had to be recorded the total number of relevant encounters (a relevant encounter is defined as an encounter between a pedestrian/cyclist (VRU) and other road traffic where at least one slows down in anticipation of yielding, or stops to avoid a conflict), divided into six categories:
A1:number of encounters between a VRU and a motorized vehicle, where the VRU slows down or stops and is forced to yield
B1:number of encounters between a VRU and a( -nother) cyclist, where the VRU slows down or stops and is forced to yield
A2:number of encounters between a VRU and a motorized vehicle, where the VRU slows down or stops, but is given priority
B2:number of encounters between a VRU and a (-nother) cyclist, where the VRU slows down or stops, but is given priority
A3:number of encounters between a VRU and a motorized vehicle, where the VRU does not need to slow down or stop (i.e. the vehicle slows down or stops to yield)
B3:number of encounters between a VRU and a (-nother) cyclist, where the VRU does not need to slow down or stop (i.e. the cyclist slows down or stops to yield).
8.3 PEDESTRIAN BEHAVIOUR IN BRADFORD O.M.J. Carsten, F.C. Hodgson and M.R. Tight
8.4.1 Crossing behaviour in pelican zones
No relevant literature on pedestrian crossing behaviour in pelican zones has been found. The observation data on pedestrian crossing behaviour was collected at the pelican crossing in the Bradford study area (see Figure 1), using video observation. A total of 199 crossings within the area of the pelican (i.e. within the area delineated by the zigzag lines) were recorded. Of these crossings, 124 took place during a peak period (08:00-09:00 and 15:00-15:40) while the rest were in an off-peak period (09:30-10:40).
By no mean all the pedestrian crossed on the pelican proper. Many crossed on either side of the crossing but within the area of the zigzags. Here there were some large differences by type of pedestrian and by time period (peak or off-peak). Overall 128 of 199 crossings were on the pelican proper, while 70 were outside the crossings and one was partially in the crossing. Table 1 shows how the use of the pelican was broken down by sex. In the case of males, slightly less than half crossed in the pelican proper, while the overwhelming majority of females (85%) crossed on the pelican rather than near it. Table 2 shows the same distinction by age group. Here a substantial difference can be observed between the under-13 age group, of whom 88 percent used the crossing proper, and all other ages, for whom there was a roughly equal split between crossing on the pelican and crossing near the pelican.
Table 1: Crossings in pelican zone by sex
Males Females
On pelican 46.8% 84.6%
Partly on pelican 0.9% 0.0%
Not on pelican 52.3% 15.4%
100% 100%
(n=109) (n=78)
Table 2: Crossings in pelican zone by age
0-12 yr 13-59 yr 60+ yr
On pelican 88.1% 52.6% 42.9%
Partly on pelican 0.0% 0.9% 0.0%
Not on pelican 11.9% 46.5% 57.1%
100% 100% 100%
(n=67) (n=114) (n=14)
Tables 4 and 5 show that this difference between the peak and off-peak periods cannot be attributed entirely to the kinds of pedestrians crossing the road in the two time periods. Looking at the split by sex in Table 4, both males and females show a greater tendency to use the pelican in the off-peak period. Examining the split by age in Table 5, both the under-13 age group and older pedestrians were more likely to use the crossing proper during the off-peak periods. It should be noted that 100 percent of children used the crossing proper in the off-peak period.
Table 3: Crossings in pelican zone by peak/off-peak
Peak Off-Peak
On pelican 54.0% 81.3%
Partly on pelican 0.8% 0.0%
Not on pelican 45.2% 18.7%
100% 100%
(n=124) (n=75)
Table 4: Crossings in pelican zone by peak/off-peak and sex
Peak Off-Peak
Males
On pelican 35.1% 71.4%
Partly on pelican 1.4% 0.0%
Not on pelican 63.5% 28.6%
100% 100%
(n=74) (n=35)
Females
On pelican 78.9% 90.0%
Not on pelican 21.1% 10.0%
100% 100%
(n=38) (n=40)
Table 5: Crossings in pelican zone by peak/off-peak and age
Peak Off-Peak
0-12 yr
On pelican 73.3% 100.0%
Not on pelican 26.7% 0.0%
100% 100%
(n=30) (n=37)
13+ yr
On pelican 46.7% 63.2%
Not on pelican 52.2% 36.8%
100% 100%
(n=90) (n=38)
8.4.3 Red light violation and delay times
No literature was found on pedestrian red light violation. There has been some previous research carried out looking at pedestrian delay times. Wilson and Grayson (1980) in a study of three roads in busy shopping areas, showed that the mean delay at the kerb was on average 2.4 seconds, and varied from 1.8 seconds for males to 2.7 seconds for females. Total road crossing delay, taking into account the delay experienced in the road as well as that at the kerb, was also calculated and shown to vary markedly with age, with an average of 4.8 seconds for 15-19 year olds to 8.4 seconds for pedestrians aged 70 or over.
Goldschmidt (1977) looked at pedestrian delay at a number of types of crossing location, including random crossing points, signalised junctions, pedestrian refuges, zebra crossings and pelican crossings. On the basis of empirical research he came up with a number of equations, using a multiple regression analysis, which described the mean pedestrian delay and the proportion of pedestrians delayed at each of the types of crossing location. These were as follows:
At random crossing points: d = 1.26 + 4.54x10⁻⁶Q2
p = 1.01 - e-1.03x10E-3Q
At signalised junctions:
d = 0.68 + 5.84x10⁻⁵QE2/W - 1.12x10⁻⁴Q1.5 + 0.071G
p = -0.04 + 0.018√Q
At refuges:
d = 4.21 + 1.56x10⁻⁶Q2
p = 1.0 - e-1.06x10E-3Q
At zebra crossings: d = -0.95 + 0.38√H p = 0.17 + 0.032√H
At pelican crossings:
d = 6.99 + 2.28x10⁻⁶Q2 - 0.51F
p = 0.44 + 0.092S + 0.0019M
Where:
d =mean pedestrian delay
p =proportion of pedestrians delayed Q =traffic flow (vehicles per hour)
H =medium and heavy goods vehicle flow (vehicles per hour) W =road width (metres)
G =length of green phase (driver aspect of signals) in seconds
F =length of flashing green (pedestrian aspect of signals) in seconds
S =estimated vehicle speed (1 = congested stop/start driving, 2 = below 20mph, 3 = 20-30 mph, 4 = over 30 mph)
In summary the Goldschmidt study found that delays at zebras correlated better with flows of medium and heavy goods vehicles than with total traffic flows. The author theorizes: “This may reflect a reduced willingness on the part of large vehicles to stop, as well as a degree of intimidation of the pedestrian.” Another finding was that, on average, the delay at pelican crossings was two or three times as great as the delay at zebras. Pelican crossings are often set to a delay of up to 45 seconds between pressing of the button by a pedestrian and activation of the signal. Many pedestrians, especially men, were observed to become impatient and to cross before the lights changed, while others, especially the elderly, were unable to react quickly enough to a change in the lights and so were left stranded for considerable periods. Some critics of pelican crossings have termed them pedestrian-delay devices.
Another study (JURUE, 1975) came up with the following best predictive equation for delay time:
d = 0.3 + 6.7x10⁻⁶ Q2
Where:
d =mean delay in seconds
Q =traffic flow in vehicles per hour
This study was carried out only at random crossing points and found that delay could be predicted by traffic flow alone.
Work in Coventry (City of Coventry, 1973) modelled pedestrian crossing time by traffic flow and road width where there were no crossing facilities and by traffic flow alone where there were zebras or traffic signals. An increase in flow from 1000 to 2000 vehicles per hour raised crossing time where there were no facilities by about 60 percent.
Crompton (1978) took some of these ideas further in a study of pedestrian delays and their relationship with traffic, layout characteristics, and certain types of traffic management measures. By means of an interview survey he looked at the numbers of people who noticed delay, the numbers of people who were annoyed by delay, the numbers of people who have difficulty in crossing and the numbers of people who worry about the safety in crossing roads.
It was shown that noticeability increases logarithmically with increases in mean delay, largely irrespective of type of crossing. He found that the relationship between delay and those noticing delay could be expressed as follows:
% noticing delay = 23.7 + 38.8 log (delay in seconds)
significant change in the proportion noticing. In short, doubling the delay results in a 12 percent increase in the proportion noticing delay. The relationship differed somewhat with age, with older people in the survey noticing being delayed less then younger people.
Annoyance arising from delay was measured in terms of the numbers of people who commented adversely in terms of either impatience, difficulty in crossing or worry about the danger of crossing. Two equations were derived which identified the relationship between the percentages of people who were annoyed and delay at different types of location:
At random sites:
% annoyed = 45.7 + 1.89 mean delay (seconds)
At pelican crossings:
% annoyed = 11.8 + 1.9 mean delay (seconds)
Equations, based on the mean delays, were also derived to determine the proportions of pedestrians experiencing difficulties crossing roads at 3 different types of sites:
At random sites:
% experiencing difficulties = 26.1 + 2.1 mean delay (seconds)
At pelican crossings:
% experiencing difficulties = –13.3 + 2.0 mean delay (seconds)
At zebra crossings:
% experiencing difficulties = 10.4 + 2.6 mean delay (seconds)
Finally a series of equations were derived which showed the relationship between mean delay and the proportion of pedestrians who were worried about crossing:
At refuges:
% worried = 25.6 + 1.2 mean delay (seconds)
At pelicans:
% worried = 11.8 + 0.79 mean delay (seconds)
At zebras:
It should be noted that all of these relationships are described as being provisional, and in some cases the correlation coefficients associated with the equations are not especially high. However, the equations do seem to be some of the best estimates of such relationships presently in existence.
A study by Grayson (1975) looked at the crossing behaviour of adults and children at a sample of four sites in England. This showed substantial differences in the crossing behaviour of children and adults. In terms of mean kerb delay, children generally were delayed for longer than adults. There was also a substantial difference in the delay at the kerb when there were no vehicles present between adults and children. In general children waited for longer periods than adults, even when no vehicle was present.
It is important to note one feature of the various delay studies. They cannot observe changes in pedestrian behaviour caused by the delay. This was noted by Goldschmidt:
[Waiting] cannot be seen in isolation from the individuals affected, nor from the alternative actions available to the pedestrian. A pedestrian trying to cross the road, but unable to do so immediately, may either wait at the kerbside until the road is clear, or he may walk along the kerb, continuously looking for a gap in the traffic, and then cross without stopping. Alternatively, he may decide to walk to a pedestrian crossing before attempting to cross. In extreme cases, he may adjust his route to avoid crossing the road altogether.
Observations in the Bradford experimental situation were carried out to collect more information on red light violation and delay times. From the same set of video observations as used for the crossing behaviour in pelican zones, the light setting and delay time was recorded for those who crossed on the pelican. This information was obtained for 106 of the 128 individuals who used the crossing. The light setting was observed from down the road and thus it was the vehicle light setting that was observed; the pedestrian setting was deduced from the vehicle setting. The overall distribution of crossings by light setting is shown in Table 6. From the table it can be observed that, among those who crossed on the pelican, there was a very low rate of red-light violation (only 9.4 percent overall). Of the violators, three people crossed while the vehicle light was green, while 7 crossed when the vehicle light was amber, i.e. about to change to red. This latter group of red-light violators might be termed “early walkers” in that they cross when the pedestrian light is just at the point of turning green. It is interesting to note that the mean delay of 12.7 seconds experienced by this group is considerably longer than the 3.4 seconds experienced by those who crossed when the vehicle light was green, although given the small number of observations these results should be treated with caution. Another interesting result is the delay time for those who cross when the pedestrian signal flashing green. They seems to consist in the main of delayed crossers rather than late arrivals and have the highest mean delay time of any group.
Table 6: Crossings at the pelican by light setting
Light for Light for Mean
Red Green 76 71.7 11.4
Flash. amber Flash. green 20 18.9 22.2
Green Red 3 2.8 3.4
Amber Red 7 6.6 12.7
Looking at the light setting by sex in Table 7, it can be seen that there is little difference in the rate of red-light violation by sex. There is a substantial difference, however, in the proportion of males and females who set out on flashing green: females are far more likely to do this than males.
[image:32.595.72.443.96.156.2]Table 8, showing the light setting by age group, indicates that those who set out on flashing green are predominantly children. The delayed crossers are therefore mainly female and mainly children.
Table 9 indicates that a higher proportion of pedestrians cross with a green light during the peak period as compared to the off-peak period. The delayed crossing phenomenon occurs almost entirely during the off-peak period.
Table 7: Crossings at the pelican by light setting and sex
Light Males Females
for pedestrians N Col% N Col%
Green 34 81.0 32 59.3
Flashing green 1 2.4 19 35.2
Red 7 16.7 3 5.6
Table 8: Crossings at the pelican by light setting and age
Light 0–12 13+
for pedestrians N Col% N Col%
Green 39 73.6 34 68.0
Flashing green 14 26.4 6 12.0
Red 0 0.0 10 20.0
Table 9: Crossings at the pelican by light setting and peak/off-peak
Light for peak off-peak
pedestrians N Col% N Col%
Green 40 83.3 36 62.1
Flashing green 1 2.1 19 32.8
8.4.5 Gap acceptance
Very little work exists on pedestrian gap acceptance. The only study of note is Wilson and Grayson (1980) who used as their measure of gap acceptance the amount of time each pedestrian had to spare over an approaching vehicle (a value they called the `safety gap'). They found that the range of safety gap values was considerable and hence only examined the incidence of small safety gaps of less than 2 seconds duration. Their results showed that male pedestrians had higher proportions of safety gaps under 2 seconds than female pedestrians. No significant trends in age were found. They conclude that small safety gaps may not be reliable indication of dangerous crossing manoeuvre, and may even be a reflection of skill in the crossing task. They also conclude that gap acceptance measures by themselves do not appear a particularly fruitful area for further research, and a more detailed analysis of pedestrian/vehicle interaction would seem preferable.
The gap acceptance observation study was carried out at one of the junctions in the Bradford experimental situation. The video tapes were analyzed for gaps following the standard project formula and using a stop watch to obtain the timings. The video information covered a period of 7 hours 50 minutes over a period of four days. The total number of crossings recorded was 236, of which 160 were at the light (i.e. in front of the stop line), 60 were not at the light (i.e. behind the stop line and within 20 metres of it) and 16 were partially at the light.
Gap acceptances were only analyzed when the traffic was not stopped by a red light. Thus of the 160 crossings at the light, only the 19 that took place when the light was not red on the road crossed were included. Of the 76 other crossings, 41 were from the west side to the east side of the junction, when the lights were red, i.e. the first half of the crossing was over a lane that was stopped for the red light. The crossing of the first lane by this group was not analyzed, since the traffic was theoretically held for the light. Finally all cases with no gap recorded or a gap of more than 8 seconds were deleted (it was assumed that, if a gap were greater than 8 seconds, there was no approaching traffic). This left a total of 13 gaps in the first half of the road and 33 gaps in the second half. The average gap in the first half of the road was 3.21 seconds with a minimum of 0.07, and the average gap in the second half was 2.90 seconds with a minimum of 0.12. The two very small gaps are from the same individual. The average gap by sex (all gaps) was as follows:
Males: 3.30 seconds (N=27)
Females: 2.54 seconds (N=19)
Thus women appear to have a slightly lower average gap. Looking at gap by age, the distribution of average gap was:
0-12: 2.30 seconds (N=4)
13-59: 3.02 seconds (N=36)
60+: 3.23 seconds (N=6)
The average gaps by peak/off-peak were as follows:
Peak: 3.50 seconds (N=37)
Off-peak: 2.86 seconds (N=9)
8.4.7 Rule compliance by vehicles
There is a substantial body of literature on the amount and type of violations by vehicles at traffic signals. However, no literature has been found which reports on the way in which pedestrians and road traffic interact in priority situations.
8.5 PEDESTRIAN AND PEDAL CYCLIST BEHAVIOUR IN GRONINGEN J.M. Spikman and E.J. Westra
8.6.1 Red light violation Pedestrians
Because there are no pedestrian lights in the Groningen experimental area, a field study concerning pedestrian red light violation could not be carried out. However, the literature provides some figures about the Dutch situation. An extensive study by Oude Egberink and Rothengatter (1984), carried out on 32 locations in eight Dutch cities, yielded a percentage “green walkers” of 71 percent and a percentage “red walkers” (related to the number of pedestrians arriving at red) of 45 percent, which means that averaged over all the observed locations almost half of the pedestrians arriving at red do not wait for green.
Pedal cyclists
An investigation which was carried out in seven Dutch cities on different kinds of intersections (BGC, 1988), revealed that red light violation is highest on crossings where cyclists ride parallel to the main traffic stream (22-35%), and considerably lower when cyclists have to cross the main traffic direction (3-7%). The average for all types of intersections was 15 percent. An earlier study (BGC, 1984) showed that red light violation varies in different Dutch cities, ranging from 5 percent (Enschede) to 31 percent (Amsterdam). Van Dooren found in his study (1985) an average percentage of 52 percent for Amsterdam. These figures show the importance of local characteristics and intersection design on red light violation.
In addition to the literature data, a small field study on red light violation of pedal cyclists was carried out. Video recordings were made on all six locations where there are traffic lights in the experimental area. At two locations a one-hour survey in a peak period and a one-hour survey in an off-peak period were carried out: a traffic light in the main road (see Figure 2) and the connected traffic light on the bridge. The recordings of these two locations were made with a time coder connected to the video equipment, with the purpose determining gaps accepted by people who violate the red lights in the main road. On each of the four other locations, registrations were made for a quarter of an hour, both in a peak and an off-peak period without a time coder.
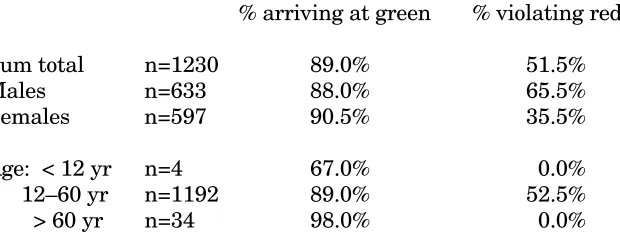
Table 10:Pedal cyclists' red light violation at the bridge (2 traffic lights) in a peak period (total observation time: 75 min.)
% arriving at green % violating red
Sum total n=1230 89.0% 51.5%
Males n=633 88.0% 65.5%
Females n=597 90.5% 35.5%
Age: < 12 yr n=4 67.0% 0.0%
12–60 yr n=1192 89.0% 52.5%
> 60 yr n=34 98.0% 0.0%
Table 11:Pedal cyclists' red light violation at the bridge (2 traffic lights) in an off-peak period (total observation time: 75 min.)
% arriving at green % violating red
Sum total n=644 89.0% 48.5%
Males n=312 88.0% 48.5%
Females n=332 89.5% 49.0%
Age: < 12 yr n=5 80.0% 0.0%
12–60 yr n=597 88.5% 48.5%
> 60 yr n=42 95.5% 50.0%
Table 12:Pedal cyclists' red light violation in the “not bridge” situations (4 traffic lights) in a peak period (total observation time: 105 min.)
% arriving at green % violating red
Sum total n=1418 31.5% 27.7%
Males n=762 30.7% 34.2%
Females n=656 31.0% 17.7%
Age: < 12 yr n=7 0.0% 16.5%
12–60 yr n=1371 32.7% 28.0%
Table 13:Pedal cyclists' red light violation in the “not bridge” situations (4 traffic lights) in an off-peak period (total observation time: 105 min.)
% arriving at green % violating red
Sum total n=570 30.7% 42.0%
Males n=297 32.0% 45.2%
Females n=273 28.7% 38.5%
Age: < 12 yr n=0 – –
12–60 yr n=542 31.2% 41.7%
> 60 yr n=28 21.0% 28.2%
Because the traffic lights on the bridge are connected to lights in the major road, the numbers of cyclists arriving in the green stage are very high both in peak and off-peak periods: almost 90 percent. About 50 percent of the cyclists arriving during the red stage violate the light. For the remaining four locations, the averaged percentage of cyclists arriving in the green stage is both in peak and in off-peak periods about 30 percent. During peak hours, red light violation is less (28%) than during off-peak hours (42%), when averaged over the four locations.
Because of the very small number of people in the age categories <12 yr and >60 yr, the conclusions about these age groups must be treated carefully. On the average older pedal cyclists seem to violate the light less often than 12 to 60 year old pedal cyclists. This finding is confirmed by the literature, which reports a higher safety-mindedness among the elderly (e.g. Brouwer, 1988). During off-peak hours, red light violation seems to be about the same for both genders, but during peak hours there are about twice as many men as women who violate the red light.
8.6.3 Gap acceptance Pedestrians
No relevant literature was found. In a small field study pedestrians were observed at two types of locations in the experimental area: a midblock crossing and a zebra-crossing on a non-signalized junction. On both locations video recordings were made for one hour during a peak period and one hour during an off-peak period. All recordings were made with a time coder connected to the video equipment, so a time signal would be visible on the video screen.
Table 14: Median gaps (sec.) of pedestrians at a non-signalized zebra crossing
First lane Second lane
Sum total 3.14 (n=92) 1.56 (n=105)
Male total 3.72 (n=50) 2.02 (n=54)
Female total 2.96 (n=42) 1.52 (n=51)
Peak total 3.28 (n=49) 1.40 (n=56)
Males 4.12 (n=28 1.78 (n=30)
Females 2.92 (n=21) 1.20 (n=26)
Off-peak total 3.12 (n=43) 2.16 (n=49)
Males 2.84 (n=22) 2.40 (n=24)
[image:39.595.86.375.347.517.2]Females 3.12 (n=21) 2.16 (n=25)
Table 15:Median gaps (sec.) of pedestrians at midblock crossing without pedestrian facilities
First lane Second lane
Sum total 2.64 (n=72) 2.54 (n=76)
Male total 2.68 (n=41) 2.80 (n=49)
Female total 2.60 (n=31) 1.84 (n=27)
Peak total 3.36 (n=35) 3.10 (n=34)
Males 3.24 (n=16) 2.96 (n=27)
Females 3.88 (n=19) 3.24 (n=17)
Off-peak total 2.28 (n=37) 1.38 (n=32)
Males 2.24 (n=25) 1.66 (n=22)
Females 2.50 (n=12) 1.20 (n=10)
Pedal cyclists
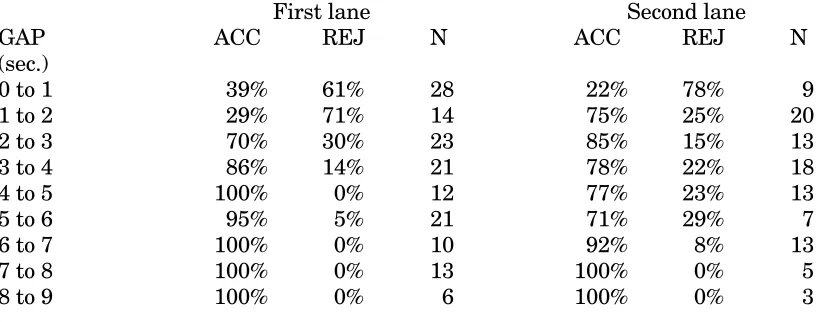
[image:40.595.73.484.320.481.2]In a study by Top and Timmermans (1987), gap acceptance of cyclists was investigated. Their definition of accepted gap differed from the one used in this study, because they computed the time difference between the moment the cyclist passed the crossing line with the approaching vehicle and the moment the approaching vehicle passed this line. They also computed rejected gaps, when a cyclist decided not to cross the street when there was approaching traffic. To do this they computed the velocity with which the cyclist approached the street to cross, computed the moment that the cyclist would have reached the crossing line with that velocity and the moment that the approaching vehicle passed that line. The difference between these two moments was the rejected gap and could, contrary to the accepted gap, be a negative value. Table 16 shows percentages of cyclists who accept and reject a given gap for all gaps from 0 to 9 seconds, both for first and second lane crossing.
Table 16:Pedal cyclists' accepted and rejected gaps (from: Top and Timmermans, 1987)
First lane Second lane
GAP ACC REJ N ACC REJ N
(sec.)
0 to 1 39% 61% 28 22% 78% 9
1 to 2 29% 71% 14 75% 25% 20
2 to 3 70% 30% 23 85% 15% 13
3 to 4 86% 14% 21 78% 22% 18
4 to 5 100% 0% 12 77% 23% 13
5 to 6 95% 5% 21 71% 29% 7
6 to 7 100% 0% 10 92% 8% 13
7 to 8 100% 0% 13 100% 0% 5
8 to 9 100% 0% 6 100% 0% 3
The gap that is accepted by 50 percent of the cyclists is between 2 and 3 seconds for the first lane and for the second lane between 1 and 2 seconds. However, gaps longer than 3 seconds are relatively more often rejected when crossing the second lane than the first lane. One of the possible explanations is that cyclists apply a different criterion at the second lane, because only one more lane has to be crossed. Another possibility is that the gap of the second lane is estimated before crossing the first lane, so that the estimate is less accurate.
Table 17: Median gaps (sec.) of pedal cyclists at a non signalized junction
First lane Second lane
Sum total 2.70 (n=104) 2.02 (n=38)
Male total 2.76 (n=65) 1.76 (n=25)
Female total 2.52 (n=39) 2.24 (n=13)
Peak total 2.45 (n=64) 1.70 (n=28)
Males 2.62 (n=46) 1.70 (n=20)
Females 1.96 (n=18) 1.80 (n=8)
Off-peak total 3.54 (n=40) 5.76 (n=10)
Males 3.44 (n=19) 4.44 (n=5)
Females 3.64 (n=21) 5.84 (n=5)
Table 18: Median gaps (sec.) of red violating pedal cyclists
Peak total 2.52 (n=3)
Off-peak total 2.14 (n=10)
Male total 2.52 (n=7)
Female total 1.74 (n=6)
The results indicate that pedal cyclists accept smaller gaps during peak hours than during off-peak hours. The difference is most pronounced at the second lane crossing, though the small number of observations might have distorted the gap values. During peak hours, the median gap is longer for the first lane crossing, but the opposite is true during off-peak hours. With regard to the first lane, men and women have the same median gap value, but with regard to the second lane, women seem to accept longer gaps. The median gap, accepted by cyclists who violate the red light, is shorter during off-peak hours and shorter for women. However, the number of observations is too small to draw firm conclusions.
8.6.5 Rule compliance Pedestrians
No relevant literature was found that reported the way road traffic and pedestrians interact in priority situations and whether this interaction caused unnecessary delay for the pedestrians. A small observation study was carried out to collect some data on this topic. In the Groningen situation, there are two relevant situations in which priority rules could be violated. These concerned the following rules:
Rule 2:Turning cars and other road traffic have to yield for pedestrians who are on the same road and want to cross.
Rule 4:Cars and other road traffic have to yield for pedestrians who are about to cross at a (non-signalized) zebra crossing.
Table 19:Rule compliance of road traffic towards pedestrians (Rule 2) in a peak period
The partner
The pedestrian car pedal cycle
yielded 19% 43%
slowed down but got priority 19% 0%
got priority undisturbed 62% 57%
100% (n=26) 100% (n=7)
Table 20:Rule compliance of road traffic towards pedestrians (Rule 2) in an off-peak period
The partner
The pedestrian car pedal cycle
yielded 28% 100%
slowed down but got priority 5% 0%
got priority undisturbed 67% 0%
100% (n=18) 100% (n=1)
Table 21:Rule compliance of road traffic towards pedestrians (Rule 4) in a peak period
The partner
The pedestrian car pedal cycle
yielded 15% 43%
slowed down but got priority 8% 0%
got priority undisturbed 77% 57%
100% (n=13) 100% (n=28)
Table 22:Rule compliance of road traffic towards pedestrians (Rule 4) in an off-peak period
The partner
The pedestrian car pedal cycle
yielded 40% 43%
slowed down but got priority 10% 14%
got priority undisturbed 50% 43%
With regard to pedestrians, cyclists cause more often delay than motorized vehicles, when the pedestrian has right of way. When averaged over both situations and time periods, pedestrians are in about 40 percent of the relevant encounters delayed even though they have right of way. It should be noted however, that the number of observations is small.
Pedal cyclists
A study of priority behaviour of different types of traffic participants (Advisie, 1985) yielded Table 23, which concerns the situation in which the cyclist rides on a major road and other traffic approaches from a side road (i.e. the cyclist has priority):
Table 23:Percentage of correct and incorrect application of the priority rules of different types of road users towards a cyclist (from: Advisie, 1985)
Cyclist with priority
Vehicle without Gets/takes priority Gets/takes no priority
priority (correct) (not correct)
Bus 88% 12% Car 80% 20%
Moped 63% 37%
Bicycle 56% 44%
All 72% 28%
This table shows that in encounters with other cyclists, the target cyclist has to yield more often, while he has priority, than in encounters with motorized traffic.
In the Groningen situation, there were two relevant rules for pedal cyclists. These were:
Rule 1:Turning cars and other turning road traffic have to yield for cyclists who go straight on, both when going in the same and in opposite direction.
Rule 2:Cars and other traffic approaching a major road have to yield for cyclists who are riding on the major road.
The results of a small field study in these situations are shown in Tables 24–27.
Table 24:Rule compliance of road traffic towards pedal cyclists (Rule 1) in a peak period
The partner
The cyclist car pedal cycle
yielded 69% 20%
slowed down but got priority 12% 0%
got priority undisturbed 19% 80%
Table 25:Rule compliance of road traffic towards pedal cyclists (Rule 1) in an off-peak period
The partner
The cyclist car pedal cycle
yielded 25% 0%
slowed down but got priority 0% 0%
got priority undisturbed 75% 100%
100% (n=4) 100% (n=7)
Table 26:Rule compliance of road traffic towards pedal cyclists (Rule 2) in a peak period
The partner
The cyclist car pedal cycle
yielded 17% 10%
slowed down but got priority 25% 0%
got priority undisturbed 58% 90%
100% (n=36) 100% (n=30)
Table 27:Rule compliance of road traffic towards pedal cyclists (Rule 2) in an off-peak period
The partner
The cyclist car pedal cycle
yielded 18% 22%
slowed down but got priority 12% 11%
got priority undisturbed 70% 67%
100% (n=17) 100% (n=9)
8.7 PEDESTRIAN AND PEDAL CYCLIST BEHAVIOUR IN VÄXJÖ M. Draskòczy
8.8.1 Red light violation Pedestrians
Garder (1982) made a study at 38 intersections in 15 different towns in Sweden and developed a model of the influence of different intersection-related factors on pedestrian red light violation. The model looks as follows:
R = 9.8 T + 0.79 B + 5.4 O - 9.3 G + 8.2 FG - 4.8 FR + 0.017 V + 4.0 S + 8.8 A – 3.9
where
R =the percentage of red walkers among the pedestrians who arrive on red T =town size, T=1 if population < 30,000
T=2 if 30,000 < population > 200,000
T=3 if Malmö (240,000 inhabitants)
T=4 if Gothenburg (440,000 inhabitants)
T=5 if Stockholm (660,000 inhabitants)
B =street width in meters
O =presence of refuge 0 if refuge is lacking
1 if refuge exists
G =number of pedestrians per hour on the zebra/1000
FG =number of cars per hour that pass the zebra during the green time of the pedestrian signal (mostly turning cars)/1000
FR =number of cars per hour that pass the zebra during the red time of the pedestrian signal/1000
V =red time in seconds at the pedestrian signal during a cycle S =signal characteristic 1 if fixed-time signal
2 if vehicle actuated
A =push-button 1 if push-button use is needed for pedestrians to get green
0 else.
The following factors were also tested: weather, centrality of the intersection and if the intersection had scramble or not. None of these factors had any influence on the number of red walkers.
A short field study was made at one of the traffic light controlled junctions in the Växjö experimental location. Video registrations were made during one hour at a peak and one hour at an off-peak period. Peak period means lunch-time or late afternoon hours, off-peak period means early afternoon or late morning hours in the Växjö field studies. Tables 28 and 29 show the results.
Table 28:Percentage of pedestrians arriving at green and percentage of red light violators in a peak period
% arriving at green % violating red
Sum total n=311 59.2% 40.9%
Male total n=145 60.0% 53.5%
Female total n=166 58.4% 30.5%
Male < 12 yr n=3 100.0% —
12–60 yr n=139 59.0% 54.4%
> 60 yr n=3 66.6% 0.0%
Fem. < 12 yr n=1 100.0% 0.0%
12–60 yr n=155 58.1% 32.2%
> 60 yr n=10 60.0% 0.0%
Table 29:Percentage of pedestrians arriving at green and percentage of red light violators in an off-peak period
% arriving at green % violating red
Sum total n=217 52.1% 44.2%
Male total n=79 49.4% 45.1%
Female total n=138 53.6% 43.7%
Male < 12 yr n=2 100.0% —
12–60 yr n=67 50.7% 45.4%
> 60 yr n=10 30.0% 42.9%
Fem. < 12 yr n=1 0.0% 100.0%
12–60 yr n=122 55.7% 46.3%
> 60 yr n=15 40.0% 22.2%
Table 30:Percentage of pedestrians arriving at green and percentage of red light violators in a peak period
% arriving at green % violating red
Sum total n=155 14.2% 66.9%
Male total n=69 13.1% 68.3%
Female total n=86 15.1% 65.7%
Male < 12 yr n=6 33.3% 50.0%
12–60 yr n=61 11.5% 70.4%
> 60 yr n=2 0.0% 50.0%
Fem. < 12 yr n=2 100.0% —