under multiple inputs
.
White Rose Research Online URL for this paper:
http://eprints.whiterose.ac.uk/797/
Article:
Lang, Z.Q. and Billings, S.A. (2000) Evaluation of output frequency responses of nonlinear
systems under multiple inputs. IEEE Transactions on Circuits & Systems II: Analog &
Digital Signal Processing, 47 (1). pp. 28-38. ISSN 1057-7130
https://doi.org/10.1109/82.818892
[email protected] https://eprints.whiterose.ac.uk/ Reuse
Unless indicated otherwise, fulltext items are protected by copyright with all rights reserved. The copyright exception in section 29 of the Copyright, Designs and Patents Act 1988 allows the making of a single copy solely for the purpose of non-commercial research or private study within the limits of fair dealing. The publisher or other rights-holder may allow further reproduction and re-use of this version - refer to the White Rose Research Online record for this item. Where records identify the publisher as the copyright holder, users can verify any specific terms of use on the publisher’s website.
Takedown
If you consider content in White Rose Research Online to be in breach of UK law, please notify us by
Evaluation of Output Frequency Responses of
Nonlinear Systems Under Multiple Inputs
Zi-Qiang Lang and S. A. Billings
Abstract—In this paper, a new method for evaluating output
frequency responses of nonlinear systems under multiple inputs, defined as a sum of sinusoids of different frequencies, is developed. The method circumvents difficulties associated with the existing “frequency-mix vector” based approaches and can easily be applied to investigate nonlinear behaviors of practical systems, including electronic circuits, at the system simulation and design stages. Application of the method to the analysis of nonlinear interference and distortion effects in communication receivers is studied, and specific procedures are proposed which can be directly used in practice for this analysis.
Index Terms—Communication receivers, frequency-domain
analysis, nonlinear systems/circuits.
I. INTRODUCTION
M
OST engineering systems including electronic circuits are intrinsically nonlinear. Although measures such as differential configurations, feedback, inverse function cancella-tion, etc., are often taken to reduce nonlinear effects when prac-tical design problems are addressed, nonlinear distortion cannot usually be cancelled out completely, and it is therefore impor-tant to evaluate system behaviors to estimate how the residual nonlinearity degrades system performances.Systems such as transistor amplifiers and operational transconductance amplifier-capacitor (OTA-C) filters, which are designed to exhibit mainly linear characteristics but still possess unavoidable residual nonlinearities, can be reasonably regarded as weakly nonlinear systems [1] and can be investi-gated in the frequency domain using the Volterra series theory of nonlinear systems [1]–[5], [8], [9], [12].
The frequency-domain method of nonlinear systems based on the Volterra series theory was initially established in the 1950’s when the concept of generalized frequency response functions (GFRF’s) of nonlinear systems was introduced [7]. GFRF’s were defined as the multidimensional Fourier transformations of Volterra kernels in the Volterra series expansion of nonlinear systems which extend the frequency response function of linear systems to the nonlinear case. One of the important features of GFRF’s is associated with the description of nonlinear system output responses in the frequency domain. The frequency-domain output responses of practical systems are often directly related to physical system
Manuscript received November 13, 1998; revised September 1999. This work was supported by the U.K. Engineering and Physical Sciences Research Council. This paper was recommended by Associate Editor Y. Inoue.
The authors are with the Department of Automatic Control and Systems En-gineering, University of Sheffield, Mappin Street, Sheffield S1 3JD, U.K.
Publisher Item Identifier S 1057-7130(00)00587-5.
performances especially for electronic circuits. Therefore, analysis of the responses is important for examining system behaviors. Nonlinear effects which are likely to be expected in practice can be determined at the system design and simulation stages by evaluating and analyzing the system output frequency responses.
The multiple inputs are defined as a sum of sinusoids with different frequencies which can be used at the design and sim-ulation stage and/or laboratory testing period of systems such as communication receivers [8] to excite the systems in order to examine the system output behaviors in the frequency domain. Analysis of nonlinear systems with multiple inputs has been an important topic in the frequency-domain analysis of nonlinear systems using Volterra series theory since the 1950’s. Many the-ories and methods have been developed to address problems as-sociated with this topic [1]–[4], [8], [9] and applications of the associated theories and methods to circuit analyses can be found in [6], [8], [10], [11].
The presently available methods for analysis of nonlinear sys-tems with multiple inputs are almost all based on a concept called the “frequency-mix vector” which reveals the manner by which intermodulation frequencies are generated in nonlinear systems. Intermodulation is an important nonlinear phenom-enon which indicates that output frequency components of a nonlinear system could be much richer than the components in the input, while in the linear system case the possible output fre-quency components are exactly the same as the components in the corresponding input. Although the analyses using the “fre-quency-mix vector” can clearly interpret how output frequen-cies of nonlinear systems are produced by particular frequency mixes, the output frequency response components at frequen-cies of interest are generally difficult to evaluate in practice using associated methods. This is because the output compo-nent of a nonlinear system at a particular frequency actually de-pends on many different frequency mixes and it is generally hard to identify all frequency-mix vectors associated with these dif-ferent frequency mixes.
In the present study, the above problem which is associated with the practical evaluation of output frequency responses of nonlinear systems to multiple inputs is addressed. At first, an ex-pression for the system response is derived which can be readily used in practice to evaluate the results. Then, output frequencies of nonlinear systems under multiple inputs are analyzed and an effective algorithm is developed to determine the frequencies. The algorithm extends the concept regarding the relationship be-tween the system input and output frequencies to the nonlinear case where systems are under an arbitrary multiple input excita-tion. Based on the first and second results, a new method is then
developed to evaluate output frequency responses of nonlinear systems under multiple input excitations which provides an fective and practical means for evaluating frequency-domain ef-fects of practical nonlinear systems, including electronic circuits at the system design and simulation stages. Finally, the applica-tion of this method to the analysis of nonlinear interference and distortion effects in communication receivers is studied and spe-cific procedures are proposed which combine the method with our previously developed nonlinear system modeling and anal-ysis techniques and which can be directly used in practice for this analysis.
II. ANALYSIS OFNONLINEARSYSTEMSUNDERMULTIPLE
INPUTS
Systems such as transistor amplifiers and OTA-C filters which possess weak nonlinearities can be described by a Volterra series representation [2]–[4]. The Volterra series representation of a nonlinear system can be generally written as
(1)
where
(2)
and are system input and output, respectively, are the Volterra kernels, and is the maximum order of system nonlinearities which is finite for a wide class of nonlinear systems and input excitations [5].
Under the excitation of a multiple input defined by
(3)
where , denotes the conjugate of , and , the th-order output response of the system (1) and (2) can be described, by substituting (3) into (2), as
(4) where
(5) is the th-order GFRF of the system
evalu-ated at .
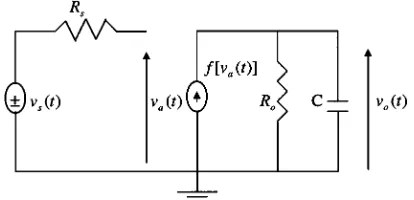
[image:3.612.324.531.63.163.2]Equations (1) and (4) provide a general description for output responses of nonlinear systems under multiple inputs. Analysis of this response can, in most cases, be sufficiently performed based on (4) to investigate the th-order portion of and
[image:3.612.40.289.299.387.2] [image:3.612.38.289.557.678.2]Fig. 1. The nonlinear equivalent circuit of an OTA-C integrator.
Fig. 2. Block diagram of the OTA-C integrator.
the total response is simply a summation of all from to .
Equation (4) indicates that when a sum of sinusoids is ap-plied to a nonlinear system, additional output frequencies are generated by the th-order portion of the system output con-sisting of all possible combinations of the input frequencies
taken at a time.
In order to illustrate this general expression, consider a prac-tical example in [6] which is an OTA with capacitor load. Fig. 1 shows the nonlinear model of the OTA-C integrator with a non-linear current source where is the characteristic function of the OTA which can be exactly determined from the circuit struc-ture and parameters [6].
It can be shown from Fig. 1 that the circuit equations in the frequency domain are given by
(6) where , , and , , are the Fourier transforms of , , and , respectively. Thus, the block diagram description of the circuit can be shown as in Fig. 2.
Representing by the Taylor series expansion about the operation point yields
(7)
where . Then
the th-order GFRF of the circuit can be obtained for as [6]
(8) Consider a case where the circuit is subject to a one-tone input, i.e., , and examine the second-order output re-sponse of the circuit to this input. In this specific situation
and
(10) Moreover, substituting (8) into (10) for yields
(11) Equation (11) indicates that the second-order response of the circuit to the one-tone input is composed of two frequency com-ponents and , which are the absolute values of the summations of the input frequencies and taken two at a time, that is
and
The specific case above is a very simple example where the output frequencies composed of all possible combinations of the input frequencies can be easily identified. For general cases where systems are subject to arbitrary multiple inputs where could be any integer, the frequency-domain analysis of nonlinear systems under multiple inputs is more compli-cated and is usually carried out based on a concept called the “frequency-mix vector” [1].
Because, under a multiple input, output frequencies generated by the th-order system nonlinearity consist of all possible com-binations of the input frequencies
taken at a time, let denote the number of times the fre-quency appears in a particular frequency mix, the frequency mix can then be represented by the vector
(12) where the ’s obey the constraint
(13) Vector is referred to as the th-order frequency-mix vector and the corresponding output frequency is given by
(14) Therefore, the output frequencies in given by (4) can be interpreted as those frequencies that can be generated by all pos-sible choices of the ’s such that (13) is satisfied.
It has been shown that the output component in (4) which corresponds to a particular frequency mix is given by [1]
(15)
where the GFRF is assumed to be symmetric in the case, for example, and denotes consecutive arguments in having the same frequency . Thus the th-order portion of can be written as
(16)
where the summation over is defined to be
and (13) appended below the summation signs indicates that only terms for which the indices sum to are included in the 2R-fold summation.
The above analysis for the th-order nonlinear output re-sponse to a multiple input clearly reflects how an output fre-quency component is produced by a particular frefre-quency mix and how the component can be evaluated using the associated frequency-mix vector.
Consider the above circuit example again but under a two-tone input. The frequencies in the second-order output re-sponse of the circuit are
with the ’s obeying the constraint
The output component corresponding to a particular can be determined using (15) where the GFRF is defined by (8) for . In this case, it is not difficult to show the associated frequency-mix vectors are
and is, therefore, the result of the summation of given by (15) over all these frequency-mix vectors.
Output frequencies corresponding to these vec-tors can be easily obtained as
Therefore, the practical output frequencies, which are the nonnegative results of the above frequencies, are and 0.
the concept of “frequency-mix vector,” this response can only be represented as
(17)
where denotes the total th-order output response at fre-quency .
From (17), it is hard to evaluate practically. This is be-cause, given a frequency of interest , it is generally a very diffi-cult job to identify all possible ’s such that . However, determining these ’s is necessary if is to be evaluated from (17). In [9], a general algorithm was proposed to address this problem which transformed the problem of identifying all possible ’s to the problem of sorting out all possible integers ’s such that . Obviously, the diffi-culties with the original method of identifying all possible ’s can not be bypassed when using this algorithm.
Motivated by the attempt to completely resolve the problem above with existing methods, a new method is proposed in Sec-tion V to provide a practical and effective strategy to evaluate the nonlinear frequency responses to multiple inputs and there-fore to investigate possible nonlinear behaviors of systems in the frequency domain. The derivations and analyses in Sections III and IV establish the important and necessary basis for this new method.
III. EXPRESSION FOR THEOUTPUTFREQUENCYRESPONSES
When a nonlinear system described by (1) and (2) is excited by a multiple input (3), the system th-order nonlinear output is generally given by (4), which can be rewritten as
(18) where is defined by
if
otherwise. (19) In order to obtain a more transparent frequency-domain to time-domain relationship, consider
(20) where the * denotes conjugation, and write (18) as
(21)
where
(22)
In (21) and (22)
denotes the summation of
over all the which satisfy the constraint with
defined by (22) is the th-order output frequency re-sponse of the system (1) and (2) to the input (3) in terms of nonnegative frequencies, which represents the contribution of the th-order system nonlinearity to the output frequency com-ponent .
Substituting (21) into (1) gives
(23)
where
(24)
So, the output frequency response of a nonlinear system under a multiple input is given, in terms of nonnegative frequencies, by
(25) Notice that the relationship between the system output fre-quency spectrum and is
(26)
It can be observed from (25) that the possible output frequen-cies in the th-order nonlinear output are
with
This clearly reflects how the output frequencies are composed in this situation. In addition, from the definition of
the terms which compose the th-order output frequency com-ponent can be readily identified. Therefore, the evalu-ation of and, moreover, of the total frequency response can easily be achieved using (25). This is because the evaluation of can be simply implemented in the fol-lowing way
(27) where for , for , and the terms in which
are zeros according to the definition of given by (19), and, moreover, can be obtained by just making a summation of the results determined from (27) from to .
In order to illustrate how to evaluate using the above idea, consider an example where the OTA-C circuit in Section II is excited by a two-tone input and the second-order output frequency response of the circuit at fre-quencies and is to be examined.
In this case,
if otherwise and the second-order GFRF
Therefore
(28) Thus and can be immediately obtained as
and
and the corresponding output components are therefore
and .
Clearly, compared to the evaluation of an th-order output re-sponse at a particular frequency using (17), the computation of this response based on (25) is much more straightforward and the difficulty with determining all possible frequency-mix vec-tors for a specific frequency, which is necessary when (17) is used, is circumvented. Notice that the expression for
given in (25) or (27) accommodates all possible terms which could make contributions to frequency and, when given a spe-cific value of , the terms which actually have no effect on the response at the specific frequency automatically become zero due to the definition of .
The analyses and examples above indicate that based on (25) the output frequency responses of nonlinear systems under mul-tiple inputs can easily be evaluated at any frequencies of in-terest. However, it is obviously unnecessary to evaluate the re-sponse components at frequencies which are beyond the range of system output frequencies since these components are def-initely zero. To address this issue involves determining pos-sible output frequencies of nonlinear systems subject to multiple input excitations.
IV. DETERMINATION OF THEOUTPUTFREQUENCIES
For linear systems, it is well known that the possible output frequencies are exactly the same as the frequencies in the corresponding input. However, this property does not hold if the system is nonlinear. When a nonlinear system is subject to a multiple input, it has been shown from the analyses in previous sections that output frequencies generated by the th-order system nonlinearity consist of all possible combinations of the input frequencies taken at a time. This result can be analytically described as a set given by
(29) The problem to be addressed initially here is to develop an algorithm to determine the frequencies composed of the non-negative part of the result given by (29).
For the simplest case of , it is obvious that these fre-quencies are , which can be rewritten in a vector form as
..
. ... (30)
where
and denote the summation of the elements in the th-row of matrix .
The output frequencies in the case of can be deter-mined from
..
. (32)
Define two vectors
(33) of length 2R and
(34) to express (32) in terms of a vector as
(35) where
..
. ... (36)
For , it is easy to show that the vector representing the output frequencies produced by the third-order nonlinearity is
(37) where
..
. ... (38)
Consequently the algorithm for computing the vector repre-senting the (nonnegative) frequencies in the th-order nonlinear output is given by
.. .
..
. ...
(39)
Many of the elements in may be the same. Therefore, the final result of this algorithm is a set composed of all different elements of . Denote this set as , then
(40) where means a set composed of all the different ele-ments of vector .
In order to illustrate the application of this algorithm, consider an example where and the frequencies in the second-order nonlinear output is to be determined.
In this case,
, therefore .
From the above algorithm, can be determined for any . Therefore, the frequencies in the system output represented by
can be obtained as .
However, there is actually no need to obtain all ’s and then to determine as shown above. This is because, for any , there is a deterministic relationship between the frequen-cies in the th-order nonlinear output and the frequenfrequen-cies in the
th-order nonlinear output. It can be shown from (39) that
(41) where
..
. ... ... ... .. .
and
Similarly
(42) Substituting (42) into (41) yields
(43) In the matrix given by (43), the first matrix block takes the form
.. .
the second matrix block takes the form
.. .
(45) and the third takes the form
.. .
(46) It is not difficult to observe from (43)–(46) that the elements of vector
include all elements of vector
This implies that that is
(47) or all frequencies in the th-order nonlinear output are present in the th-order nonlinear output.
This conclusion was proved before [9] under the assumption that form a frequency base which means there does not exist a set of rational numbers (not all zero) such that . Since no assumptions are made on in the above derivation, the conclusion has now been established for arbitrary input frequencies.
It is straightforward from (47) that the frequencies in the system output
(48) where the value to be taken by could be
where [.] denotes to take the integer part. The specific value of depends on the system nonlinearities. If the system GFRF’s
for , and , then .
In the example above, where a nonlinear system is subject to a two-tone input with , assume that the maximum
nonlinear order and the first-order frequency-response function . It is straightforward to show that in this case . Therefore, the output frequencies of the system can be determined using (48) as
Equations (39), (40), and (48) compose an algorithm for de-termining output frequencies of nonlinear systems under mul-tiple inputs. This result actually extends the relationship be-tween the input and output frequencies of linear systems to the nonlinear case when the systems are subject to multiple inputs and is therefore also of theoretical significance.
V. NEWMETHOD FOREVALUATINGNONLINEAROUTPUT
FREQUENCYRESPONSES TOMULTIPLEINPUTS
It has been shown in Section III that, based on (25) output components of nonlinear systems under multiple inputs at any frequencies of interest can be readily evaluated. Equations (39), (40), and (48) derived in Section IV provide an effective al-gorithm for determining possible output frequencies of non-linear systems in this situation. Based on these two results, a new method is proposed below to evaluate nonlinear output fre-quency responses to multiple input excitations.
The basic idea of this new method is to determine all possible system output frequencies and the frequencies contributed by each order of system nonlinearities using the algorithm derived in Section IV. Thus, if the frequencies of interest are beyond the range of possible output frequencies, it is known immediately that the output responses at these frequencies are zero. If the frequencies of interest are within the range of possible output frequencies then the frequencies contributed by each order of system nonlinearities provide important information concerning which order of system nonlinearities could make a contribu-tion to these frequencies of interest. Moreover, system output responses at the frequencies of interest are evaluated using (25) and the computation is implemented by first calculating the re-sponses at these frequencies contributed by the nonlinear or-ders which really make contributions to these frequency com-ponents, and then simply making a summation of the results ob-tained for corresponding nonlinear orders.
A summary of the new method, which requires the fre-quency-domain model of the considered nonlinear system, i.e. the GFRF’s, , , to be known
a priori, is given below.
1) Calculate all possible output frequencies using (39), (40) and (48) to yield the set .
2) For , calculate to determine a set which is composed of the numbers of the nonlinearity orders which have contributions to the output frequency at which the output component is to be evaluated. 3) Compute as below
where
(50) and
if
otherwise.
4) Evaluate the output response at frequency as (51) The example of the OTA-C circuit in Section I is considered again to illustrate the application of this method in the following. Assume that can be approximated sufficiently well by a third-order polynomial , where , for , and the output response of the circuit to the multiple input
at the frequency of interest is to be evaluated.
The GFRF’s of the circuit system are given by (8). They are all zero in this case for , but not zero for be-cause can be approximated well by a third-order poly-nomial and , for . Obviously the maximum order of system nonlinearities in this case is . Because
, . Thus, using (39), (40) and (48) with and
yields indicating that belongs to the frequencies which possibly appear in the system output.
obtained using (39) and (40) in this case, are . So for the frequency of interest .
Using (50) and considering that in this specific case,
if otherwise
it follows that
Thus, in this case, the output response component of the cir-cuit at is
The method developed and illustrated above provides an effective means for evaluating the output frequency responses of nonlinear systems under multiple inputs based on the system frequency-domain descriptions. Exact evaluation of system output frequency responses can only be achieved using both system models and exact knowledge of the corresponding input spectra. Multiple input signals can easily be generated with all parameters of the signals under control. Methods are currently available for estimating the GFRF’s of nonlinear systems [13]–[15] and for systems such as some electronic circuits the GFRF’s can even be derived directly from the system structure and parameters. Therefore, this method can, hopefully, be widely applied to analyze nonlinear behaviors of practical systems including electronic circuits at the system/circuit design and simulation stages. The application to nonlinear analysis of communication receivers will be discussed in the next section to demonstrate how to use this method in practical system analysis.
VI. ANALYSIS ONNONLINEARINTERFERENCE AND
DISTORTIONEFFECTS INCOMMUNICATIONRECEIVERS
In communication systems, the modulated information signal from a transmitter is transmitted to a receiver where the signal is amplified and the information extracted. A simplified block diagram of a superheterodyne receiver is illustrated in Fig. 3. The block diagram of receivers in modern radio communication systems are essentially the same as this [16].
Ideally, when the receiver input consists of signals from many communication channels, tuning the receiver to the carrier fre-quency of a channel by changing the frefre-quency of the local oscil-lator could allow only the information from the selected channel to be eventually recovered at the detector stage. However, this is correct only when the amplifier and intermediate frequency filter in the receiver are made up of ideal linear circuits, which is impossible in practice.
Fig. 3. A simplified block diagram of a superheterodyne receiver.
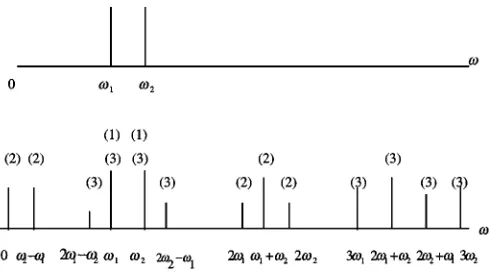
Fig. 4. The input and output frequency components of an amplifier possessing nonlinearities up to the third-order (the numbers in the curved brackets indicate the nonlinear orders which produce the corresponding frequency components).
Analysis of the effects of circuit nonlinearity on communi-cation receivers was previously carried out based on theories of nonlinear circuit analysis and using the “frequency-mix vector” approach developed from the Volterra series theory of nonlinear systems [1], [8]. The nonlinear circuit analysis was applied to establish the nonlinear frequency-domain model of the receiver circuits to be analyzed and the “frequency-mix vector” approach was then used to evaluate and analyze the output frequency re-sponses of the circuits to multiple inputs. There are two disad-vantages to this approach. The first is that a complete and exact theoretical modeling for nonlinear circuits is usually impossible due to the fact that parameters of some devices may not be avail-able and the second is associated with the problems of the “fre-quency-mix vector” approach which were discussed in Section II.
Based on the method in Section V and nonlinear system iden-tification and frequency-domain analysis techniques developed by the authors, a different approach is proposed in the following to implement the analysis of frequency responses of nonlinear circuits in communication receivers. This approach can be ap-plied at the design and testing stages to examine the effects of nonlinear interference and distortion on the receiver perfor-mance.
Application to Analysis of Nonlinear Effects in Communication Receivers
1) Establish a nonlinear difference model of the amplifier and filter circuit of the receiver to be analyzed using the Nonlinear AutoRegressive Moving Average model with exogenous inputs (NARMAX) methodology [18]–[19] and the input and output data from an experiment on the circuit in a prototype of the receiver. NARMAX
methodology includes effective nonlinear system mod-eling techniques developed by Billings and coworkers which involve methods for model structure selection, parameter estimation, and model validation and can be used to produce a nonlinear difference model referred to as nonlinear autoregressive with exogenous input (NARX) model without using any prior knowledge of the identified system.
The polynomial NARX model of a nonlinear system can be expressed as follows:
where is a “ th-order output” given by
with and
. is the maximum lag and , , and are the output, input, and model coefficients, respectively.
A specific NARX model such as, for example
may be obtained from the above general form with
, , ,
, ,
else .
[image:10.612.45.290.187.323.2]where
For the specific NARX model above, for example, the mapping can be readily obtained from the general rela-tionship as
Notice that the above procedure shows how to obtain the GFRF’s of the discrete time model of a nonlinear cir-cuit. If the frequency-domain description of the contin-uous time model of the circuit is required, the results are essentially the same as the results obtained for the discrete time model.
3) Determine the maximum order of nonlinearities in the circuit using the method in [20] concerning truncation of the Volterra series expansion of nonlinear systems. But for the above simple specific NARX model, it is clear that
.
4) Evaluate the output frequency response of the circuit to a multiple input using the method in Section V to examine the nonlinear effects on the performance of the commu-nication receiver. This involves the following steps.
a) Select the frequencies and corre-sponding magnitude and phase for the multiple input to be applied. These frequencies could, for example, be the carrier frequencies of the different communication channels associated with the re-ceiver which is to be analyzed.
b) For , determine the frequency set , which contains output frequencies contributed by the th-order circuit nonlinearity, using the al-gorithm given by (39) and (40), and then determine a set which is composed of the numbers of the
nonlinearity orders that have contributions to the output frequency with . The specific value of here depends on which communication channel is required to be analyzed for nonlinear interference and distortion.
c) Evaluate
where is evaluated using (50) to examine the nonlinear interference effect on the commu-nication channel associated with the carrier fre-quency . Notice that the complete output com-ponent at frequency is given by
where the first term represents the linear output re-sponse of the circuit to the multiple input at fre-quency , which, without nonlinear interference and distortion reflected by the second term, should be the output frequency response of the circuit to the signal channel associated with the carrier fre-quency .
These procedures can be readily coded and implemented such that the new approach can be directly applied for the interference and distortion analysis of communication receivers at the design and testing stages.
In engineering, two-tone ( ) tests are commonly used to experimentally quantify the degree of nonlinearity of a non-linear communication system or device. It is obvious that the new approach can be readily applied to perform the same ysis. In addition to this, the new approach also allows the anal-ysis to be easily implemented when the system is subject to a arbitrary ( ) tone sinusoidal excitation so as to be able to accommodate complicated but more practical situations, which is impossible to be analyzed based on simple experi-mental studies.
VII. CONCLUSION
existing “frequency-mix vector” based approaches and provides an effective means to investigate nonlinear behaviors of prac-tical systems including electronic circuits at the system design and simulation stages. The application of the method to non-linear analysis of communication receivers has been studied and specific procedures are proposed which can be directly used in practice for this application.
ACKNOWLEDGMENT
The authors wish to express their thanks to the referees for valuable comments and suggestions.
REFERENCES
[1] D. D. Weiner and J. F. Spina, Sinusoidal Analysis and Modeling of
Weakly Nonlinear Circuits. New York: Van Nostrand, 1980. [2] I. W. Sandberg, “The mathematical foundations of associated
expan-sions for mildly nonlinear systems,” IEEE Trans. Circuits Syst., vol. CAS–30, pp. 441–455, July 1983.
[3] , “A perspective on system theory,” IEEE Trans. Circuits Syst., vol. CAS–31, pp. 88–103, Jan. 1984.
[4] , “Existence and evaluation of almost periodic steady-state responses of mildly nonlinear systems,” IEEE Trans. Circuits Syst., vol. CAS–31, pp. 689–701, Aug. 1984.
[5] , “Uniform approximation with doubly-finite Volterra series,” IEEE
Trans. Signal Processing, vol. 40, pp. 1438–1442, 1992.
[6] S. Szczepanski and R. Schaumann, “Nonlinearity-induced distortion of the transfer function shape in high-order OTA-C filters,” Analogue
Inte-grated Circuits and Signal Processing, vol. 3, pp. 143–151, 1993.
[7] D. A. George, “Continuous nonlinear systems,” M.I.T. Res. Lab. Elec-tron., Cambridge, MA, Tech. Rep. 335, 1959.
[8] J. Bussgang, L. Ehraman, and J. Graham, “Analysis of nonlinear systems with multiple inputs,” Proc. IEEE, vol. 62, pp. 1088–1119, Aug. 1974. [9] L. O. Chua and C. Y. Ng, “Frequency domain analysis of nonlinear
sys-tems: General theory,” Inst. Elect. Eng. J. Electron. Circuits Syst., vol. 3, pp. 165–185, 1979.
[10] L. O. Chua and C. Y. Ng, “Frequency domain analysis of nonlinear sys-tems: Formulation of transfer functions,” Inst. Elect. Eng. J. Electron.
Circuits Syst., vol. 3, pp. 257–269, 1979.
[11] S. Szczepanski and R. Schaumann, “Effects of weak nonlinearities in transconductance capacitor filters,” in Proc. IEEE Int. Symp. Circuits
and Systems, 1989, pp. 1055–1058.
[12] S. Boyd and O. Chua, “Fading memory and the problem of approxi-mating nonlinear operators with Volterra series,” IEEE Trans. Circuits
Syst., vol. CAS–32, pp. 1150–1161, Nov. 1985.
[13] K. I. Kim and E. J. Powers, “A digital method of modeling quadratically nonlinear systems with a general random input,” IEEE Trans. Acoust.,
Speech, Signal Processing, vol. ASSP–36, pp. 1758–1769, Nov. 1988.
[14] J. C. Peyton-Jones and S. A. Billings, “A recursive algorithm for com-puting the frequency response of a class of nonlinear difference models,”
Int. J. Control, vol. 50, no. 5, pp. 1925–1940, May 1989.
[15] S. W. Nam and E. J. Powers, “Application of higher order spectral anal-ysis to cubically nonlinear system identification,” IEEE Trans. Signal
Processing, vol. 42, pp. 1746–1765, July 1994.
[16] J. Smith, Modern Communication Circuits. New York: McGraw-Hill, 1986.
[17] I. J. Leontaritis and S. A. Billings, “Input–output parametric models for nonlinear systems—Part I: Deterministic nonlinear systems,” Int. J.
Control, vol. 41, no. 2, pp. 309–328, 1985.
[18] S. A. Billings and S. Chen, “Extended model set, global data and threshold model identification of severely nonlinear systems,” Int. J.
Control, vol. 50, no. 5, pp. 1879–1923, 1989.
[19] , “Neural network and system identification,” in Neural Networks
for Systems and Control, K. Warwick et al., Eds. London: Peter Pere-grinus, 1992, ch. 9, pp. 181–205.
[20] S. A. Billings and Z.-Q. Lang, “Truncation of nonlinear system expressions in the frequency domain,” Int. J. Control, vol. 68, no. 5, pp. 1019–1042, 1997.
Zi-Qiang Lang was born in Shenyang, China,
in 1962. He received the B.S. degree in electrical engineering from Shenyang University, Shenyang, China, in 1984, the M.Sc. degree in electrical en-gineering from Northeastern University, Shenyang, China, in 1987, and the Ph.D. degree in control sys-tems engineering from the University of Sheffield, Sheffield, U.K., in 1997.
He was appointed a Lecturet in the Department of Automatic Control, Northeastern University, China, in 1987. Since 1997, he has been a Research Asso-ciate in the Department of Automatic Control and Systems Engineering, the University of Sheffield, U.K.. His research interests include system identifica-tion and signal processing for nonlinear systems, nonlinear system frequency domain analysis and synthesis, adaptive control theory and application, and in-dustrial system process control.
S. A. Billings was born in the U.K. in 1951. He
received the B.Eng. degree in electrical engineering (with first-class honors) from the University of Liverpool, Liverpool, U.K., in 1972, the Ph.D. degree in control systems engineering from the University of Sheffield, Sheffield, U.K., in 1976, and the D.Eng. degree from the University of Liverpool, Liverpool, U.K., in 1990.
He was appointed Professor in the Department of Automatic Control and Systems Engineering, the University of Sheffield, in 1990, and leads the Signal Processing and Machine Vision Research Group. His research interests include system identification and signal processing for nonlinear systems, time-series analysis, spectral analysis, adaptive noise cancellation, nonlinear systems anal-ysis and design, fault detection, neural networks, machine vision, and brain imaging.