i
SUPERVISOR DECLARATION
“I hereby declare that I have read this thesis and in my opinion this report is Sufficient in terms of scope and quality for the award of the degree of
Bachelor of Mechanical Engineering (Design and Innovation)”
Signature : ……….
Supervisor : Dr. Hady Effendy
ii
DESIGN AND SIMULATION
OF THREE DIMENSIONAL BENDING MACHINE
NG SZE LING
This thesis is fulfillment of the requirement for the award of Bachelor Degree in Mechanical Engineering ( Design and Innovation )
Faculty of Mechanical Engineering Universiti Technikal Malaysia Melaka
iii
DECLARATION
“I hereby declare that the work in this report is my own except for summaries and quotations which have been duly acknowledged.”
Signature : ………
Author : NG SZE LING
iv
v
ACKNOWLEDGEMENTS
This project would not be possible to carry on if without the supporters. Hence I would like to acknowledge all the people that were involve directly and indirectly while completion of the project.
First of all, I would like to thanks sincerely to my supervisor, Dr. Hady Efendy for spending his precious time in guiding me with his expertise and giving his moral support. This countless time that he spent in reflecting, encouraging, and advising patiently throughout the entire process help me a lot in finishing this project. I have learned many from him and gained my confidence from the project.
Furthermore, I would like to acknowledge and thanks to En. Wan Farid for his willingness to provide feedback and information that regarding to the project. These are very important to me in completing the research successfully. Furthermore, special thanks to the staff members especially the technicians in FASA B, FKM for allowing me to conduct my research and providing any assistance requested.
Besides that, I would like to thanks all friends for their understanding and encouragement when I facing problem. They are willing to spend the time to cheer me up and sharing ideas. Although I cannot list them all here but they are always in my mind, I appreciate it.
vi
ABSTRACT
vii
TABLE OF CONTENT
ACKNOWLEDGEMENTS ... v
ABSTRACT ... vi
1.0. INTRODUCTION ... 1
1.1. OBJECTIVES ... 2
1.2. SCOPES ... 2
1.3. PROBLEM STATEMENT ... 2
1.4. FLOW CHART ... 3
2.0. LITERATURE REVIEW ... 4
2.1. THE MECHANICS OF U-BEND DEFORMATION ... 4
2.2. BEND ALLOWANCES ... 7
2.3. STRESS AND STRAIN CONSIDERATION ... 8
2.4. SPRING BACK ... 12
2.4.1. Factors of Spring Back ... 13
2.5. BENDING MACHINES ... 14
2.6. MATERIAL ... 17
2.6.1. Material for Three-dimensional U-bending Machine ... 17
2.6.2. Material for Specimen Test ... 17
2.7. SIMULATION ... 20
2.7.1. Finite Element Method Simulation (CATIA V5) ... 20
2.7.2. Key Benefits Include In CATIA V5 ... 20
viii
3.0. METHODLOGY ... 23
3.1. GATHER INFORMATION ... 24
3.2. IDENTIFY PROBLEM ... 24
3.3. DESIGN ... 24
3.4. CONCEPTUAL DESIGN ... 25
3.5. DETAIL DESIGN ... 27
3.6. EVALUATION DESIGN ... 27
3.6.1. Objective Tree ... 28
3.6.2. House of Quality ... 29
3.7. ANALYSIS DATA FROM EXPERIMENTAL RESULT ... 31
3.8. ANALYSIS BY FEM SIMULATION ... 31
3.9. COMPARISON BETWEEN EXPERIMENTAL RESULTS AND ANALYTICAL RESULT ... 31
3.10. FEM SIMULATION ... 32
4.0. RESULT ... 34
4.1. PART DESIGN DRAWING ... 34
4.1.1. Specimen test ... 34
4.1.2. Jig Male ... 35
4.1.3. Jig Female ... 36
4.1.4. Sliding Guide ... 37
4.1.5. M8*25 Steel Hexagon Socket Head Cap Screw ... 37
4.1.6. Steel Plain Washer for 8*18.8 ... 38
4.1.7. Assembly View ... 38
4.1.8. Exploded View ... 40
4.2. RESULT OF CLASH CHECKING ON CATIA V5 ... 41
4.3. PART DESIGN FOR EXPERIMENT ... 42
ix
4.3.2. Jig Female, Sliding Guide, M8*25 Screw and Steel Plain Washer ... 43
4.3.3. Assembly View ... 43
4.3.4. Exploded View ... 44
4.4. EXPERIMENT ... 46
4.4.1. Experimental Processes ... 47
4.5. EXPERIMENTAL RESULTS ... 48
4.5.1. Summary of Experimental Results ... 48
4.5.2. Analysis of Experimental Result ... 50
4.6. ANALYTICAL RESULTS ... 52
4.6.1. Simulation by CATIA V5 ... 52
4.6.2. Analysis by CATIA V5 ... 53
4.6.3. Analytical Result ... 54
5.0. DISCUSSION ... 60
5.1. COMPARISON ... 60
5.1.1. Reasons of the Stress Increasing ... 62
5.1.2. Reasons of the Stress Decreasing ... 64
5.1.3. Reasons of the Errors ... 64
6.0. CONCLUSION ... 65
6.1. RECOMMENDATION ... 66
REFERENCES ... 67
APPENDIXES ... 70
Gantt Charts ... 74
x
LIST OF TABLES
Table 1: Bending Machines ... 14
Table 2: Properties of Stainless Steel 316L ... 19
Table 3: Morphological Chart ... 26
Table 4: House of Quality, HOQ ... 30
Table 5: Summary of Experimental Result ... 48
Table 6: Analytical Result ... 59
Table 7: Table of Experimental Results and Analytical Result ... 61
Table 8: Gantt chart for PSM 1 ... 74
xi
[image:11.595.111.528.198.789.2]LIST OF FIGURES
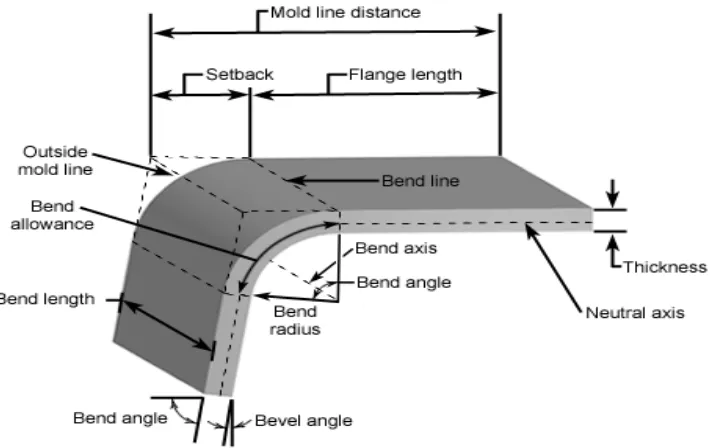
Figure 1: Sheet metal bending profile ... 1
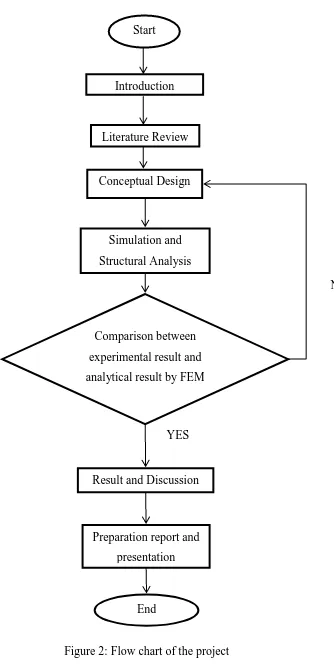
Figure 2: Flow chart of the project ... 3
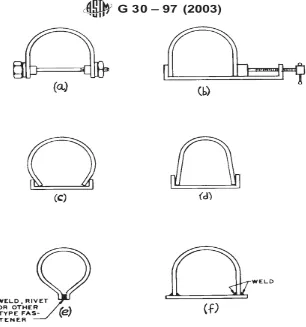
Figure 3: Typical stressed U-bending. ... 6
Figure 4: Example of typical specimen dimensions. ... 7
Figure 5: Stress profile ... 9
Figure 6: True stress-strain relationship for U-bending ... 10
Figure 7: Single stage stressing and the method. ... 11
Figure 8: Two stage stressing and method ... 12
Figure 9: Spring back ... 13
Figure 10: Air bending ... 14
Figure 11: Bottoming ... 14
Figure 12: Coining ... 15
Figure 13: Three-point Bending ... 15
Figure 14: Folding ... 15
Figure 15: Wiping ... 16
Figure 16: Rotary Bending ... 16
Figure 17: Elastomer Bending ... 16
Figure 18:Stress distribution analysis and spring back features by FEM simulation 22 Figure 19: Comparison on experiment and FEM simulation analysis. ... 22
Figure 20: Flow Chart of Methodology ... 23
Figure 21: Objective tree 1 ... 28
Figure 22: Objective tree 2 ... 29
Figure 23: Specimen’s Material Properties for CATIA V5 ... 33
Figure 24: Stainless Steel 316L Properties ... 33
Figure 25: Stainless Steel 316L for specimen test by CATIA V5 ... 34
Figure 26: Jig Male by CATIA V5 ... 35
xii
Figure 28: Jig Female by CATIA V5 ... 36
Figure 29: Jig Female by CATIA V5 ... 36
Figure 30: Sliding Guide by CATIA V5 ... 37
Figure 31: M8 * 25 Steel Hexagon Socket Head Cap Screw by CATIA V5 ... 37
Figure 32: Steel Plain Washer for 8*18.8 by CATIA V5 ... 38
Figure 33: Assembly View by CATIA V5 ... 38
Figure 34: Assembly Open View by CATIA V5 ... 39
Figure 35: Assembly Close View by CATIA V5 ... 39
Figure 36: Exploded View by CATIA V5 ... 40
Figure 37: Exploded View by CATIA V5 ... 40
Figure 38: Result of Clash Checking by CATIA V5 ... 41
Figure 39: Jig Male ... 42
Figure 40: Jig Female, sliding guide, M8*25 screw and Steel Plain Washer ... 43
Figure 41: Assembly View... 44
Figure 42: Exploded View ... 45
Figure 43: U-Bending Experiment Process... 46
Figure 44: U-bending process ... 47
Figure 45: U-bending process is end ... 47
Figure 46: Graph of Average Experimental Force versus Thickness Reduction ... 50
Figure 47: Graph of Average Experimental Stress versus Thickness Reduction ... 51
Figure 48: Graph of Average Experimental Force and Stress versus Thickness Reduction ... 51
Figure 49: Simulation ... 52
Figure 50: Simulation Process for Open View ... 52
Figure 51: Simulation Process for Close View ... 53
Figure 52: Deformed Mesh ... 54
Figure 53: Analytical Stress for Original Thickness, 2mm ... 54
Figure 54: Analytical Stress for 1.8mm ... 55
Figure 55: Analytical Stress for 1.6mm ... 55
Figure 56: Analytical Stress for 1.55mm ... 56
Figure 57: Analytical Stress for 1.4mm ... 56
Figure 58: Analytical Stress for 1.2mm ... 57
Figure 59: Analytical Stress for 1.0mm ... 57
xiii
Figure 61: Analytical Stress for 0.6mm ... 58
Figure 62: Graph of Analytical Stress versus Thickness Reduction ... 59
Figure 63: Graph of Compressive Stress and force Applied versus Specimen's Thickness Reduction ... 61
Figure 64: Graph of Stress versus Strain... 62
Figure 65: 2.0mm Microstructure by 500 Magnifying Glass ... 63
Figure 66: 1.55mm Microstructure by 500 Magnifying Glass ... 63
Figure 67: Graph of Hardness versus Thickness Reduction ... 63
Figure 68: 2.0mm Microstructure by 500 Magnifying Glass ... 64
Figure 69: Stress - Strain Graph for 0.6mm ... 70
Figure 70: Stress-Strain Graph for 0.8mm ... 70
Figure 71: Stress-Strain Graph for 1.0mm ... 71
Figure 72: Stress-Strain Graph for 1.2mm ... 71
Figure 73: Stress-Strain Graph for 1.4mm ... 71
Figure 74: Stress-Strain Graph for 1.55mm ... 72
Figure 75: Stress-Strain Graph for 1.6mm ... 72
Figure 76: Stress-Strain Graph for 1.8mm ... 73
Figure 77: Stress-Strain Graph for 2.0mm ... 73
LIST OF SYMBOLS
FEM = Finite Element Method HOQ = House of Quality n/a = Not Applicable
%RT = Percentage of Reduction in Thickness avg. = Average
1
CHAPTER 1
INTRODUCTION
1.0. INTRODUCTION
[image:14.595.144.499.491.715.2]Bending is a metal forming process which a force is applied to a sheet metal to forming an angled or sheet profile. A bending operation causes deformation along one axis. Bending dies is to classify according to their design. To perform a single bending operation, dies are designed which may include L, V, U or Z bends or other profiles. (Vukota Boljanovic, 2004) The parameters of U-bend profiles are shown in Figure 1: (CustomPartNe, 2009)
2
Simulation is very significant in a U-bending design process. Simulation enables to analyze the design in factors of quality, performance, characteristics, and properties of the U-bending before development process. In simulation, finite element method, FEM is used to investigate the precision of U-bending process. The FEM simulation enable to make a clearly identified of the stress distribute in specimen and the parameters changed after visual U-bending process.
1.1. OBJECTIVES
To develop and design the three dimensional U-bending machine.
To simulate U-bending process of Stainless Steel 316L by software CATIA V5. To analyze the result from experiment to commercial software CATIA V5. To understand the characteristics of the Stainless steel 316L after U-bending
process.
1.2. SCOPES
Study on the development of three-dimensional U-bending machine. It is design for manufacture of Stainless Steel 316L U-bending specimen test. For the design of the machine, simulation of U-bending process and structural analysis are carried out. The analysis is carried out by FEM simulation using the commercial software CATIA V5.
1.3. PROBLEM STATEMENT
3
1.4. FLOW CHART
Start
Introduction
Literature Review
Conceptual Design
Simulation and Structural Analysis
Comparison between experimental result and analytical result by FEM
NO
YES
Result and Discussion
Preparation report and presentation
[image:16.595.137.471.86.757.2]End
4
CHAPTER 2
LITERATURE REVIEW
2.0. LITERATURE REVIEW
This chapter will discuss about the theory and information that related to the project. The information is gathered though journals, books, articles, online documents, and some website. This chapter is significant to done the project, this is because the ideas, concepts and some theory can easily generate and get from the information that have gathered. From the information, research and the experience that have done by others, it is very benefit and save the time to do the research and design for three-dimensional U-bending machine.
2.1. THE MECHANICS OF U-BEND DEFORMATION
The mechanics of deformation are significant to consider in designing a bending system. For example,
Bendability assessment.
5 Control of the dimensional, spring back, tolerances, residual stresses,
wrinkling, and splitting. Sheet metal properties
(Thickness, properties, and surface finish) Equipment / machine used
(Control and capacity) Tools
(Material and coating) Deformation work zone
(Strain, stress, and force) Product
(Dimensions and quality) Environment
(Handling and safety) (Taylan Altan et al. 2012)
Normally U-bending process is containing high elastic and plastic strain. However, sometime for a very thin sheet or very small diameter wire it is possible produce only elastic strain only for U-bend process. Furthermore, U-bending provides one of the most severe tests available for smooth which are as opposed to notched or precracked, stress-corrosion test specimens. The specimens that contain single stressed are not suitable for study on the effects of different applied stresses on stress corrosion and mirror effect on cracking. The advantages of the U-bending process are simple and economical to make and use. Figure 3 is shows the typical U-bending configurations with several different of maintaining the applied stress. (ASTM, 2003)
6
Figure 3: Typical stressed U-bending (Source: ASTM, 2003)
7
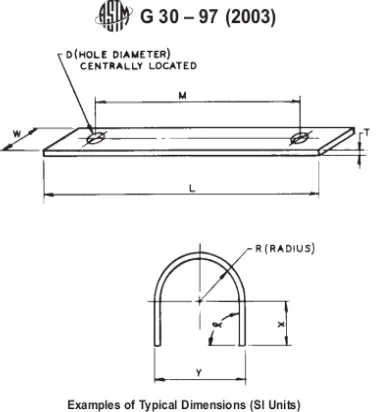
Figure 4: Example of typical specimen dimensions (Source: ASTM, 2003)
2.2. BEND ALLOWANCES
According to Kutz (2002), dimension is changed after bending, increased in length. It is significant to take consideration the length tolerance for the processes of product and die designing. From Figure 1, bent length can be calculated by the equation of
(2.1) Where,
B = bend allowance (along neutral axis) A = bend angle
Ri = Inner bend radius
t = specimen thickness
K = 0.33 when Ri is less than 2t
8
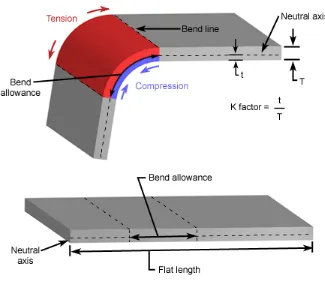
2.3. STRESS AND STRAIN CONSIDERATION
The principal interest of stress in the U-bending process is circumferential. Due to there is a stress gradient, stress become non-uniform and produce a stress gradient. Outer surface will undergo tension force, and the inner surface will undergo compression. Hence, length in neutral axis is remains constant, there have no any change of length. However, there having a neutral axis between the inner and outer surface. In a neutral axis, it is undergo free of stress, which no tension or compression force. Figure 5 is shows the stress profile on a bending specimen. K-factor is to calculate the location of the neutral axis. K-K-factor is depending on the material, bending operation, bend angle and others. K-factor cannot greater than 0.50 and normally is greater than 0.25.
K-factor = (2.2)
9
Figure 5: Stress profile (Source: CustomPartNet, 2009)
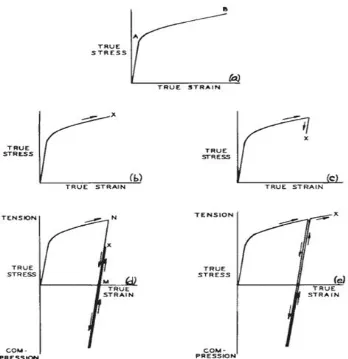
For a U-bending specimen is stressed, outer surface of the material may undergo plastic deformation of the true stress-strain curve. Figure 6(a) is shown. Figure 6(b) to 6(e) are show several stress-strain relationships that may exist in the outer surface of the U-bending process. Method of the stressing is influence the actual relationship.
The total strain, ε on the surface of the bend can be approximated to the equation of
(2.3)
10
Figure 6: True stress-strain relationship for U-bending (Source: ASTM, 2009)
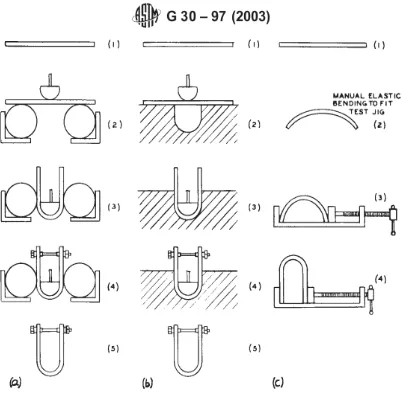
11
Figure 7: Single stage stressing and the methods (Source: ASTM, 2003)