WITH INSIDE DIAMETERS BETWEEN
8.7
AND 221 MICRONSThesis by
James Henry Barbee
In Partial Fulfillment of the Requirements
For the Degree of Doctor of Philosophy
California Institute of Technology Pasadena, California
1971
ACKNOWLEDGMENT
Even before I entered Caltech, Professor Cokelet was assist-ing me by answerassist-ing my questions concernassist-ing placement exams, course work, etc. Since then, he has always been helpful and patient. Special thanks' are due to Professor Cokelet for suggesting the sub-ject matter for my thesis and for his help through all phases of the research. Special thanks are also due to each one of my committee members for their instruction in course work as well as suggestions for improving the quality and presentation of my research results. Professor c. J. Pings, my committee chairman, has been of invaluable help in smoothing the path that led to Montana State University. Without his constant attention to the red tape that interfered with an efficient transition, I would probably never have been able to ex-plain why a student at Caltech was living in Bozeman, Montana.
Thanks are also due to the students of Montana State for the never ending flow of blood, and to
v.
w.
Steele, M.D., for removing said blood from its native environment. Radiologist C. E. Taylor, M.D., provided interesting discussions concerning the flow of parti-culate dyes, used for X-ray purposes, through the human body.And thanks, of course, to Judy, Minx, Whidby, Bird, Noel, and Buzz. Also JK or KJ, as the case may be.
ABSTRACT
The purpose of this study was to investigate the pressure drop-flow rate behavior of normal human blood drop-flowing through small capil-lary tubes. A sensitive pressure transducer was used to measure the pressure gradient along an experimental tube when various red cell suspensions passed through glass and plastic capillary tubes. In particular, the effect of capillary tube diameter on the rheological properties of blood was observed for capillary tube diameters from 8 to 221 microns.
For tubes of 221 microns and smaller, it wa.s found that the hematocrit (volume fraction of red cells in a blood sample) of the blood flowing through a capillary tube is less than the hematocrit of the blood in the feed reservoir. The tube hematocrit decreases linearly with the logarithm of the tube diameter at constant feed reservoir hematocrit and for a given diameter tube, increases lin-early with the feed reservoir hematocrit.
An equation was developed from data taken in an 811-micron ID tube that allows the shear stress-shear rate relation to be predicted from the tube diameter, tube hematocrit, and the temperature.
hemato-crit parameter. A surprising result found is that fluid properties can be predicted for blood flow through a 29-micron ID tube; in such a tube, the equation of motion may not be valid because the "continu-ous fluid" assumption is not valid. Blood flow data were taken at
g6.6°F as well as 73.5°F. Blood heated to lll°F and then cooled to g6.6°F was also investigated.
Blood flow through 15- and 9-micron ID capillaries was in-vestigated. Blood exhibits no yield stress in a 15~cron ID tube because rouleaux formation cannot restrict the flow as it does in larger tubes.
I. II. III.
TABLE OF CONTENTS
ABSTRACT. . . NOMENCLATURE INTRODUCTION .
A. Physiology of Human Blood and Blood Flow 1. Composition of Normal Human Blood.
a. The Red Blood Cell . . b. The White Blood Cell . c. The Platelets . . . d. Blood Plasma . .
Behavior of Blood in the Human Body. •
Page . ii .xiv 1 1 2 3 7 9 9 13 2.
3.
4.
Coagulation . . . .
Aggregation of Red Cells .
.
. . . 16
B.
c.
The Rheology of Human Blood. . . • • . . 1. Early Experimental Work. . • . . . • . 2. Theoretical Models . . . . • . • .
3.
Interpretation of Rheological Data . • . . .4.
Blood Suspension Stability . • . .Effect of Tube Diameter on Blood Rheology • . 1. Theoretical Considerations
a. Rigid Particles . • . • .
18
19 . 19
b. Flexible Particles . . . . 2. Experimental Investigations .
a. Large Scale Models. . . .
b. Blood Flow Through Small Tubes. IV. APP~TUS AND PROCEDURE • • • • . • • • • • •
Page 35
43
43
4546
A. Pressure Drop-Flow Rate Capillary Viscometer. .
46
1. Description .2. Operation .
46
58 B. Measurement of Experimental Fibers. . . 61
c.
Observation and Microphotography . .1. Observation . . . . 2. Microphotography. . D. Preparation of Samples.
V. DISCUSSION OF EXPERniENTAL RESULTS. · A. Previously Reported Results
1. Theoretical Results . .
2. Investigations at the M.I.T. Blood
66
6667
67
70 70 70
Rheology Laboratory . • . . . 73 B. Results Concerning the Average Hematocrit
Inside a Capillary Tube . • . . . 78
1. Theoretical Results
82
2. Measurement of the Actual Hematocrit
c.
Results Obtained Using a Capillary Viscometer and Tubes Larger Than 300 Microns ID· . . . .1. Experimental Results· . . . ·
2. Theoretical Equations Where the Con
-Page
.
..
.111 . . 111tinuum Model Applies. . . . . . . 123 D. Results Obtained Using a Capillary Viscometer
and Tubes Smaller Than 300 Microns ID . . . 137 1. Experimental Results . . . . • . 137 2. The Flow of Blood Through a 29-Micron
ID Tube · · · ·
.
156
3.
Blood Flow Data Taken at g8.6°F . . .164
E. Results Obtained Using a Capillary Viscometer and Tubes Less Than 29 Microns ID . . .
1. Experimental Blood Flow Results
2. The Continuum Model . VI. CONCLUSIONS . . • . . .
VII. RECOMMENDATIONS FOR FURTHER WORK .
IX. APPENDIX A •
X. APPENDIX B •
XI.
BIBLIOGRAPHY .XII. PROPOSITION I.
XIII. PROPOSITION II .
XIV. PROPOSITION III.
. • 170 .170
.185
. . .
189
.193
. . .
195
LIST OF TABLES Table
I. List of the Contents of the Red Cell Interior. II. List of the Main Constituents of Blood Plasma
and Their Normal Concentrations· ·
Page 7
. . . 10
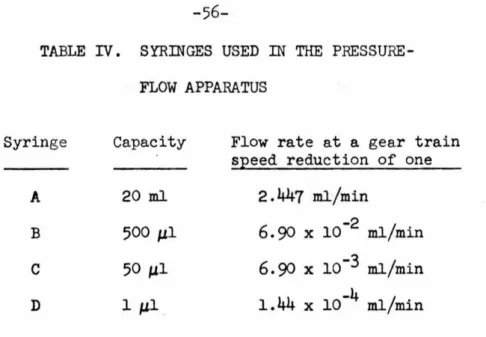
III. Gear Train Speed Reductions. . . . . . . 55 IV. Syringes Used in the Pressure-Flow Apparatus ·
. 56
v.
Calculated Values of the Plasma LayerThick-ness for Different Tubes . . • . . . • . . 110 VI. Values of C, the Exponent in Equations (27)
LIST OF FIGURES
Figure Page
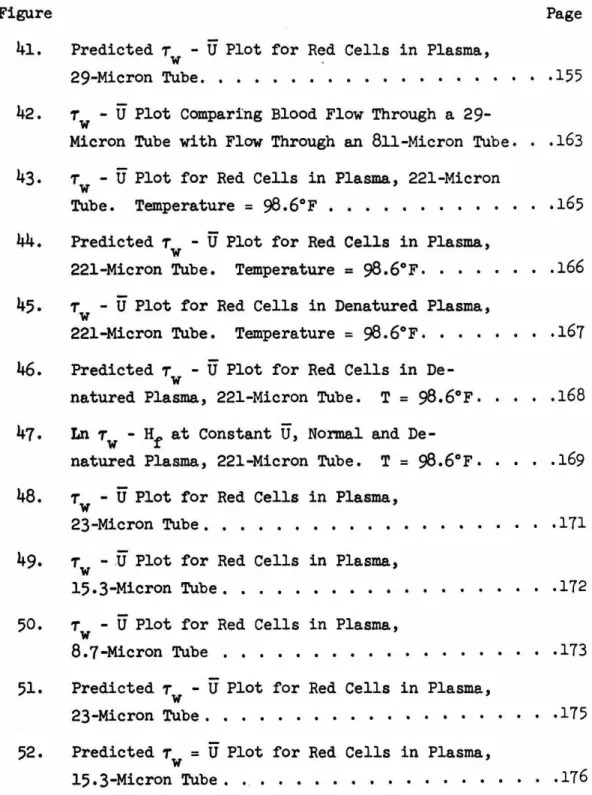
l . The Human Red Cell 3
2. The Fibrinogen Molecule. . . . . 11
3·
Red Cell Aggregate (Rouleaux). . . • 214.
Vortex Flow Between Two Moving Erythrocytes . .40
5·
6.
Pressure Drop-Flow Rate Apparatus . . . . T -wU
Plot for Distilled Water, Various . Tube Diameters . . . • . . .7.
Capillary Viscometer with Hematocrits Hf' Ht' and Hd . . . · · · ·8.
Annulus of Pure Plasma Surrounding Red Cell Pack . . .9·
Concentration Distribution, and Velocity Profile . . . . 10. Exit Relative Hematocrit vs. Feed Reservoir.
47
. . . 53. 53 . . . 82
. . . 83
. . . 84
Hematocrit . . . 95
11. Tube Relative Hematocrit vs. Feed Reservoir Hematocrit for Tubes Larger Than 29 Microns ID · · · 96
12. Slope of Hr vs • Hf as a Function of Tube Diameter . . . . • . . . . . . . 98
13. Tube Relative Hematocrit vs. Feed Reservoir Hematocrit for Tubes Less Than 29 Microns ID . . . · . · 99
14. Tube Relative Hematocrit vs. Feed Reservoir Hematocrit for Suspensions of Red Cells in 3~ Dextran and for Hardened Red Cells in Normal Plasma Flowing Through a 29-Micron Tube . . . 105
Figure Page
16. Semi-Log Plot of Tube Relative Hematocrit
vs Tube Diameter for All Experimental Tubes. . 107
18. 19. 20. 21. 22. 23.
T - U Plot for Red Cells in Plasma, w
811-Micron Tube . . • . . . • . . . 113
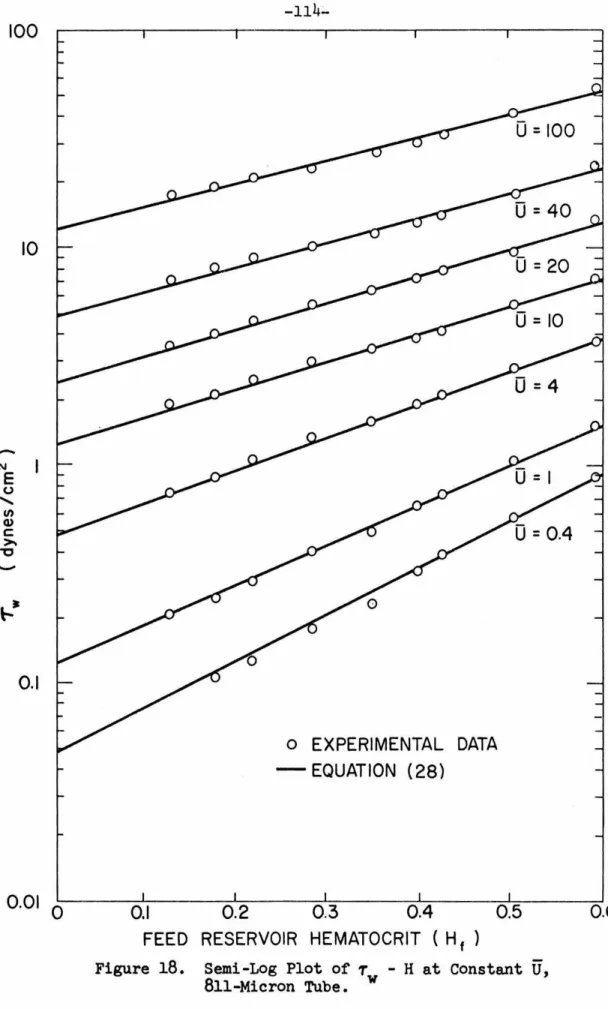
Semi-Log Plot of T - H at Constant
U,
w
811-Micron Tube. . . .
Tw - U Plot for Plasma at 98.6 and 73.5°F.
Tw - U Data Predicted from Equation (28)
.
.
.
Tw - U Data of Benis and Meiselman Predicted by Equation (28)
. .
. . . .
.
. . .
Ln Tw - Hf at Constant U for the Bingham Model, Equation (31) .
.
.
.
. . .
.
. .
Ln Tw - Hf at Constant
U
for the PseudO-Bingham Model, Equation (33).
.
.
.
. 114
.
118.
.
119. .
. .
120.
. .
.
127.
.
.
.
12824. Ln Tw - Hf at U
=
100 for Stokes Law Model,25.
26.
27.
28.
Equation (53). . . . • . • . . • . . . 136
T - U Plot for Red Cells in Plasma,
w
221-Micron Tube. . . • . . . • • 138
Tw -
U
Plot for Red Cells in Plasma,153.5-Micron Tube . . . • . . • . . • . • 139
T -
U
Plot for Red Cells in Plasma, w128-Micron Tube. . . . • . . . • . . . • 140
T - U Plot for Red Cells in Plasma,
w
Figure Page
29. Tw - U Plot for Red Cells in Plasma,
75-Micron Tube. . . • . . . • . . . • .142
30. Tw - U Plot for Red Cells in Plasma,
59-Micron Tube. . . • . . • . . . • • . . . • . .143
31. Tw -
U
Plot for Red Cells in Plasma,29-Micron Tube. . . • . . • . . . .144
32. Ln T w - Hf at Constant U, Predicted Data
for 99-, 59-, and 29-Micron Tubes . . • . . . • 146
33· Ln Tw - Hf at Constant U, Arbitrary Tube D18.Dleter. . . . . . . • . . • . • .
34.
Relative Hematocrit vs Feed Hematocrit,Predicted Data.
.
.
. .
.
. . .
.
.
. .
. .
. .
.148 35· Predicted T -U
Plotw for Red Cells in Plasma,
221-Micron Tube
.
.
.
.
.
.
. .
.
.
.
.
.
. . .
.
.
.149 36. Predicted T - U Plotw for Red Cells in Plasma,
153.5-Micron Tube
.
.
.
.
.
.
. .
. .
.
. .
.
.
.
.
.150 37. Predicted T -wU
Plot for Red Cells in Plasma,128-Micron Tube
. .
.
. .
. . .
.
. .
.
.
. .
.
.
.
.151 38. Predicted Tw
-
U
Plot for Red Cells in Plasma,99-Micron Tube.
.
.
.
.
. .
. .
.
.
.
.
.
. .
.
. .
.152 39. Predicted T -U
Plotw for Red Cells in Plasma,
75-Micron Tube.
.
.
. .
.
.
.
.
.
.
.
. .
.
.
.
.
.
.15340.
Predicted T - U w Plot for Red Cells in Plasma,Figure Page 41. Predicted T - U Plot for Red Cells in Plasma,
w
29-Micron Tube. . . • . • • . . . . • • • . . • .155 42. T w -
U
Plot Comparing Blood Flow Through a29-Micron Tube with Flow Through
an
811-Micron Tube . . •163
T w -U
Plot for Red Cells in Plasma, 221-MicronTube. Temperature
=
98.6°F • • • . • . . • • • • . • 16544.
Predicted T w -U
Plot for Red Cells in Plasma,46.
48.
50.
51.
52.
221-Micron Tube. Temperature ; 98.6°F . . . • . • • .
166
T -
U
Plot for Red Cells in Denatured Plasma, w221-Micron Tube. Temperature
=
98.6°F. • • . . .167
Predicted T -U
Plot for Red Cells inDe-w
natured Plasma, 221-Micron Tube. T
=
98.6°F . . . . • 168Ln
Tw - Hf at ConstantU,
Normal andDe-natured Plasma, 221-Micron Tube. T
=
98.6°F· . • . .169
T w -
U
Plot for Red Cells in Plasma,23-Micron Tube • • . . • • . . • . • • . . . .171 T -
.
u
Plot for Red Cells in Plasma,w
15.3-Micron Tube . .
. . .
.
. .
. . . . . . . .172 T -U
Plot for Red Cells in Plasma,w
8.7-Micron Tube . • . • • • • • . .
. . .
. . .
Predicted T w - U Plot for Red Cells in Plasma,0 0
.173
23-Micron Tube • • • • • . • • . • . • . • . • . . . .175 Predicted T
=
U
Plot for Red Cells in Plasma,w
Figure
53.
54.
55.
56.
57·
Predicted T - U Plot for Red Cells in Plasma,
w
Page
8.7-Micron Tube . . • . . . 177
T l/2 -
u
1f
2 Plot (Casson Plot) for Red Cellsw
in Plasma, 23-Micron Tube. . . • 181
T 1
1
2 -~/
2 Plot (Casson Plot) for Red Cellsw
in Plasma, 15.3-Micron Tube . . . • . . . 182
T 1
1
2 -~/
2 Plot (Casson Plot) for Red Cellsw
in Plasma, 8.7-Micron Tube . . . . . 183
Tw
* -
~/
2 Plot for Red Cells in Plasma,TABLE OF NOMENCLATURE
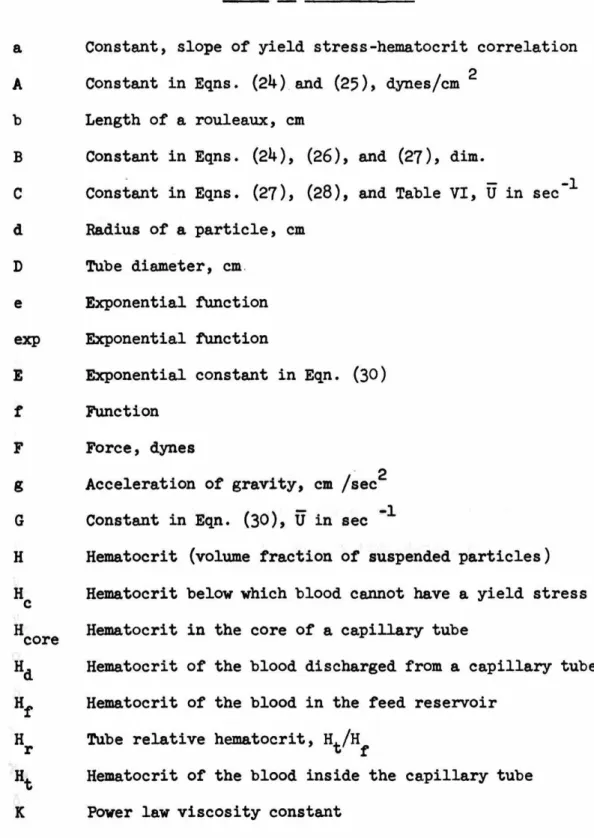
a Constant, slope of yield stress-hematocrit correlation A Constant in Eqns. (24) and (25), dynes/em 2
b Length of a rouleaux, em
B Constant in Eqns. (24), (26), and (27), dim.
C Constant in Eqns. (27), (28), and Table VI, U in sec-l d Radius of a particle, em
D Tube diameter, em. e Exponential function exp Exponential fUnction
E Exponential constant in Eqn. (30)
f Function
F Force, dynes
. 2 g Acceleration of gravity, em /sec G Constant in Eqn. (30),
U
in sec -lH Hematocrit {volume fraction of suspended particles) He Hematocrit below which blood cannot have a yield stress H core Hematocrit in the core of a capillary tube
Hd Hematocrit of the blood discharged from a capillary tube Hf Hematocrit of the blood in the feed reservoir
Hr Tube relative hematocrit, Ht/Hf
L M n n 0 n r Q r r y R s t (U)
u
v
f3
')'Length of a tube, em
Compliance of a pressure transducer, ml/mm of Hg Exponent in the power law fluid model
Total number of particles in a suspension Number of rouleaux
Number of red cells in a rouleaux Pressure drop, mm of Hg
Volumetric flow rate, ml/min
Length variable in the radial direction, em Radius of a core of packed red cells, em Radius of a tube, em
2 1/2 Slope of a Casson plot, (dynes-sec/em ) Time; sec, min
Average velocity, em/sec
-1 Reduced average velocity, tubes diameters per sec, sec Internal volume of a pressure transducer, ml
Axial slip velocity, em/sec Centerline velocity, em/sec
Slope of ln vs H plot, dynes/cm2 w
Intercept of ln vs
w
-1 Shear rate, sec
2 H plot, dynes em
~p
p
T
*
-1 Angular velocity of a particle, sec
Newtonian viscosity coefficient, centipoise
Newtonian viscosity coefficient of pure plasma, centipoise Density, gm/cm3
Shear stress, dynes/cm2
2 Shear stress at the tube wall, dynes/em
Excess wall shear stress, T -
~
U,
dynes/cm2 wINTRODUCTION
Physiology of Human Blood and Blood Flow
The primary function of the human circulatory system is to provide the various tissues of the body with nourishment (oxygen, metabolic materials such as sugar and water) and to remove waste materials (carbon dioxide, urea, metabolic by-products). This is accomplished by circulating blood through a closed system of vessels with the heart acting as the pump. The flow of blood is not neces-sarily constant to all areas of the body, and in fact, the total volume of blood circulated need not be constant.
The ultimate objective of this study was to gain insight into the interactions between human red blood cells in their normal sus-pending media (plasma) and the relation to blood flow in the human circulatory system. It is expected that the conclusions drawn from the experimental data will be of value to medical science in two areas. First, it is anticipated that the data taken in a capillary viscometer can be correlated with the data taken in the actual human circulatory system. Secondly, the information presented can be used to determine the engineering design of specialized surgical equipment, such as the heart-lung machine, artificial kidneys and artificial hearts.
vis-cometer. The capillary tube diameter range was from the same size as the suspended particles (red blood cells) to approximately twenty-five times the size of the suspended particles. The assumption of a homogeneous, single-phase fluid was expected to fail somewhere within this tube diameter range.
From an engineering point of view, blood can be considered as a suspension of non-spherical, non-rigid particles in a Newtonian liquid. The resulting suspension is non-Newtonian and exhibits a measurable yield shear stress at zero shear rate. The yield shear stress is caused by the interaction between suspended particles. The concentration of the particles is high enough so that inter-action among the particles is the same order of magnitude as the hydrodynamic forces acting on the particles.
Composition of Normal Human Blood (10,~,32,108)
The Red Blood Cell
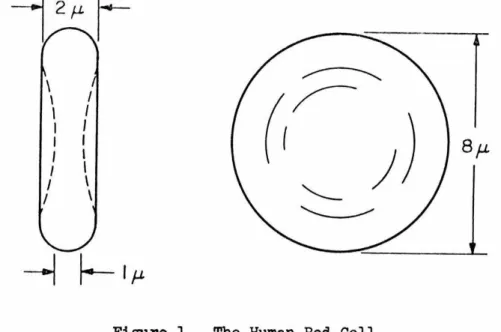
The normal human red blood cell (at rest) has the shape of a
bi-concave disk with a mean diameter of approximately eight microns,
a maximum thickness of two microns, and a minimum thickness of one
micron (106). The average volume is about 107.5 cubic microns, and
the average surface area is
138
square microns ~). The shape ofthe undeformed normal human red blood cell is shown in Figure 1.
\ I
I I I I
I I
I I I I
I \
I \
;)
Bf-L
Figure 1. The Human Red Cell.
The human red cell is very flexible, and Figure 1 shows the
un-stressed red blood cell as found, for example, in stationary blood.
During flow it is easily deformed into almost every possible shape,
especially in the smaller blood vessels ~,20). The flexibility
arises because the red cell is essentially a thin membrane container
At sea level, normal blood contains about
5.4
million red blood cells per cubic millimeter in the male and about4.
6
million red cells per cubic millimeter in the female. Thus, the red cells occupy about47%
of the blood by volume in the male, and about42
%
by volume in the female. The volume fraction of red cells in blood is called the 'hematocrit', and does not include the volume occupied by the white cells or the platelets. Changes in the hematocrit can occur as the result of external causes (loss of blood due to acci-dents) and through disease. Low hematocrit, called anemia, can be~
caused by 1) blood loss due to bleeding, 2) lack of functioning bone marrow,
3)
failure of the red cells to mature, and4)
destruction of the red cells, as in sickle cell anemia. High hematocrit, known as polycythemia, can develop in persons living at high altitudes as well as in persons suffering from abnormal red cell forming organs. In disease conditions the hematocrit can vary from 0.10 to 0.75.The red blood cell is a 'living' cell in that metabolism takes place in the interior and that it does age. The red cell survives for about 110 to 120 days ~n the normal human. During its lifetime, the red cell is reported to undergo changes in its dimensions, shape, volume, density, osmotic fragility, metabolism, and composition.
has been attributed to organic and inorganic components of the red
cell membrane. The negative charge is not strong enough to prevent
the red cells from sticking together, and in stationary blood the
red cells aggregate face to face and form stacks called 'rouleaux'.
The red cells in rouleaux are only weakly held together and when the
blood is sheared, the rouleaux decrease in length or break up
com-pletely. The rouleaux are not rigid and can bend around obstacles
without breaking. In stationary blood the rouleaux may contain as
many as 30 red blood cells.
An important aspect of the red cell is its ability to respond
rapidly to osmotic pressure changes in the suspending media. The red cell membrane acts as a semipermeable barrier to material of
high molecular weight and permits the diffusion of low molecular
weight substances into and out of the cell. The process is not
al-ways one of simple diffusion since the red cell, at equilibrium with plasma at
98.6°F,
has a sodium ion concentration about one-tenth thatof the plasma and a potassium ion concentration about thirty times
that of plasma. Red cells which have been kept at
4°C
have an ionicdistribution more like the plasma, but when the temperature is raised
back up to
98.6°F,
the original ionic distribution is again achieved.It seems that some metabolic process is responsible for the rejection
The rate of water permeation through the red cell membrane is very rapid, and the lack of osmotic equilibrium between the cell and its environment is corrected within a few seconds. Red cells placed in distilled water burst in about two seconds, and shrinkage can be observed immediately when they are placed in a concentrated salt solution.
Random fluctuation or flickering of the red cell membrane has been reported and this motion has been attributed to either Brownian motion of the molecules in the cell or to metabolic activity of the cell. Neither cause has been specifically demonstrated to be com
hemoglobin in plasma capable of transporting the same amount of
o
2 orco
2 as whole blood. The hemoglobin concentration in the red cell is high enough to make its physical state somewhere between a liquid
and a crystal
(66).
Some of the remaining main chemicals inside thered cell and their concentrations are listed in Table I.
TABLE I. LIST OF THE CONTENTS OF THE RED CELL INTERIOR
Reduced Glututhione
Chloride Ion
Bicarbonate Ion
Phosphate Ion
Ester Phosphate
Sodium Ion
Potassium Ion
Water
1.1 gm/liter of H 20
73
gm/liter of H2025 gm/liter of H 20 0.04 gm/liter of H
20
0.69
gm as P/liter of H2
0
15 gm/liter of H20 150 gm/liter of H
20
69
wt.'fo
These species represent only the most abundant chemicals inside the
red cell; many other chemicals are present in trace amounts.
The White Blood Cell
The white cells, or leukocytes, are of five types, including
three types of polymorphonuclear cells, monocytes, and lymphocytes.
Unlike the red cells, they contain discrete nucleoli. The white cell
concentration in an adult is usually about 7,000 per cubic
considerably and also rapidly. Hard exercise and even deep breathing can increase the concentration by a factor of six or seven. Tissue damage and certain diseases such as leukemia may cause a 50-fold in-crease in the white cell count.
The general description of the white cells is that they are easily deformed spheres, approximately 8 to 15 microns in diameter. They are extremely flexible, since they not only squeeze through capillaries which have a smaller diameter than the white cell, but also pass through the pores of the blood vessel walls themselves.
The interior of the white cell is more complex than the red cell interior. The white cell contains a nucleous, ingested particles, and cytoplasm. The inorganic chemical composition of a leucocyte
(in millimoles per liter) is: sodium - ll3; potassium - 22; calcium - 2; chloride - 70; inorganic phosphorus - 10; bicarbonate - 1.8. The white cell also contains a high concentration of various enzymes. The contents of the white cell have an ionic composition close to that of plasma.
The Platelets
The third type of particle, the platelet, is an incomplete
cell lacking both a nucleus and a clearly defined boundary. The
platelets are the smallest of the particles, ranging in size from
about one to three microns, and are normally present in the blood in
a concentration of about
4oo,ooo
per cubic millimeter.Using phase contrast microscopy, it has been shown that the
platelet has many fibrils or spikes projecting from its surface. The
formation and destruction of these fibrils is reversible and is
de-pendent on the dissolved carbon dioxide and oxygen content of the
platelet environment; high carbon dioxide-low oxygen conditions
re-sult in fibril formation, while the reverse conditions cause fibril
destruction.
Blood Plasma
When the particles in the blood are removed (as by
centri-fugation), the remaining liquid is plasma. Blood plasma is usually
a clear, straw-amber colored fluid with a pH of
7.46
and a specificgravity of about 1.03. (Note that the red cell specific gravity,
1.10, is larger than that of the plasma, and the red cells have a
tendency toward sedimentation). Even though plasma is an extremely
complex solution of organic and inorganic substances in an aqueous
solvent, it has been found to be Newtonian with a viscosity of about
1.2 cp at
37°C
(61,55). Table II lists the more abundant substancesTABLE II. LIST OF THE MArn CONSTITUENTS OF BLOOD PLASMA AND THEIR NORMAL CONCENTRATIONS
Proteins -
6.8%
by weightAlbumin ex-globulins ,9-globulins y-globulins Fibrinogen
3·5 wt
%
0.83 wt%
0.89 wt%
0.70 wt%
0.49 wt%
Other Organic Substances (in mg/100 ml of plasma)
Sugar Urea
Cholesterol
123
22107-320 (194 average)
Inorganic Ions (in mg/100 ml of plasma)
Na+ 311-334
K+ 13.7-19.5
ca+2 9.2-11.2
Mg+2 1.22-2.43
Cl- 352-373
so
4- 2 -2 22.1
P04 13.3
170
The proteins are large molecules composed of various amino
acids. The rate of plasma protein formation by the liver can be
ex-tremely high, as great as 100 grams per day. Protein loss can also
be large, through severe burns or through kidney disease. Of all the
proteins present in plasma, only albumin and fibrinogen have been
obtained as pure substances. The other proteins are obtained in
The molecular weights of the plasma proteins range from about 44,000 to over one million. The number average molecular weight
(obtained by osmotic pressure measurements) is approximately 85,000 to 90,000 (117). This is because the most abundant protein, albumin, has a molecular weight of about 69,000. Fibrinogen has a molecular weight of about 340,000.
With the exception of fibrinogen, most of the proteins are roughly spherical in shape. The size and shape of the fibrinogen molecule, as determined in the dry state, is unique for plasma pro-teins and is shown in Figure 2. Electron microscopic studies indi-cate that fibrinogen has a double-dumbbell shape, with the middle sphere being smaller than the two outer spheres (§2).
0
475
±25
A---~An important and sometimes undesirable property of the plasma proteins is their ability to act as surface active agents. Upon reaching a liquid-gas interface, the proteins change their con-figuration irreversibly, thus changing their physical and chemical properties. This irreversible change (called denaturing) can be detrimental to the human body, for example in the operation of a heart-lung machine, and the free surface must be eliminated in order to preserve the integrity of the blood plasma. When the plasma pro-teins denature at a liquid-gas free surface, the resulting inter-facial film has considerable mechanical strength. Thus, exposing plasma or blood to the air can lead to experimental artifacts in the operation of a capillary or couette type viscometer.
An important physiological fUnction of the plasma is its role in controlling the total volume of blood in the circulatory system
(~). The vessels, especially the small capillaries, are highly
per-meable to water and small ions, and any changes in either colloid or hydrostatic pressure can cause a shift of liquid from the
intra-vascular to extra-intra-vascular compartments. The "law of the capillaries"
move fluids out of the capillaries equal the forces tending to move
fluids inwards; thus a dynamic exchange of fluid between capillary
vessel and the surrounding tissue is established.
Behavior of Blood in the Human Body
In the human circulatory system, blood is pumped from the
heart through a branching network of vessels; first through the large arteries, then through smaller arterioles, and finally to the
capil-laries where transfer of material between blood and the other parts
of the body takes place. From the capillaries, blood returns to the
heart through vessels similar to those on the arterial side, the
venules and veins. The arterioles, venules, and capillaries comprise
the 'microcirculation'.
The various blood vessels vary greatly in size and
construc-tion. In the human circulatory system, the diameter ranges from
about 2.5 em for the aorta to about 5-10 microns for the capillaries.
The large vessels are very muscular and are in a constant state of
tension, while in the true capillaries elastic tissue is absent from
the vessel wall. Except possibly in the venules, flow in the
micro-circulation is not steady but appears to be continually stopping and
starting as valves called precapillary sphincters divert the flow
through those capillaries located in areas of highest tissue
Estimates based on microphotography indicate that less than
twenty percent of the total capillary system is involved in flow,
under resting conditions, at any given time
(139).
Flow can bypassthe capillaries completely and return to the venous blood vessels
through shunts.
Flow leaving the heart is highly periodic, and the arteries
can be seen to flex in response to pressure changes. The pulsing is
damped out when the small arterioles are reached, and periodicity is
usually not detectable in the venules. Small pulsations can be found
in the arterioles
(141,12).
Reynolds Numbers based on apparent bloodviscosity are much smaller than required to maintain turbulent flow
(~).
The pressure drop across the entire human circulation is about
100 mm of Hg, most of which occurs across the arterioles and
capil-laries (about 8~). The venules and small veins have a pressure drop
of about
5-7
mm of Hg. A phenomenon known as 'critical closingpres-sure' has been observed in the human circulation
(63).
That is, ifthe arterial pressure drops below a certain critical value, the flow
of blood will stop entirely and remain so until the pressure rises
above this value.
Our understanding of the mechanisms of blood flow in the human
circulation has been greatly increased by the use of
cine-micro-photography of anesthetized animal tissue. The motion pictures of
the type of flow in the capillaries and that in the larger vessels
(21).
The flow in the capillaries, where the vessel diameter isjust slightly greater than the diameter of the red cell, is a 'plug
flow' with the red cells passing through in single file. The flow
is seen to completely stop at times, and the rouleaux aggregations
are easily seen. In the arterioles and venules, on the other hand,
a rapidly flowing stream of blood is observed with the individual
cells not being distinguishable to the eye. The high-speed motion
pictures of Bloch (12), showing this type of flow, reveal that the
cells travel as individuals rather than as aggregates, and that the
cells tumble about randomly without being oriented in any particular
way. The red cells are definitely not seen to remain on streamlines
parallel to the vessel wall.
The films of Fulton (50,51,.2,g) also show a phenomenon known
as 'plasma skimming'. This effect is sometimes observed when a small
vessel branches away from a larger one. The cells, possibly carried
by their inertial momentum, will all flow past the junction and
re-main in the larger vessel, while only plasma, and occasionally
platelets, will pass into the smaller side vessel.
A further physiological effect, quite relevant to blood
rhe-ology, is also apparent in Fulton's films. If a vessel wall is
in-jured, platelets will aggregate at the point of injury and form a
large cohesive mass within a matter of seconds. In fact, such
with a micro-needle (145). Such observations suggest that valid
pressure measurements cannot be made in the living micro-circulation
by the insertion of cannulae. However, advanced techniques have
allowed the insertion of 1-5 micron micropipettes into the capillary
system. Pressure measurements can be made for a short time, then
the capillary tube plugs the micropipette (141,79).
Coagulation
As long as blood remains in the normal circulatory system,
there is no tendency for coagulation to occur except at sites of
in-jury. Coagulation is the result of a complex irreversible mechanism.
When a substance foreign to blood is present,the platelets burst,
re-leasing chemicals that start a series of chemical reactions which
finally convert the protein prothrombin to the enzyme thrombin. The
presence of thrombin causes irreversible polymerization of the plasma
protein fibrinogen to a solid structural network of fibrin. It has
been demonstrated that calcium ions must be present in order for the
coagulation mechanism to proceed. Platelets can also cohere and form
aggregates. Both types of 'clots', fibrin and platelet, can occur in
the living circulation under abnormal circumstances.
The steps involved in coagulation are (33):
1) damage to the blood vessel wall;
2) contraction of the blood vessel;
3) adhesion of platelets to the damaged vessel wall
4)
formation of a fibrin clot from fibrinogen; 5) shrinkage of the fibrin clot;6)
relaxation of the blood vessel; and7)
final destruction of the fibrin clot after blood vessel repair.This mechanism is a simplification of the actual situation. Over thirty different substances have been found in blood and re-lated tissues which have an effect on blood coagulation.
When blood is taken from a person or animal, the nature of the surface of the container into which the fresh whole blood is
placed considerably influences the rate at which coagulation proceeds.
Some evidence exists indicating a non-migratable negative charge on the surface of many materials, including glass
(78).
This is thought to create a high concentration of calcium ions at the surface and cause coagulation to occur at an increased rate. Siliconized sur-faces have been found to be relatively inert toward blood.Platelet adhesion will occur on any wettable surface but can be prevented by treating surfaces that come in contact with blood in order to make them hydrophobic (by siliconizing). However, when platelets do stick to a surface, they burst and release their con-tents into the blood.
ways: 1) add one of the various anti-coagulating agents to the whole
blood; 2) remove the calcium ions; or 3) remove the fibrin clot after
it has formed. When a fibrin clot is allowed to form and then is
removed, the physical properties of blood change. Also, the
rheo-logical properties of blood change when the fibrinogen is removed
(~).
Aggregation of Red Cells
An important property of the red cells is their ability to
aggregate in stationary or slowly flowing human blood (~,§1.,134).
0
Fahraeus
(44)
was the first to study this phenomenon and he observedthat the red cells aggregate with their flat faces together to form
the analogy of a stack of poker chips. Secondary aggregation is also
possible, with both rouleaux and single cells combining to produce a
three-dimensional network. Normally, in stationary healthy blood
the rouleaux may contain from eight to thirty cells, with an average
of about fifteen. Their formation is reversible, and they can be
broken up under conditions of high shear rate and reformed when flow
is stopped
(46).
Fahraeus found that albumin acted to prevent 0aggregation while fibrinogen acted to increase aggregation.
Two important properties of rouleaux formation should be
remembered:
1) They occur normally in the living circulatory system
2) Unlike coagulation, their formation is reversible and they may be broken up into individual red cells at high shear rate and then reformed at low shear rate.
The Rheology of Human Blood Early Experimental Work
Possibly the first work done with blood was performed in the 1830's when the French physician Poiseuille considered the flow of blood in the narrow parts of the vascular system (21). As he en-countered experimental difficulties with blood, he examined in de-tail the flow of liquids through small glass tubes (105). Working with aqueous solutions, he developed the famous 'Poiseuille equa-tion' relating flow rate, tube diameter and length, and the pres-sure drop along the tube. Poiseuille's law can be derived mathemat-ically from the laws of fluid mechanics if Newtonian behavior and steady, laminar flow with no slip at the wall are assumed. Many fluids show excellent agreement with the Poiseuille equation but Poiseuille himself discovered that complex fluids such as blood do not necessarily obey the law that he developed (~).
a given tube, the flow rate was not proportional to the fourth power of the tube diameter when the pressure drop was constant, and so on. The deviations were most pronounced in small tubes (below 300
mi-0
crons), and Fahraeus and Lindqvist
(!!,2)
found it impossible to make blood flow at all through tubes less than 30 microns in diameter.It is generally accepted that the non-Newtonian behavior of blood is due to the suspended erythrocytes. The suspending plasma is found to be Newtonian. Experimental artifacts that lead to the apparent non-Newtonian behavior of plasma are discussed by Joly
(81)
and Cokelet(ll).
It is also known that the 'apparent viscosity• of blood (defined asT/y)
increases with hematocrit.The concepts set forth by Bingham on plastic flow <n,120) raised the possibility that blood has a yield shear stress. The work of Haynes (72,,2g_) has been reported to refute the yield-stress concept. Haynes worked with red cells suspended in a simple saline solution, and recent research has shown that suspensions of red cells in saline solutions do not behave the same as whole human blood
(Q,z).
Bayliss (~) has presented an extensive review of much of the work prior to 1952. An excellent survey of the blood flow litera-ture through 1962 has been published by Whitmore (140), and throughTheoretical Models
The model used to interpret the rheological behavior of nor-mal human blood, in the low shear rate region, consists of mutually attractive, flexible, disk-l~ke particles (red cells) suspended in a Newtonian fluid (plasma) of slightly lower density than the
particles. Inter-particle forces are hypothesized to exist, and the particles will reversibly aggregate at low shear rates. The aggre-gates are formed only by joining together the faces of the particles. Figure
3
shows the suggested model. The length of the aggregates\ I I I \ I \
I I I I I II
1 f I 1 1 I I
I I
,IT
Figure
3.
Red Cell Aggregate (Rouleaux).differ from a network formed from blood which previously had been subjected to a sufficiently high shear field so that no aggregates could exist.
In
the first case, the network will be similar to a collection of fibers which are more or less parallel to each other, while the second case will be analogous to a mesh of fibers which are randomly interwoven.In
addition, the length of the rouleaux formed while the blood was flowing (and hence the shear rate) will affect the nature of the network. Therefore, the rheological be-havior of blood could depend on its prior history, predominantlyshear rate, and the direction of stress. A hysteresis effect might be expected such that data taken in the direction of increasing
shear rate might differ from data taken in the direction of de-creasing shear rate. This has not been found to be the case, and in sufficiently large tubes the shear stress-shear rate relation for blood is unique.
red cells are drawn into a central core by some hydrodynamic force and are thus surrounded by an annulus of plasma. Maude and
Whit-more (2Q) claim that radial migration can be the result of a
mechan-ical effect, and base their theory on the earlier work of Vand (133).
Rubinow and Keller (115) derived an equation for the magnitude of
the hydrodynamic force on the particles and found that for a material
such as blood, the force is always toward the axis when the blood
flows through a horizontal tube. Saff'man (116) also found
theoreti-cal evidence for a hydrodynamic force normal to the tube axis for
the flow of particles in a tube. Goldsmith and Mason (~) predict
that particles will migrate only if they are deformable, and found
no migration for rigid polystyrene spheres at low Reynolds Numbers
but did find migration at higher shear rates. Sutera and Seshadri
(129), however, do find radial migration for rigid polyethylene
spheres. Also, Segre and Silberberg (122,123) found radial
migra-tion using rigid spheres of polymethylmethacrylate, but the particles
near the axis migrated away from the centerline while particles near
the wall migrated toward the axis. An annulus of particles was
eventually formed with clear fluid near the wall and at the tube
center.
Axial streaming has also been used to explain the phenomenon
called 'plasma skimming' (the decrease in hematocrit often observed
claimed that the plasma skimming effect in branching vessels is a
direct result of radial migration.
Recent investigations have cast some doubt on the existence
of any hydrodynamic radial migration of red cells. Bloch (12),
using both regular and high speed microphotography, found that red
cells often came into contact with the vessel walls. While regular
speed photography indicated streamlined flow and an apparently
lower concentration at the wall, Bloch suggests that this is an
op-tical illusion caused by the averaging ability of the human eye.
His high speed photography clearly shows that no marginal layer
exists.
Bayliss
(2)
tried to relate changes in concentration withtransmittance of light through the tube. Bayliss came to the
con-clusion that the light transmittance was not as large as would be
expected if the red cells had entirely left the tube wall. Bennett
(~) has recently reported an experiment in which he caused blood to
flow through a rectangular channel and observed the proximity of the
red cells to the lower wall by means of an interference microscope.
He claims a resolution of 0.04 microns. In this geometry he finds
a region near the wall with a reduced concentration but no
cell-free plasma zone. He also finds that the majority of cells near
Bennett made his observations on the lower surface of a horizontal
channel and sedimentation may have affected his results.
Interpretation of Rheological Data
From a force balance on an element of fluid flowing through
a circular tube in steady, uniform flow, the shear stress at any
point, for a continuous fluid, may be expressed as:
(1)
In particular, the shear stress at the wall may be expressed as:
(2)
Equations (1) and (2) are valid whether or not the fluid is
Newton-ian. Also, for a Newtonian fluid we can note the following
re-lations:
1) T
=
~y at any point in the tube. (3)2) The shear rate at the wall can be written:
(4)
3) Poiseuille's law holds.
4)
Velocity profiles are geometrically similar and5) The viscosity coefficient can be written as:
#J.
=
y TT
w
TTst:PR
4and is a constant for all experimental values of
/::P, Q, R, and L.
(5)
If, for a given tube, the flow rate is not directly prop
er-tional to the pressure drop, Poiseuille's law is not being obeyed.
The first possibility is that the fluid is non-Newtonian, but that
a unique relation exists between the shear stress and the shear rate.
That is, T
=
f(y). This can be checked in the following way. For anon-Newtonian fluid, Equation (2) is valid and the shear stress at
the wall can be calculated. It can also be shown that if a fluid
satisfies the relation Y
=
f(T), then:f(T) dT (6)
and from Equation
(6),
the shear rate at the wall can be written as:Y.
=
8Q
(3 + N)w
TTD3
(7)where N
=
~ ~ ~
.
Thus, if the fluid is indeed non-Newtonian in0
6PR
stress, then plots of 'X
=
~3
(3 + N) versus 7:= -
mustco-w TTR w 2L
incide for all values of the tube radius R; that is, different tube
sizes. If the plots do not coincide, then there is no way to
cal-culate the wall shear rate solely from pressure drop-flow rate data.
It can also be shown that an equivalent method for testing the
re-lation T
=
f(y) is to plot Q/R3 versus T , since the integral inw
Equation (6) is only a function of the limits for any fluid that
obeys the relation Y
=
f(T,only). These plots should also coincidefor tubes of various diameters and lengths
(74,84).
If experimental flow curves, plotted as Q/R
3
versus T , dow not coincide for tubes of various sizes, and the fluid is a
homo-geneous fluid (not a suspension), there are two possible explanations
for this behavior:
1) There is slip at the wall (112).
2) Thixotropy exists. That is, the shear rate is not
only a function of shear stress but also a function
of time.
If the Q/R3 versus -T curves do not coincide and the fluid is
w
a suspension, four possible explanations exist:
1) There is slip at the wall.
2) The shear rate is not only a function of shear
3) An anisotropic condition exists due to a plasmatic
zone caused by axial streaming. In this case, the
shear rate is not only a function of shear stress
but also a function of radial position.
4)
The flow may be non-homogeneous and not strictlylaminar. Due to the presence of solid particles,
the idealized analysis of infinitesimal layers
sliding over each other may not hold, and the shear
stress may not be rigorously expressed by Eqn. (1).
The preceding analysis of capillary flow has assumed that end
effects and kinetic energy effects are negligible. These phenomena
have been investigated in detail for Newtonian flow (41,42,107) and
the appropriate corrections can be made. The corrections that must
be applied depend both on the nature of the fluid (127) and the
shape of the ends of the capillary tube
(2).
Both the kinetic energycorrection and the end effect correction are negligible if the
length-to-diameter ratio of the capillary is greater than about 100. Thus,
by making measurements using capillaries of the same diameter but
different length-to-diameter ratios, the importance of these effects
can be calculated. If plots of Q versus
~/L
(or Q/R3 versus rw)are the same for all L/D ratios, then the viscous pressure drop is
much larger than losses due to other causes. It is important to
cell, the analysis for steady, homogeneous, laminar flow may not be
valid. Thus, at some small tube diameter, deviations between Q/R3
versus T plots are likely to appear, but it can be a mistake to
w
associate the deviation with kinetic energy or end effects.
Blood Suspension Stability
An important aspect of the behavior of human blood that is
closely related to its rheological properties is its suspension
stability under no-flow conditions. The erythrocyte sedimentation
rate (ESR) is widely used in clinical applications and the results
have generally been related to the diagnosis of disease or plasma
abnormalities (102).
0
Fahraeus (~) was the first to examine the factors active in
the sedimentation of red cells in plasma. He determined that
sedi-mentation is preceded by aggregation of the individual cells into
rouleaux. He also concluded that the aggregation of red cells and
the subsequent rate of sedimentation are affected by 1) hematocrit,
2) the type and amount of individual protein fractions in the plasma,
3)
the fat content of the blood,4)
the temperature of the plasma,5) the physical dimensions of the equipment (usually a hollow tube)
used for the determination,
6)
the degree of deviation of the tubefrom a vertical position, 7) the anti-coagulant used, and 8) the
In the Rourke-Ernstene method (114) of determining ESR, the
sedimentation tube is closed at one end and has a length of 120 mm,
and internal diameter of 4.0 mm and is graduated in 2 mm divisions
from 0 to 100 mm. The volume of blood used is about 1.2 ml. Heparin
solution is used as the anticoagulant, and the test is usually
started within six hours after withdrawal from the patient.
Obser-vations of the red cell-plasma interfacial height are made at
regu-lar intervals during the first hour, and the rate of sedimentation
is determined from the steady state slope of the curve relating the
interfacial height with time. The normal range is from 3 to 21 mm
per hour. Other methods used to measure ESR record the cell-plasma
interfacial height only once, at the end of one hour, and thus do
not give a true steady state rate of sedimentation.
The sedimentation curve appears to be divided into three
sections:
l) An initiation period, where little or no settling
is observed. Microscopically, the red cells observed
during this period appear to be in the process of
aggregation and rouleaux formation.
2) A steady state sedimentation period, when the interface
drop per unit time is constant. Rouleaux and
aggre-gates of rouleaux are seen to travel downward, usually
simultaneously displaced upward around the
descend-ing red cell structure
(93).
3) A leveling-off period, where the sedimentation rate
decreases. Here, the influence of the packed cells
in the bottom of the tube becomes important, and the
sedimentation eventually ceases.
Attempts made to obtain quantitative information on particle
size from sedimentation tests usually involve the use of Stokes'
equation for the behavior of a sphere in an infinite fluid
(44).
However, since the normal volume fraction of solids is about
0.45,
this model must be modified. Hardwicke (§2,70,71) has correlated
the sedimentation rate with plasma composition. Using steady state
sedimentation rates, he normalized them for differences in specific
gravity between the red cell and plasma and also considered the
viscosity of the plasma. Hematocrits were constant at
0.30.
Usingover two hundred separate samples under these controlled conditions,
he was able to demonstrate that:
1) A linear relation exists between the steady
state sedimentation rate and the concentration
of macromolecules, especially fibrinogen.
2) Sedimentation can be positively correlated with
plasma viscosity, since an increase in plasma
concentration of aggregating macromolecules.
3) The use of a single one-hour observation to
measure rates is unreliable and does not correspond
well with either the steady state sedimentation
rate or protein concentration.
The third observation is most important to any rheological
study, and casts doubts on the results of those workers who use the
one-hour method to obtain their data.
Effect of Tube Diameter on Blood Rheology
Theoretical Considerations
Rigid Particles
As the diameter of a capillary tube containing flowing blood
is decreased, the particulate nature of blood must be recognized.
The assumption of a continuous fluid is no longer valid, and the
apparent rheological properties of blood may become a function of
the tube diameter. Any limiting process such as integration is no
longer valid and in fact, the Navier-Stokes equation may not apply
to flow in a tube containing particles the same order of magnitude
in size as the tube diameter. Numerous investigators insist on
solving the equation of motion, neglecting the inertial terms, for
Ladenburg (86), Faxen (47), Bohlin (14), Happel and Byrne (67), and Wakiya
(!,3.2)
have dealt with the case of a single sphere in a circular tube and obtained approximate formulas for the drag. Haberman and Sayre (64) obtained more accurate and extensive results for the drag in this case, and they developed an exact solution in the form of an infinite series of solutions of the slow viscous flow equations.The interaction between two or more rigid spheres moving in an infinite medium has been treated in a general way by Kynch
(85),
and Brenner (18) has given some general formulas for drag in multi-particle systems. Happel and Brenner(68)
have obtained approximate results for two spheres and also reviewed the work of other inves-tigators. Stimson and Jeffery (126) obtained an exact solution to the problem of two spheres moving with constant velocities along their line of centers. Rubinow and Keller (115) considered the prob-lem of a rotating-translating sphere in an infinite fluid. They de-rived an equation for the force normal to the direction of trans-lation.It is assumed that the fluid is Newtonian and that the motion is
sufficiently slow so that the inertial terms in the equation of
motion can be neglected. They derived solutions in the form of
infinite series whose rate of convergence depends on the ratio of
the particle diameter to the tube diameter. Particle spacing, from
adjacent particles touching to a maximum spacing of twenty tube
diameters, was a parameter. They found that as the tube size
ap-proaches the size of the particle, the pressure drop along the tube
becomes infinite.
Bloor
(!l)
computed streamlines and pressure gradients fora line of axisymmetric disks. The disks almost completely filled
the capillary tube cross-section. Numerical solutions were obtained
for the flow between disks.
These models may apply to rigid particles but certainly do
not describe the flow behavior of flexible red cells in a tube. The
fact that the red cells can pass readily along capillaries whose
dia-meters are smaller than the red cell's major diameter, and often
enter these capillaries through openings even more restricted, shows
that the red cells can be easily deformed. Actually, the red cells
pass through the capillaries in single file and it seems probable
that very little plasma is needed to lubricate their motion, so it
should be possible for them to flow in such vessels with relatively
Flexible Particles
In photometric studies of red cell motion through capillaries
in a cat mesentery, long trains of red cells are seen, with very
little space between the cells for plasma (137). In other situations
the red cells seem to be individuals with a volume of plasma at
least equal to that of the red cell between each pair of red cells.
Benis
(£)
qualitatively investigated the flow of whole bloodthrough tubes less than 100 microns by visual observation through a
microscope. He found that in tubes with inside diameters of about
40 microns, some red cells adhere to the tube wall but the flow
could be maintained for long periods of time without plugging.
Vel-- -1
ocity profiles were very flat for U's of the order of 1 sec In
tubes with inside diameters of about 10 microns, the red cells
passed through the tube in "convoys" separated by clear liquid,
The red cell faces were perpendicular to the direction of flow. The
"convoys" contained up to
30
cells and all cells in a "convoy" weredeformed in the direction of flow, apparently due to viscous drag
at the tube wall.
A theory was formulated by Whitmore (142) which applies to
capillary tubes approximately
8
to 16 microns in diameter. Thetheory, based on the earlier work of Thomas {131), incorporates the
idea of the red cells forming a semi-solid core when flowing in tubes
through tubes whose diameter is comparable to the dimension of the
cell. The theory predicts that blood should exhibit a minimum
hematocrit (and therefore a minimum apparent viscosity) when
flow-ing through a vessel with a diameter between
8
and 16 microns. Oneimportant implication of the theory is that the mean velocity of a
red cell is inversely proportional to its diameter--large red cells
move more slowly.
In
humans,5%
of the red cells vary in diameterby more than 1 micron (142) and there are also variations in
flexi-bility. Thus, this mechanism may explain the fact that in small
vessels the red cells usually travel as groups of 10 or more
in-stead of as individuals. In a small vessel, explains Whitmore,
large or rigid cells will travel more slowly than average cells.
The small cells will try to travel faster than the average cells,
so that groups of cells headed by a large or rigid cell and tailed
by a small cell should break up into separate groups.
When blood flows through capillaries that have an inside
di-ameter less than
8
microns, the red cells must be deformed in orderto pass through the tube. In tubes with inside diameters between
8
and about 16 microns, the red cells will deform due to viscousstresses.
In
both cases the magnitude of the deformation of a redcell should depend on the magnitude of the viscous stresses, and
therefore on the velocity or pressure gradient in the tube. The
since the additional pressure drop due to the particle depends on
its shape, the shear stress-shear rate relationship may depend on
tube diameter as well as shear rate. Again, such a dependence does
not clearly prove that the continuum model has failed.
A theory of flexible particles was developed by Lighthill
(§2), based on lubrication theory and a linear shear stress-strain
relationship for the red cell membrane. The theory was improved
quantitatively by Fitz-Gerald (48,~). In lubrication theory, the
Reynolds Number based on film thickness is assumed small enough so
that the inertial terms in the equation of motion can be neglected.
The other approximations are those of boundary-layer theory. The
pressure is taken to depend on the axial coordinate only and does
not vary across the layer. Also, the lubrication film thickness is
taken to be much smaller than the reference radius so that a
two-dimensional cartesian coordinate system can be used.
The following results were found. The increased pressure per
red cell varies as the square root of
u,
not asU
in the Stokesequation. Another result is that at very low velocity the
clear-ance between the red blood cell and the capillary wall would become
small enough so that the lubricating layer would break down and the
red cell would come into direct contact with the wall. Any further
motion of the red cell would be impeded by static or dynamic