Rochester Institute of Technology
RIT Scholar Works
Theses Thesis/Dissertation Collections
8-1-2011
Personalized print in Europe
Jeanette BredstenFollow this and additional works at:http://scholarworks.rit.edu/theses
This Thesis is brought to you for free and open access by the Thesis/Dissertation Collections at RIT Scholar Works. It has been accepted for inclusion in Theses by an authorized administrator of RIT Scholar Works. For more information, please contactritscholarworks@rit.edu.
Recommended Citation
Personalized Print in Europe
By Jeanette Bredsten
A thesis submitted in partial fulfillment of the requirements for the degree of Master of Science
in the School of Print Media
in the College of Imaging Arts and Sciences of the Rochester Institute of Technology
August 2011
School of Print Media Rochester Institute of Technology
Rochester, New York
Certificate of Approval
The State of Personalized Print in Europe
This is to certify that the Master’s Thesis of
Jeanette Bredsten
has been approved by the Thesis Committee as satisfactory for the thesis requirement for the Master of Science degree
at the convocation of
August 2011
Thesis Committee:
__________________________________________ Primary Thesis Advisor
__________________________________________ Secondary Thesis Advisor
__________________________________________ Graduate Thesis Coordinator
Acknowledgments
First, I would like to thank the Aller Foundation and its Board of Directors for
giving me the opportunity to graduate with a Master of Science degree in Print Media
from The Rochester Institute of Technology. I am forever grateful for your support.
Second, I would especially like to thank and recognize Dr. Patricia Sorce for her
knowledge and expertise in the field of personalization as well as her passion, sincere
interest, endless encouragements and outstanding support throughout the process of
completing my Master’s thesis. Dr. Twyla J. Cummings, thank you for your support,
valuable advice and encouragement. Third, I would like to sincerely thank the
International Federation for Printing and Allied Industries (Intergraf) for their help
distributing the online survey. A special thanks to Håvard Grjotheim, President of
Intergraf, Béatrice Close, General Secretary of Intergraf and Anna Bask, Communication
and Public Relations Officer at Intergraf.
Pierre Urbain, Simon Mühlemann, Ishtar Laguna and Mariella
Rodríguez-Adames: I would like to thank you for your valuable support with translations.
I would also like to thank Dealva Jade Dowd-Hinkle, Dr. Scott Williams and
members of the graphic arts industry in Europe for their valuable insight and suggestions.
Finally, I would like to thank my family and friends for their encouragement and
Table of Contents
Acknowledgments ... iii
List of Tables ... vii
List of Figures... viii
Abstract... ix
Chapter 1: Introduction and Statement of the Problem ... 1
Topic Statement ... 1
Background and Present Significance of Topic... 1
Reason for Interest in Topic... 2
Chapter 2: Literature Review... 3
Background Literature ... 3
Definition of Personalization... 3
Amount of Personalized Printing in the US... 6
Complexity of Personalization... 9
Europe ... 11
The Printing Market... 11
Size of Digital Printing Market... 12
Amount of Personalized Print in Europe... 12
Conclusion ... 16
Chapter 3: Research Objectives ... 18
Research Questions... 18
Chapter 4: Methodology... 19
Sample... 19
Procedure ... 19
Questionnaire ... 20
Comparing Europe to the US... 21
Statistics ... 22
Chapter 5: Results... 23
Respondents ... 23
Amount of Personalized Print... 25
Percentage of Personalized Print in Terms of Total Annual Revenue ... 26
Percentage of Personalized Print from Digital Revenue... 27
Level of Personalization ... 28
Challenges to Overcome ... 31
Comparing Europe to the US... 32
Personalized Print ... 33
Challenges ... 34
Chapter 6: Discussion ... 37
Summary of Results... 37
Respondents ... 37
Personalized Print in Europe ... 37
The US Compared to Europe... 38
Discussion ... 39
Reflection... 42
Limitations ... 43
Agenda for Further Research ... 44
Chapter 7: Bibliography ... 45
Chapter 8: General References... 47
Appendix 1: List of countries and member federations in Intergraf... 49
Appendix 2: English Survey... 51
Appendix 3: German Survey ... 60
Appendix 4: Spanish Survey... 69
Appendix 5: French Survey ... 78
Appendix 6 Currency Exchange Rates ... 87
Appendix 7 Mix of Personalization in Europe and the US ... 88
List of Tables
Table 2.1 Definitions of personalization... 4
Table 2.2 Demand for and use of personalization by marketers in the US ... 7
Table 2.3 Use of personalization by marketing executives (Sorce, 2009)... 8
Table 2.4 Turnover (billion €) (Intergraf, 2010)... 12
Table 5.1 Size of company based on number of employees (n = 34)... 24
Table 5.2 Distribution of annual revenue by printing process (n = 29)... 24
Table 5.3 Annual revenue from personalized print jobs in 2010... 26
Table 5.4 Personalized Print from Digital Revenue ... 27
Table 5.5 Top five challenges for producing personalized print ... 32
Table 5.6 Amount of personalized print by region ... 33
Table 5.7 Mix of personalization by region... 34
Table 5.8 Challenges printers face by region... 35
Table A.6.1: Yearly Average Exchange Rates for Converting Foreign Currencies into U.S. Dollars (Internal Revenue Service)... 87
Table A.7.1 Mix of personalization by region... 88
List of Figures
Figure 2.1. Printing and Personalization in the US... 6
Figure 5.1 Distribution of digital revenue (n = 29)... 25
Figure 5.2 Percentage of revenue from personalized print jobs ... 27
Figure 5.3 Percentage of personalized print from annual digital revenue ... 28
Figure 5.4 Impact on revenue by level of personalization... 29
Abstract
This study focuses on the amount of personalized print produced by printing
companies in Europe, the challenges these printers are facing when producing
personalized jobs, and how the market for personalized printing in Europe differs from
that in the US.
Personalization is a marketing tactic in which various media channels are used to
send a personalized message to a consumer or client based on their interests.
Personalization is not a new tactic. The use of personalization has been slowly increasing
over the past few decades to become one of the key tactics used capture a customer’s
attention. Personalized print—one media channel that can be used in the marketing
mix—is divided among different applications such as mail merge, transactional print,
versioning, moderate personalized print and highly personalized print.
An online survey was distributed to printing companies across Europe via the
International Confederation of Printing and Allied Industries (Intergraf). A total of 37
printing companies participated in this study.
Survey results revealed that, on average, 6.6% of participants’ revenue came from
personalized print in 2010. The level of personalization most companies (35%) listed as
their major source of revenue was mail merge. The top five challenges that participants
• Communicating the value to our customers of the ROI (Return on
Investment) benefits of personalization (45%).
• Poor data quality on the client side (30%).
• Ability to work with client’s marketing decision makers (30%).
• Clients do not have retention or customer relationship strategy (30%).
• Merging the client’s database with variable data software (15%).
Though the low response rate from the study restricted the ability to generalize
results, an examination of the sample differences revealed that the average amount of
revenue obtained from personalized print was over 50% lower in Europe (6.6%) than in
the US (20.9%). Note that the data from the US was based solely on digital printers. In
Europe, personalization was reported to average around 31.4% of printers’ digital
revenues, but this data point was from an even smaller sample and the author questions
its reliability. The level of personalization that most printing companies indicated,
generated a major part of revenue was mail merge, both in Europe (35%) and in the US
(61.4%).
Lastly, the top challenges, were similar for both the US and Europe. These
included:
• Communicating the value of personalization.
• Poor data quality on the client’s side.
One explanation for the differences between the US and Europe is buyer
most countries in Europe. This could be one of the reasons, that Europe produces less
Chapter 1:
Introduction and Statement of the Problem
Topic Statement
The digital printing market in Europe is estimated to grow by 71% from 2008 to
2013. The electrophotography market alone is estimated to grow by 73% in the same
period (PIRA, 2010). This indicates that there is growth potential for European printing
companies in the digital printing market.
Research on personalization as a marketing tactic and the production of
personalized print in the US have both been examined. Research in 2004 indicated that
on average, 20.9% of digital printers revenue comes from personalized print jobs (Sorce
& Pletka, 2004).
In Europe, there has been little focus on research and only minor investments in
R&D in the graphic arts industry (Intergraf, 2007). There is a need for more research in
the European printing industry. This thesis will investigate the amount of personalized
print produced by European printing companies, thereby adding knowledge to the global
field of research on personalized print.
Background and Present Significance of Topic
Research has been conducted to investigate the demand, implementation and
personalized direct mail (Sorce, 2009). While most of the research being done has
focused on the US, this thesis asks: What about Europe? How much personalized print is
being produced, and what challenges are European printers facing producing
personalization?
Reason for Interest in Topic
The researcher holds a bachelor of honors from the University of Wolverhampton
in the United Kingdom and has two years experience as a graphic designer and pre-press
operator for a Norwegian printing company. She has always wanted to see the ‘bigger
picture’ and know more about the industry. This led her to pursue an MS in Print Media
with a minor concentration in International Marketing.
After investigating the research being done in the US and seeing the
corresponding lack of research on the use and adoption of personalization in the
European market, the researcher was led to investigate the adoption for personalized print
Chapter 2:
Literature Review
Background Literature
In this chapter, the researcher will review different definitions of personalization,
the various complexity levels of personalization applications, and the amount of
personalized print in the US. In addition, the size of the European printing market, the
amount of personalized print, and some of the challenges for European print service
providers will also be reviewed in this chapter.
Definition of Personalization
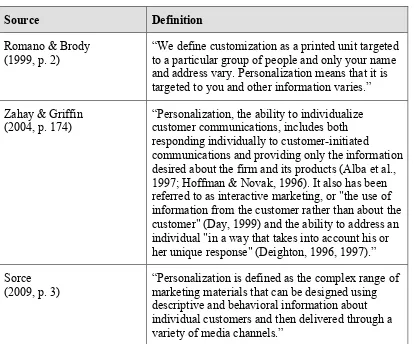
Leaders in the field have defined personalization in several different ways. The
following is an overview of these different points of view (see Table 2.1 for exact
wording).
Romano and Brody (1999, p. 2) defined personalization as a message “targeted to
you and other information varies.” In the article Customer Learning Process, Strategy
Selection, and Performance in Business-to-Business Service Firms, Alba et al. (as cited in
Zahay & Griffin, 2004, p. 174) defined personalization as “the ability to individualize
customer communications, includes both responding individually to customer-initiated
communications and providing only the information desired about the firm and its
therefore, personalization can therefore be seen as an interactive communication method
from one part to another and vice versa with a “specialized flow.”
Sorce (2009, p. 3) defined personalization as a tactic used in marketing
communication, where personalization is a “complex range of marketing materials that
can be designed using descriptive and behavioral information about individual customers
[image:16.612.104.518.305.649.2]and then delivered through a variety of media channels.”
Table 2.1 Definitions of personalization
Source Definition
Romano & Brody (1999, p. 2)
“We define customization as a printed unit targeted to a particular group of people and only your name and address vary. Personalization means that it is targeted to you and other information varies.”
Zahay & Griffin
(2004, p. 174) “Personalization, the ability to individualize customer communications, includes both responding individually to customer-initiated
communications and providing only the information desired about the firm and its products (Alba et al., 1997; Hoffman & Novak, 1996). It also has been referred to as interactive marketing, or "the use of information from the customer rather than about the customer" (Day, 1999) and the ability to address an individual "in a way that takes into account his or her unique response" (Deighton, 1996, 1997).”
Sorce (2009, p. 3)
Henrikke Korhonen, Service Director for Fonecta (a company located in Finland),
said in an interview with Hansaprint’s magazine, “personalization is about talking to
people in a target-group-oriented way, with messages varied according to recipient’s
characteristics” (Hansapress, 2010, p.28).
A common theme among these definitions is that personalization is seen as a
marketing tactic or communication tool where the goal is some sort of response from the
receiver. Information about the customer or target group is analyzed and used to create a
unique message, which is then delivered through various media channels. The channels
can include print, the web, mobile devices or other media channels that support variable
data.
Personalized print is one of the media channels used for personalization. It can be
integrated with other media or stand on its own.
However, in order to be effective, the personalized message has to be relevant and
include more than a name and address. According to Pellow et al. (2003),
“personalization only has value if the individual views it as relevant” (p. 5). Printed
marketing material with the customer’s name and/or address is no longer unique and
personal, because everyone else is getting the same message (S. Scholl, personal
Amount of Personalized Printing in the US
In 2010, the size of the printing market in the US was estimated at $131 billion.
The digital printing market alone was estimated at $26.2 billion, which is a 6% increase
from 2009 (Davis, 2011).
Sorce and Pletka published a monograph in 2004 entitled Digital Printing Success
Models: Validation Study, where they surveyed 162 digital printers. On average, 20.9%
of the printers revenues came from personalized printed jobs (variable data print jobs).
Eighty-five precent indicated that, in terms of the mix of personalization, mail merge was
[image:18.612.137.514.390.693.2]a major part of their revenue (Sorce & Pletka, 2004).
Figure 2.1. Printing and Personalization in the US
Print Market 2010 valued by shipments
$131 billion
Digital Print Market 2010 valued by shipments
$26.2 billion
Personalized Print 2004 On average 20.9 % of digital printers revenue comes from personalized
The research in the US has focused on marketing executives, advertising agencies
or both. Surveys have analyzed the use and demand for personalization within these
industries. Table 2.2 lists the demand for and use of personalization by marketers in the
US.
In 2007, marketers spent an estimated $58.4 billion on direct mail advertising
(CMO, 2008). According to the Direct Marketing Association (DMA), spending on direct
mail advertisements was over half (54.3%) of the total US advertisements spending in
[image:19.612.108.525.373.672.2]2009 (Print in the Mix).
Table 2.2 Demand for and use of personalization by marketers in the US
Year Source Personalization
2002 Direct Marketing Association
(DMA)
62% of DMA members use
personalization for Postal and Email marketing
2003 Pellow & Sorce 33% average of campaigns used
personalization.
18% was highly personalized
2007 Direct Marketing Association
(DMA) 71% of direct marketers indicated that personalization was the most frequent
marketing tactic they used.
2008 InfoTrends 68% of marketers used
personalization
2009 Direct Marketing News (DMI) 40% of direct marketers said that
The marketing industry is not the only industry that has been surveyed about
personalization. According to The Industry Measure, 27 % of creatives (such as graphic
designers, etc.) worked with personalization in 2006.This was a decrease from 2004,
when 38% indicated that they had worked with personalization. Magazine publishers also
use personalized print. The Industry Measure survey in 2006, showed that personalized
print was used by 15% of the magazine publishers surveyed, and 58% said that they had
made use of customized covers (versioning) (as cited in Sorce, 2009).
When analyzing the usage of personalization by marketing and advertising
agencies, there has been a steady increase in the use of personalization over the years.
(Data from a 2007 study gave no indication that personalization was an increasing trend
in the US) (Sorce, 2009, p. 43). Table 2.3 compares marketing executives use of
[image:20.612.103.548.474.641.2]personalization in 2003 and 2008 from two different studies.
Table 2.3 Use of personalization by marketing executives (Sorce, 2009)
Printing Industry Center 2003
“Percentage of campaigns annually that involve personalization”
CMO 2008
“To what extend does your company currently use personalized
communications in its customer acquisition and relationship development programs?”
0-19% of campaigns 39% Low 44%
20-59% 38% Moderate 39%
Complexity of Personalization
In previous research, leaders in the industry have defined different levels of
personalization, with different definitions.
The research done by Brody and Romano in 1999 identified three levels of
personalization; variable:
• Text.
• Data.
• Image.
Research from the Printing Industry Center in 2003 divided personalization into
five complexity levels (Pellow, Sorce, Frey, Olson, Moore, & Kirpichenko, 2003):
• Variable address and/or salutation.
• Variable address and/or numerical information in fixed fields.
• Variable address, text, and numerical information in dynamic fields.
• Variable text or numbers and graphics.
• Variable text or numbers and variable graphics.
Sorce and Pletka (2004) defined six levels of personalization in Digital Printing
Success Models: A Validation Study:
• Versioning: design not personalized for each customer, but rather for each
group of customers.
• Mail merge: only name and/or address is variable.
• Transaction printing: business letters, for example a bank statement,
created for each individual.
• Internet on-demand: using a template where authors can personalize some
core elements of design, such as photographs and event details.
• Fully customized communications: each element is variable in
newsletters, brochures and other documents. Stored data in a customer
database is used to produce unique marketing materials.
InfoTrends (2006) conducted a study on The Future of Mail and denoted three
complexity levels of personalization:
• Not personalized at all (except for name and address),
• Limited, and
• Highly personalized.
In 2007, four complexity levels of personalization were used in The Industry
Measure study, Variable Data Printing/1:1 Personalization:
• Simple mail merge,
• Full-color with variable images and text,
• Pre-printed offset shells, and
• Versioning.
Based on the previous research, five levels of personalized print were indentified
• Versioning. Not personalized for each individual, but variations for
groups (i.e. different versions of a newspaper cover depending on
geography).
• Mail merge. Only name and/or address is variable.
• Transactional printing. Includes “transpromo” (i.e. credit card
statements personalized for each individual that possibly include other
promotional information)
• Moderate personalized print. Variable text and images based on
consumer information.
• Highly personalized print. Variable text, images, colors and data based
on consumer information, (i.e. data based on previous purchases,
likelihood of point of purchase, demographics and consumer preferences).
Europe
The Printing Market
With 850,000 people employed in the printing industry and 134,000 companies
spread over twenty-nine countries, the European printing industry had an estimated
turnover1 of around €100 billion in 2009. This industry consists of many small
Table 2.4 Turnover (billion €) (Intergraf, 2010)
2005 2006 2007
European Union 101.3 105.9 106.8
Norway 1.4 1.4 1.5
Switzerland 4.1 4.1 -
1Revenue from printing and service activities related to printing
In 2008, the printed trade advertising materials market (excluding commercial
catalogues) was €15.7 billion for the European Union (EU), a slight decrease from 2007
when the market was €16.6 billion. In Norway, which is not a EU member, the size of the
market was €118.7 million in 2008, a dramatic €32 million decrease from 2007
(Intergraf, 2010).
Size of Digital Printing Market
The digital printing market in 2008 was €15.8 billion. This is 10.6% of the total
printing market in Europe. PIRA (2010) estimates that the digital market in Europe will
grow to €27.1 billion in 2013, with a 17.6% market share.
The electrophotography market in 2008 was €11 billion, and is estimated to grow
73% to €19 billion in 2013 (PIRA, 2010).
Amount of Personalized Print in Europe
The International Confederation for Printing and Allied Industries (Intergraf)
(2008) produced a white paper highlighting the advantages of working with the European
future, and one of the clearest examples of this is the introduction of personalization. This
white paper did not mention how much personalized print is being printed in Europe.
Even though there is no record of the total amount of personalized print in
Europe, there are companies that produce personalized print.
Pitney Bowes, a business-to-business (B2B) company that delivers “software,
hardware and services that integrate physical and digital communications channels”
(Pitney Bowes), did a survey in March 2010 on the use of transactional promotions,
which are one aspect of personalized print. They surveyed 1,000 B2B companies in
North America, Germany, France and the UK. The survey revealed that 34% of the
European companies had used personalized promotions on their transactional documents,
while 31% of the US companies had also used “transpromo” (Pitney Bowes, 2010, p. 2).
The results of this survey show that personalized print, at least on a transactional level, is
being produced in both the US and in Europe, and therefore the markets might not be that
different.
Companies such as the global printing company Elanders, which has printing
plants in Norway, Germany, Hungary, Sweden, Italy, Poland and the United Kingdom,
offer personalized printing in the forms of versioning, transactional printing and photo
books (Elanders). Hansaprint, a large printing, marketing and communication company
that is mainly located in Finland, produces personalized print and also promotes
personalization as a marketing tool to their new and current customers (Hansaprint).
Opportunities and Threats for the European Printing Market
According to the PIRA’s 2010 forecast, the digital printing market in Europe will
grow in the future. Printers in Europe are also positive towards the “value-added
services” trend and are willing to change the way they do business by “modify[ing] their
relationships with their customers by making more value-added services proposals”
(Intergraf, 2007).
These two articles, along with the articles and case studies discussed above,
indicate that there are opportunities for the use of personalization in the European market
and that Europe has adopted this marketing tactic to a varying degree.
Challenges
One of the structural, strategic challenges the printing industry in Europe has to
undergo is to “mutate from a commodity industry to an added-value industry” (Intergraf,
2007). Another one of the challenges in the market is to “be[come] closer to key clients
and improv[e] customer relationships, management tools and personalization supports”
(Intergraf, 2007).
The printing industry in Europe does not invest heavily in research and
development (R&D), which could put structural innovations within the industry at risk
(Intergraf, 2010).
Another threat in the European market is that there is no general data protection
and marketing law in Europe that all the countries in Europe must follow. Each country
personal information in direct mail for a global European company difficult, confusing
and time consuming. Each country’s laws should be within the framework that the Data
Protection Directive (95/46/EC) established for general conditions for the processing
(collection and use) of personal data, but there are be national differences. However, all
companies in the EU can use “personal information about their customers/clients to target
messages to them, as long as such processing of data is in line with the general principles
of ‘fair and lawful processing. … The actual sending of the messages, however, is subject
to a jungle of differing regulations” ” (G. Brandau, personal communication October 9,
2010).
The consumer also has to have the option to “opt out” in many of the European
countries (FEDMA, 1999). For example, in Denmark companies also have to tell
consumers why they want to use their personal data and for what purpose. The consumers
also have to agree (opt-in) to let the company use their information (Prosa, 2000). A
Danish company can therefore use personalization in their marketing, but they are not
allowed to store data if it is not going to be used for a purpose, such as direct marketing.
Technology-driven personalization was the topic of The Future of Marketing
Virtual Conference Part II, which took place in March 2011. Sixty marketing experts
shared their thoughts and ideas regarding personalization. This conference is an
indication that this is a current topic and that the demand for personalization is present in
the market. However, the conference also revealed that marketers don’t have the full
knowledge of how to “capitalize on it fully,” and they do not know how it will “evolve in
As discussed previously, Europe has intricate marketing legislations with laws to
protect consumer data. Consumers in most EU countries have the choice to opt-in, which
means that they can choose to receive messages from the company based on the data the
company has about them. In the US, privacy is becoming a central legislative issue, and
as a result there is a proposal for a new bill in the Congress: the Commercial Privacy Bill
of Rights, proposed by Senator Kerry (2011):
“The purpose of the legislation…is not to discourage information sharing, but to encourage it – but under a common code of conduct that respects the rights of both the people sharing their information and legitimate organizations collecting and using it on fair terms and conditions” (Senator Kerry, March 16, 2011).
Senator Kerry is not the only one addressing this issue in the US. The Federal
Trade Commission (FTC) and the U.S. Department of Commerce have both published
white papers with recommendations for frameworks to help protect consumers while also
making consumers more aware of their rights and options (Haase, 2011).
Conclusion
Personalization is a marketing tactic where the goal is an interactive two-way
communication between the company and the customer. Information about the customer
is analyzed and used to create a unique message, delivered through various media
channels targeted to the consumer’s usage habits. Personalized print is a marketing tactic
where print is the media channel that delivers the message to the consumer. Research in
the US states that 40% of direct marketers allocate 50% or more of their activities to
has been slowly increasing to become a more popular marketing tactic. Renowned
marketers are discussing it as one of the key marketing tactics for the future.
Little research is being conducted on the amount of personalized print in Europe,
although personalization has been introduced to the printing industry. The
electrophotography market is estimated to grow in the future and, according to the PIRA
forecast, direct mail will also continue to grow. This indicates a growth potential for
personalized print in the future. The leads to the central question of this research: how
Chapter 3:
Research Objectives
The researcher have analyzed the European printing market to determine the
amount of personalized print currently in use in Europe, and have also examined the
opportunities and threats for the use of personalized print as a marketing tactic in Europe.
In addition, the researcher has compared the European personalized print market with
U.S. research, conducted several years ago. (Sorce & Pletka, 2004).
Research Questions
1. How much personalized print is being produced in Europe by print service
providers?
2. What are the challenges the print service providers are facing regarding
personalization?
Chapter 4:
Methodology
Sample
The sample was selected from the membership of Intergraf (International
Confederation for Printing and Allied Industries). According to Intergraf, there are about
134,000 printing companies in Europe, and almost all of these (132,000) are within the
Intergraf system. These printing companies are represented in one of twenty-three
national printing federations, divided over 20 countries. Intergraf does not have direct
contact information for the individual companies, since they only represent the national
printing federations.
Therefore, the sample for this research was 132,000 printing companies in twenty
European countries. A list of the national member federations and the countries is given
in Appendix 1. The response rate was 0.06% (n=73).
Procedure
An online survey was distributed via Intergraf to the member federations. The
member federations were encouraged to distribute the survey to their members via email.
The email was sent to the member federations on March 25. Another email was
distributed via Intergraf to “young managers” in the graphic arts industry in Europe on
The survey was written in English and translated into Spanish, French and
German to ensure a higher response rate. Verbatim Solution translated the survey.
Contacts of the researcher from the printing industry back-translated the survey and made
necessary corrections to the different versions. To obtain accurate results, it was critical
for the questions to have the same meaning independent of the language, although some
cultural and industry term differences had to be accounted for.
Questionnaire
To determine the amount of personalized print in Europe participants were asked
about their location, number of employees, annual revenue, percentage of revenue that
came from personalized printing jobs in 2010, and level of personalization used. (The
complete survey in each language is given in appendices 2 to 5.) Five levels of
personalization complexity were identified by the researcher:
• Versioning. Not personalized for each individual, but variations for
groups (i.e. different versions of a newspaper cover depending on
geography).
• Mail merge. Only name and/or address is variable.
• Transactional printing. Includes “transpromo” (i.e. credit card
statements personalized for each individual that possibly include other
promotional information)
• Moderate personalized print. Variable text and images based on
• Highly personalized print. Variable text, images, colors and data based
on consumer information, (i.e. data based on previous purchases,
likelihood of point of purchase, demographics and consumer preferences).
Participants were asked to input annual revenues in their respective currency. The
researcher then converted these amounts into US dollars, using the average currency
exchange rates from 2010. This was done to eliminate fluctuations due to the use of
different conversion rates. For a conversion exchange list, see Appendix 6.
Comparing Europe to the US
The European results were compared to a validation study for digital printing
success models conducted by Sorce and Pletka in 2004. Sorce and Pletka defined six
types of personalization levels. In this study Internet on-demand was not included due to
the objectives of the research. Instead the researcher chose to use the term “moderate
personalized print.”
“Moderate personalized print” was defined in the survey as variable text and
images based on consumer data. Sorce and Pletka (2004) defined “personalized printing “
as “using data about the recipient, beyond name and address, to create a more relevant
offer based on demographics, lifestyle or past buying history.” (p. 4). The explanation
and meaning of the terms are similar: only the wording used is different. Therefore, the
researcher has chosen these terms as comparables.
The same reasoning has been used for “highly personalized print”—defined by
information—and “fully customized communications”—defined by Sorce and Pletka
(2004) as “[a] sophisticated publishing technique where all elements on each printed
piece, from brochure to newsletters, are dynamic and variable. This enables organizations
to create unique content for each person based on a database of information about the
person.”
Statistics
Descriptive statistics were used to describe the data collected in this research.
A univariate analysis—calculating the mean, median, minimum, maximum, and
the standard deviation—was done to infer how much personalized print is being produced
in Europe. This analysis was done for all of the respondents and for each country when
an adequate sample size was available.
Regarding the mix of personalization, the percentage was calculated for all of the
rating options—major, minor, and not at all—within the five levels of personalization.
A rating of the challenges printing companies face when they are producing
personalized printing jobs was created to obtain an overview of the most common
challenges.
The data collected in this research was compared to the US data on personalized
Chapter 5:
Results
Results are based on responses collected by April 15, 2011.
Respondents
While 72 printing companies in Europe responded, only 37 companies completed
the survey in full. The companies were from 11 different countries: Portugal (14
respondents), Malta (4), Turkey (2), Austria (3), United Kingdom (3), Sweden (3),
Norway (2), Greece (1), Denmark (1), France (1) and The Netherlands (1). (One
participant did not respond to this question, so their location is unknown). Almost all
(81% ) of these companies classified themselves as commercial printers.
To determine the size of the companies, participants were asked to provide their
annual revenue and number of employees. The annual revenue was converted into US
dollars using the average exchange rate from 2010 published by the U.S. Internal
Revenue Service by the US Government.
Three of the revenue responses were outliers and were removed from the analysis.
. Participants’ average annual revenue in 2010 was $101.43 million (n = 25). Over
three-quarters of respondents (76% of the 34 that responded to the question) had fewer than
Table 5.1 Size of company based on number of employees (n = 34)
Number of employees Percent
Less than 25 35%
26-100 41%
101-200 14%
More than 200 9%
Seventy-nine percent (n = 29) participants produce digital printing, and therefore
have the ability to produce personalized print. Table 5.2 presents the average for each
process. Examining the medians revealed that 80% of revenue was obtained from offset
printing for “typical” printers.
Table 5.2 Distribution of annual revenue by printing process (n = 29)
Process Mean Median Max Min SD
Digital 15.5% 5 80 0 24.16
Offset 65.4% 80 100 0 33.36
[image:36.612.164.481.118.252.2]Other services 19.21 10 95 0 25.61
Figure 5.1 presents the distribution of revenue from digital printing. On average,
15.5% of participants’ annual revenues were from digital printing. Of the 29 companies,
65.5% indicated that 5% or less of their revenue came from digital printing. For 27.5% of
[image:36.612.131.517.442.551.2]Figure 5.1 Distribution of digital revenue (n = 29)
Amount of Personalized Print
Of the 29 firms that produced digital print, 17 companies indicated that
personalized print made up part of their revenue. Three of the 29 reported that they did
not produce any personalized print. Four of the 29 companies did not indicate how much
of their annual revenue came from personalized print. These were categorized as 0%
personalization. Five companies did produce digital print, but did not answer the question
regarding the amount of personalized print from annual revenue. These were also
categorized as 0% personalized print for the calculations.
The researcher was not confident that the data on the amount of personalized print
were reliable, due to possible different interpretations by respondents. Respondents were
asked to indicate what percentage of their annual revenue was personalized. Four
companies seemed provide what percentage of digital print came from personalization (in
24.1%
41.4%
6.9%
0.0% 3.4%
24.1%
0.0% 5.0% 10.0% 15.0% 20.0% 25.0% 30.0% 35.0% 40.0% 45.0%
0% 1‐5% 6‐10% 11‐15% 16‐20% 21% or
more
Percentage of respondents
that the percent of personalization reported exceeded the percentage of digital print). The
researcher therefore calculated both the percentage of personalization from total annual
revenue and the percentage of personalized print from digital, see Appendix 8 for raw
data and transformations. One of the respondents was considered an outlier: The
respondent had indicated that 100% of their annual revenue came from personalized
print, but the respondent also indicated that none of their annual revenue came from
digital print (0%). Therefore the researcher was not confident that this number was
correct and treated it as an outlier, deleting it from further analysis.
Percentage of Personalized Print in Terms of Total Annual Revenue
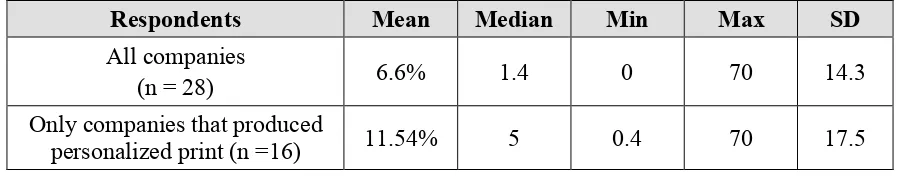
Table 5.3 reveals that an average of 6.6% (n = 28) of the companies’ revenue
came from personalized print in 2010. This includes the many firms with 0% in revenue
from personalized print. The average of personalized print, from the companies that did
produce at least some personalized print, (n = 16), was 11.54%, a slightly higher number.
For most companies (75% of the 28 that responded), personalization counted for less than
20% of their annual revenue. See Figure 5.2 for the distribution of revenue from
[image:38.612.99.549.611.699.2]personalized printed jobs.
Table 5.3 Annual revenue from personalized print jobs in 2010
Respondents Mean Median Min Max SD
All companies
(n = 28) 6.6% 1.4 0 70 14.3
Only companies that produced
Figure 5.2 Percentage of revenue from personalized print jobs
Percentage of Personalized Print from Digital Revenue
Among all respondents, an average of 31.4% of the digital print being produced is
personalized. (See Figure 5.3 for the distribution of personalization from digital print
revenue.) When examining only the companies that indicated they produced personalized
print, an average of 43.2% of their digital print revenue came from personalization.
Table 5.4 Personalized Print from Digital Revenue
Respondents Mean Median Min Max SD
All companies (n = 22)
31.4% 18.35 0 100 34.2
Only companies that produced personalized
print (n = 16) 43.2% 37.5 0.4 100 33.12
42.9%
32.1%
10.7%
7.1%
0.0%
7.1%
0.0% 5.0% 10.0% 15.0% 20.0% 25.0% 30.0% 35.0% 40.0% 45.0%
0% 1‐5% 6‐10% 11‐15% 16‐20% 21% or more
Percentage of Firms
n = 28
[image:39.612.101.548.566.689.2]Figure 5.3 Percentage of personalized print from annual digital revenue
Level of Personalization
In terms of the different levels of personalization, respondents were asked to
indicate what type of personalization was either a “major,” “minor” or “not at all” part of
their revenue. Definitions of the different levels of personalization are listed in the
“Methodology” chapter on page 20. Note: Non-responders who only had indicated that
one or more levels were their “major” source of revenue, were assumed to not produce
other types of personalization and were categorized as “Not at all”. Figure 5.4 shows the
results.
31.8%
22.7%
18.2%
9.1%
4.3%
13.6%
0.0% 5.0% 10.0% 15.0% 20.0% 25.0% 30.0% 35.0%
0% 1‐20% 21‐40% 41‐60% 61‐80% 81‐100%
Percentage of Firms
n = 22
Figure 5.4 Impact on revenue by level of personalization
Mail merge was the level of personalization most companies (35%) listed as their
major source of revenue, and 55% said that it was either a “major” or “minor” part of
their revenue. Moderate personalized print was the second most popular level with 20%
of the companies indicating it was a major part of their revenue (see Figure 5.5).
0% 10% 20% 30% 40% 50% 60% 70% 80% 90% 100%
Versioning Mail Merge Transactional
printing Moderate High
Percent of Responses
Type of personalized print
Figure 5.5 Percentage of respondents with personalization as a major part of revenue by level of personalization
On average, 53% (n = 18) of the personalized printed jobs the companies
produced were recurring, while 47% reported they were one-time jobs.
Respondents promoted personalization to their clients mainly by showing
examples of products and case studies on sales calls (61%) and/or by upselling current
clients who would benefit from a personalization strategy (56%). Only 28% indicated
that using personalized mailings and personalized URLs (PURLs) promoting their
capabilities was a part of their promotion strategy. One company indicated that they also
used advertising and promoted personalized print at events. One company did not
promote personalization at all since it was not a part of their core business. (Only 4% of
this business’ revenue came from digital print. Of that, 2% was personalized).
5%
35%
15% 20%
5% 0%
20% 40% 60% 80% 100%
Versioning Mail Merge Transactional
printing Moderate High
Percent "Major" Part of Revenue
Companies that offered personalized print also were likely to offer a personalized
e-mail service (40%, n = 20).
A total of 60% of the printing companies (n = 20) usually did not track the
response rates for the personalized campaigns, but their clients did. Twenty percent
indicated that the decision on who would track the response rate, depended on the client.
Only 15% of the printing companies did tracked the response rate for the personalized
campaigns for their clients most of the time.
In terms of the future of personalization, 75% (n = 20) of the respondents
predicted an increase of personalized printed jobs in the coming year, while 20%
indicated that the volume of personalized printed jobs would stay the same. Only 5% felt
it would decrease.
Challenges to Overcome
Communicating the value to our customers of the return on investment (ROI)
benefits of personalization was one of the largest challenges with 45% of respondents.
Table 5.5 lists the top 5 challenges that respondents indicated they are facing regarding
Table 5.5 Top five challenges for producing personalized print
Challenge Percent that indicated this was a
major challenge (n = 20)
Communicating the value to our customer of ROI (Return on Investment) benefits of personalization
45%
Poor quality of data on the client side 30%
Ability to work with client’s marketing
decision makers 30%
Clients do not have retention or customer
relationship strategy 30%
Merging the client’s database with variable
data software 15%
Comparing Europe to the US
Patricia Sorce and Michael Pletka surveyed 171 digital printers in the US in 2004
for their validation study on digital printing success models. The results from this thesis
were compared with their findings for any differences or similarities. This section will
compare the amount of personalization produced, the mix of personalization and the
challenges printing companies are experiencing producing personalized print in Europe
and in the US. All data from the US are generated from the report Digital Printing
Personalized Print
For the purpose of comparison, the estimate of the percent of revenue from
personalized print in Europe was 6.6%. Table 5.6 shows the U.S. data. The average
amount of personalized print was over 50% lower in Europe (6.6%) when compared to
the U.S. (20.9%). However, if compared to the percentage of digital print in the current
sample, the mean was 31.4%, a much higher number. Note: sample for Sorce & Pletka
[image:45.612.103.547.335.561.2]was of digital printers only.
Table 5.6 Amount of personalized print by region
Region and type of print revenue Count Mean Min Max SD
Europe 2011
What percentage of annual revenue was from personalized printed jobs in 2010?
28 6.6% 0 100 14.3
Europe 2011
Percentage of digital revenue from personalized printed jobs in 2010.
22 31.4% 0 100 34.2
US 2004
What percent of revenue was from variable data print jobs?
162 20.9% 0 100 28.8
In comparing mix the personalization in printing companies, the US and Europe
both had mail merge as a “major” part of revenue. Mail merge was the level of
amount of personalization for Europe was versioning (5%) and highly personalized print
[image:46.612.102.536.198.550.2](5%), versus transactional (8.2%) and highly personalized print (28%) for the US.
Table 5.7 Mix of personalization by region
Europe 2011 (n=20) The US 2004 (n=171)
Level Percent Percent Level
Versioning Versioning
Major 5 44.4 Major
Minor 10 35.7 Minor
Mail Merge Mail Merge
Major 35 61.4 Major
Minor 20 27.5 Minor
Transactional printing Transactional printing
Major 15 8.2 Major
Minor 5 38.0 Minor
Moderate personalized print Personalized printing
Major 20 57.3 Major
Minor 10 35.1 Minor
Highly personalized print Fully customized communications
Major 5 28.7 Major
Minor 25 42.1 Minor
Note: Non-responders were assumed to not produce that type of personalization and categorized as “Not at all”. See page 28 for description of personalization levels.
Challenges
Table 5.8 compares the strongest challenges that printers in Europe and the US
are facing. Communicating the value of personalization, poor data quality on the clients’
strategies are the largest challenges printers are facing in both regions. European
respondents had the option to answer if the challenge was a large challenge, moderate or
not a challenge at all. The results were combined across the moderate and large
categories, to make the results comparable to the study by Sorce and Pletka (see Table
5.8). Overall, there were very similar results for both markets in terms of order of
[image:47.612.142.506.310.685.2]importance.
Table 5.8 Challenges printers face by region
Europe 2011 (n = 20) U.S. 2004 (n = 170)
Moderate and/or large
challenge (combined) Percent Percent Moderate to high challenge
Communicating the value to our customer of ROI (Return on Investment) benefits of personalization
75 84.1 Communicating the
value to our customer of ROI (Return on Investment) benefits of personalization Clients do not have
retention or customer relationship strategy
65 82.9 Clients do not have
retention or customer relationship strategy Poor quality of data on
the client side 75 80.6 Poor quality of data on the client side
Access to digital assets, such as graphics and photos
45 38.2 Access to digital
assets, such as graphics and photos Need for customized
software to be written 25 37.6 Need for customized software to be written
Variable data software
is too complicated 40 31.8 Variable data software is too complicated
Merging the client’s database with variable data software
60 31.2 Merging the client’s
Europe 2011 (n = 20) U.S. 2004 (n = 170) Ability to work with
client’s marketing decision makers
70 N/A
Changes in workflow (firm’s workflow process)
60 N/A
Training and recruiting of staff with
appropriate skills
55 N/A
Intricate marketing and data protective
legislations
Chapter 6:
Discussion
Summary of Results
Respondents
In total, 37 companies participated in the survey. Eighty-one percent of
participants’ classified themselves as being commercial printers. Participants’ average
annual revenue in 2010 was $ 101.43 million. Seventy-six percent had less than
101employees.
Personalized Print in Europe
• On average, 15.5% of revenue comes from digital printing.
• The amount of personalized print from digital revenue averaged at 31.4%.
• Overall, personalized print was 6.6% of the total revenue.
• Mail merge was the level of personalization most companies (35%) listed
as their major source of personalization revenue.
Challenges
The top five challenges that European printing companies are facing related to
• Communicating the value to our customer of ROI (Return on Investment)
benefits of personalization (45%),
• Poor quality of data on the client side (30%),
• Ability to work with client’s marketing decision makers (30%),
• Clients do not have retention or customer relationship strategy (30%), and
• Merging the client’s database with variable data software (15%).
The US Compared to Europe
The average revenue generated by personalized print in Europe was lower
(average of 6.6%) than the personalized print produced in 2004 by US digital printers
(average of 20.9%). Secondly, 31.4% of digital print was personalized in Europe. Due to
the small sample size, lack of representation and possible misinterpretations, the
researcher cannot provide a firm conclusion about the differences between the US and
Europe.
Mail merge was the level of personalization most printing companies indicated as
a “major” revenue generator both in Europe (35%) and in the US (61.4%). Overall, the
top challenges that the European and U.S. printing companies indicated that they are
facing were similar:
• Communicating the value of personalization, and
Discussion
As seen in the results, the mix of personalization levels and the challenges printers
are facing when producing personalized print were similar in both Europe and the US.
It was surprising to see that the top challenge regarding personalized print was
“communicating the value of personalization” to customers. Research on response rates
and the value of personalization are both available, so why is this such a challenge? Is it
that the printing companies do not have a proactive sales strategy? Or is it that the
printers do not have enough knowledge and therefore do not feel confident enough to sell
personalized print? Printing companies over the years have been used to getting jobs
handed to them, and their job has been to put ink on paper. They have to change their
mindset, which can take a long time. In order to produce personalized print, printers also
must obtain a new skill set and the knowledge and capability to produce high-quality
personalized jobs. Printing companies might not have these capabilities, or they might not
want to grow their business in that direction.
Printers do not have to become marketers, but they have to have knowledge of the
technology required to produce personalized print and how to utilize it to create value for
the customer. They also need to change their way of thinking, be proactive, show their
customers what they are capable of as well as the value of personalized print, and work
What is not surprising is that another highly ranked challenge in both the US and
in Europe was “poor data quality from the clients’ side.” Companies have collected data
haphazardly for years, with no understanding of how to use it. When a company collects
data without a utilization strategy, the data management systems they are using (if they
even have one) are often poorly managed. Updating addresses, names, etc., is
time-consuming, and companies do not always want to spend their time and labor on it. Some
companies are offering data clean-up for their customers to update their customer
relationship management (CRM) systems, and have found business success doing so.
Companies may invest in better data management systems if printers communicate the
value of personalization and showed examples of how to use the data in direct marketing.
After all, there is no point in collecting data if you are not using it. (In Denmark, a
company is actually not allowed to store data, by law, if it is not going to be used for a
purpose, such as direct marketing.)
In terms of the mix of personalization levels, it is not surprising that the
most-used application was mail merge. Mail merge is the easiest type of personalization to
produce. An advanced CRM system is not needed for this type of personalization, and
therefore it is easy for the client as well as the printer.
Transactional printing, also called “transpromo,” has been marketed heavily from
the business software side. In addition, there have been rapid developments in high-speed
ink jet presses, which better enable this application. It is therefore surprising to see that it
is not a larger part of printers’ revenues. It could be that large B2B and B2C companies
not often served by commercial printers. The trend towards paperless statements—where
the customer can choose to receive their transactional documents via email and as .PDF
documents—may also impact the lack of revenue from this application. However, some
consumers want to keep a printed copy of their financial records. If printers could
communicate the value of personalized print, some companies might choose to change
their distribution model for transactional documents and choose to print them instead.
Since the amount of digital printing has increased (PIRA, 2010) and the value of
personalized print has been discussed in several articles in European trade magazines, the
researcher expected the amount of personalized print to be higher in Europe than in the
US. However, the researcher is not confident about the percentage of personalized print
obtained in this study: is it 6.6% or 31.4%? If it is 6.6%, why is it so low? Reasons why
the rate was so low in this study could be that there are significant differences in
consumer behavior and in the marketing cultures between Europe and the US. In most
European countries, coupons are not used, which is a great marketing tool where
personalization can be utilized. Also, European consumers tend to shop locally on a daily
basis, not weekly, whereas American consumers normally stock up on coupons, shop
once or twice a week and spend more time planning their grocery shopping.
Another reasons the response rate was low in this study could be that companies
in Europe do not have real numbers for the distribution of revenue and the percentage of
personalization. Secondly, based on the researcher’s personal conversations with printers,
conducted in Europe and supported by the European Union about the future of the
printing industry received only 148 online responses.
According to PIRA’s forecast, the amount of direct mail is going to increase.
Moreover, there are also opportunities for personalization in the packaging industry.
Companies such as LEGO, Heineken and Kraft Foods have already experimented with
personalized packaging and had great success. Overall, there are great opportunities for
personalized print and indications that personalized print should continue to grow.
Of the 37 companies that participated in this research, 14 of them where located
in Portugal. One of the reasons for this high number of participants (compared to other
countries) could be due to the distribution of the survey. Some member federations chose
to include the invitation to the survey in their newsletter, where as the Portuguese
federation, APIGRAF (ASS. Portuguesa Das Ind. Gráficas, De Communicão Visual E
Transformadoras Do Papel), translated the English survey invitation from Intergraf to
Portuguese and distributed it directly to all of their members.
Reflection
If printing companies were to share their information more openly and were
interested in gaining knowledge from each other, some of the challenges they are facing
might be lessened and the companies could benefit from each other’s knowledge. As a
result of the lack of knowledge sharing, the industry is creating clear “winners” with
companies are taking market share from other printing industries in Europe, such as
France and Spain. (E. Khoury, Gravure Day 2011, at Rochester Institute of Technology).
Limitations
The small sample size and the lack of representation limited the inferences about
the European printing market. In addition, some respondents seemed to misinterpret the
question “How much of your annual revenue came from personalized printed jobs in
2010?” and may have instead reported how much digital print was personalized.
Therefore, the researcher is not confident about the amount of personalized print
reported.
The fact that the data on personalization from print service provider perspectives
in the US were from 2004 also created a limitation regarding the comparison between the
US and Europe. However, research indicates that the demand for personalization has
remained steady from 2003 to 2008 (Sorce, 2009). Therefore, the similarities between
Europe and the US may be due to the fact that it takes a long time to move a whole
Agenda for Further Research
Suggestions for further studies on personalized print include the following:
• Face-to-face interviews with companies,
• Case-studies on commercial printers that market personalized print to their
customers,
• Focus on one country, or one region in Europe, and
Chapter 7:
Bibliography
Broudy, D., & Romano, F. (1999). Personalized and Database Printing. GAMA.
Bureau of Economic Analysis. GDPbyInd_SHIP_NAICS: Shipments by Industry in Current Dollars, Quantity Indexes by Industry, Price Indexes by Industry. Retrieved from http://www.bea.gov/industry/gdpbyind_data.htm
CMO Council. (March 2008). The Power of Personalization. The impact + Influence of Individualized Content Delivery. Retrieved from
http://www.cmocouncil.org/cat_details.php?fid=27
Davis, R. (2011). Competing for Print1s Thriving Future. Pittsburg, PA, Printing Industries Press.
E24. (2010) Ny reklame opptur. E24. Retrieved from http://e24.no/media/article3863790.ece
Elanders. Personalised Print. Retrieved from http://www.elanders.com/en/We-offer/Personalised-print/
Federation of European Direct and Interactive Marketing. (1999) The Handbook of International Direct Marketing.
Future of Marketing Conference Part 2, (March 2011). Technology-Driven Personalization. Conference transcript. Retrieved from
http://futureofmarketing.com/replay/
Haase, S. (March, 2011). Privacy – the Critical Link for Personalization. Retrieved from http://futureofmarketing.com/blog/privacy-the-critical-link-for-personalization/
Hansapress (May 2010). The more personal the better. (p.28) Hansapress. Retrieved from http://www.hansaprint.fi/en/p557-2010.html
InfoTrends (2006). The Future of Mail.
International Confederation for Printing and Allied Industries. (2007). Competitiveness of the European Graphic Industry. Retrieved from http://www.intergraf.org
International Confederation for Printing and Allied Industries. (March, 2010). The Evolution of the European Graphic Industry. Retrieved from
http://www.intergraf.org
Pellow, B., Sorce, P., Frey, F., Olson, L., Moore, K., & Kirpichenko, S. (October 2003). The Advertising Agency’s Role in Marketing Communications Demand Creation. Rochester Institute of Technology, Printing Industry Centre (PICRM-2003-05) retrieved from http://print.rit.edu
Pira International. (2010). The Future of European Printing to 2015.
Pitney Bowes, (March, 2010). White-paper: TransPromo takes off for B2B
Communications. Retrieved from http://www.pbconnect.com/TransPromo-Takes-Off-For-B2B-Communications/
Pitney Bowes. Our Company. Retrieved from http://www.pb.com/our-company/
Print in the Mix. (June, 2010). Marketers Remain High on Direct Mail. Retrieved from http://printinthemix.rit.edu/fastfacts/show/349
Senator Kerry, (March 16, 2011). Press release. Retrieved from
http://kerry.senate.gov/press/release/?id=d18a9191-7fa3-437c-af24-3b6ca3a28f10
Sorce, P. (2009). Personalization. Rochester, NY: Rochester Institute of Technology , Cary Graphic Arts Press.
Sorce, P., & Pletka, M., (2004) Digital Printing Success Models: Validation Study. Rochester Institute of Technology, Printing Industry Centre (PICRM-2004-06) retrieved from http://print.rit.edu
Chapter 8:
General References
Anonymous. (October 2010). Personal touch. Digital Demand. Vol 11 Issue 3. Retrieved from http://library.rit.edu/electronic/journals/DigitalDemand/
Broudy, D., & Romano, F. (October 1999). An Investigation: Direct Mail Responses Based on Color, Personalization, Database, and Other Factors. DPC White Paper. 1/1999. Retrieved from http://www.printing.org/DPC/main/htm
Brunner, L. (2007). Digital: variable data printing & on-demand print. The Unity Print Production Handbook 2007. Retrieved from
http://www.britishprint.com/filemanager_net/files/download_files/Tech_Ware/PP H%2007%20-%206.2%20VD.pdf
Department of Commerce, Internet Policy task Force. Green Paper: Commercial Data Privacy and Innovation in the Internet Economy: A Dynamic Policy Framework. Retrieved from http://www.ntia.doc.gov/internetpolicytaskforce/
Dinkovski, N. (January 2011). Buyers’ Guide: Personalisation software. Print Week. Retrieved from http://www.printweek.com/news/1049090/Buyers-Guide-Personalisation-software
Federal Trade Commission. (December 2010). Protecting Consumer Privacy in an Era of Rapid Change: A Proposed Framework for Businesses and Policymakers.
Retrieved from: http://business.ftc.gov/legal-resources/protecting-consumer-privacy-era-rapid-change-proposed-framework-businesses-and-polic
Future of Marketing. http://futureofmarketing.com/
Internal Revenue Service.
http://www.irs.gov/businesses/small/international/article/0,,id=206089,00.html
International Confederation for Printing and Allied Industries. Intergraf. http://www.intergraf.eu
Kearns, M. (September 2010). Any other name. Print Monthly. (p 22-24)
Moloney, C. (November 2009). The changing print market – rise of the integrated print communicator. Print & Paper Monthly. Vol 22, no 7.(p 22-23). Retrieved from http://www.paperandprint.com/print-paper/index.htm