Open Access
Vol 10 No 4Research article
Epigenetic mapping and functional analysis in a breast cancer
metastasis model using whole-genome promoter tiling
microarrays
David I Rodenhiser
1,2,3,4,5, Joseph Andrews
1, Wendy Kennette
1, Bekim Sadikovic
1,2,
Ariel Mendlowitz
1,2, Alan B Tuck
1,3,6and Ann F Chambers
1,3,61London Regional Cancer Program, Victoria Research Laboratories, London Health Sciences Centre, 790 Commissioners Road East, London,
Ontario, N6A 4L6, Canada
2Department of Biochemistry, The Schulich School of Medicine and Dentistry, University of Western Ontario, London, Ontario, N6A 3K7, Canada 3Department of Oncology, The Schulich School of Medicine and Dentistry, University of Western Ontario, London, Ontario, N6A 3K7, Canada 4Department of Paediatrics, The Schulich School of Medicine and Dentistry, University of Western Ontario, London, Ontario, N6A 3K7, Canada 5EpiGenWestern Research Group at the Children's Health Research Institute, Victoria Research Laboratories, 800 Commissioners Road East,
London, Ontario, N6C 2V5, Canada
6Department of Pathology, The Schulich School of Medicine and Dentistry, University of Western Ontario, London, Ontario, N6A 3K7, Canada
Corresponding author: David I Rodenhiser, drodenhi@uwo.ca
Received: 17 Apr 2008 Revisions requested: 23 May 2008 Revisions received: 11 Jul 2008 Accepted: 18 Jul 2008 Published: 18 Jul 2008
Breast Cancer Research 2008, 10:R62 (doi:10.1186/bcr2121)
This article is online at: http://breast-cancer-research.com/content/10/4/R62 © 2008 Rodenhiser et al.; licensee BioMed Central Ltd.
This is an open access article distributed under the terms of the Creative Commons Attribution License (http://creativecommons.org/licenses/by/2.0), which permits unrestricted use, distribution, and reproduction in any medium, provided the original work is properly cited.
Abstract
Introduction Breast cancer metastasis is a complex, multi-step biological process. Genetic mutations along with epigenetic alterations in the form of DNA methylation patterns and histone modifications contribute to metastasis-related gene expression changes and genomic instability. So far, these epigenetic contributions to breast cancer metastasis have not been well characterized, and there is only a limited understanding of the functional mechanisms affected by such epigenetic alterations. Furthermore, no genome-wide assessments have been undertaken to identify altered DNA methylation patterns in the context of metastasis and their effects on specific functional pathways or gene networks.
Methods We have used a human gene promoter tiling microarray platform to analyze a cell line model of metastasis to lymph nodes composed of a poorly metastatic MDA-MB-468GFP human breast adenocarcinoma cell line and its highly metastatic variant (468LN). Gene networks and pathways associated with metastasis were identified, and target genes associated with epithelial–mesenchymal transition were validated with respect to DNA methylation effects on gene expression.
Results We integrated data from the tiling microarrays with targets identified by Ingenuity Pathways Analysis software and observed epigenetic variations in genes implicated in epithelial–mesenchymal transition and with tumor cell migration. We identified widespread genomic hypermethylation and hypomethylation events in these cells and we confirmed functional associations between methylation status and expression of the CDH1, CST6, EGFR, SNAI2 and ZEB2 genes by quantitative real-time PCR. Our data also suggest that the complex genomic reorganization present in cancer cells may be superimposed over promoter-specific methylation events that are responsible for gene-specific expression changes.
Conclusion This is the first whole-genome approach to identify genome-wide and gene-specific epigenetic alterations, and the functional consequences of these changes, in the context of breast cancer metastasis to lymph nodes. This approach allows the development of epigenetic signatures of metastasis to be used concurrently with genomic signatures to improve mapping of the evolving molecular landscape of metastasis and to permit translational approaches to target epigenetically regulated molecular pathways related to metastatic progression.
Introduction
Metastasis is a complex, multi-step biological process charac-terized by distinct, interrelated steps that vary in their timing and efficiency [1,2]. These steps include the invasion of pri-mary tumor cells into the surrounding tissue, intravasation into and through the local blood or lymphatic circulation, extravasa-tion from the circulaextravasa-tion and arrest of the tumor cell at a sec-ondary site, and finally the colonization and growth of metastatic cells at that distant location [2-4]. Complex genetic and epigenetic alterations govern the efficiency of each of these steps. However, the molecular characteristics of metas-tasis in general, and breast cancer metasmetas-tasis in particular, are primarily understood in the context of genetic changes identi-fied with the use of gene-specific, tissue-specific and whole-genome approaches. For example, individual metastasis sup-pressor genes have been identified that, when lost or mutated, are permissive to the metastatic or invasive phenotype [5,6]. In addition, various microarray studies have generated genetic signatures of metastasis related to risk [7,8], clinical outcome [9] and distant recurrence [10], and have identified candidates for targeted therapy [11-13].
In contrast, epigenetic alterations in metastasis are less well characterized than these genetic changes [9,14]. Such epige-netic alterations primarily involve DNA hypermethylation events within the promoter regions of individual candidate genes. This reversible addition of methyl groups at cytosines within CpG dinucleotides can promote the recruitment of pro-tein complexes that repress transcription and also prevent the binding of transcription factors to their binding motifs [15,16]. Additionally, the hypomethylation of repetitive elements can occur and leads to genomic instability [17,18], and alterations in histone protein modifications can have profound conse-quences that contribute to cancer and define an epigenetic signature of tumorigenesis [16,19,20].
Studies addressing epigenetic contributions to breast cancer metastasis have primarily focused on mapping increased DNA methylation within the promoter regions of individual candidate genes or small sets of cancer-related genes [21]. For example, hypermethylation of the E-cadherin (CDH1) promoter, and the resultant decrease in its expression, are associated with infil-trating breast cancers [22]. A limited hypermethylation profile associated with sentinel lymph node metastasis has been described that also involves significant hypermethylation in CDH1, with measureable methylation also evident in RASSF1A, RAR-β 2, APC, TWIST and GSTP1 [23]. In some cases, promoter hypermethylation has been correlated with specific tumor characteristics, such as GSTP1 methylation with increased tumor size, the occurrence of CDH1 methyla-tion in estrogen receptor (ESR1)-negative tumors and the fre-quent appearance of RAR-β 2 hypermethylation in HER2-positive tumors [23]. Similar multi-gene correlations have linked metastases of breast cancer cells to sentinel lymph nodes with epigenetic alterations in CDH1 and RAR-β 2 [24]
and hypermethylation of ESR1, BRCA1 and CDH1 in breast LN metastases [25]. Promoter methylation has also been observed in a wide variety of essential molecular pathways in the context of metastatic breast cancer, including genes involved in apoptosis [26], DNA repair [27,28], the regulation and composition of the extracellular matrix [29,30], transcrip-tion [31,32] and the cell cycle [33,34]. In additranscrip-tion, epigenetic silencing of the lysosomal cysteine protease inhibitor cystatin 6 (CST6) is more frequently observed in metastatic lesions than in primary cancers [35] and the epigenetic silencing of the chemokine CXCL12 (rather than its receptor CXCR4) contributes to the metastatic potential of mammary carcinoma cells [36]. In contrast with the repressive effects of promoter hypermethylation, hypomethylation events can lead to gene overexpression that can significantly stimulate breast cancer progression and metastasis [37] as well as being an effective molecular indicator of distant metastases [38].
Despite these various reports, no systematic assessments have been performed to identify genome-wide DNA methyla-tion signatures related to models of breast cancer metastasis. Here we describe the first use of promoter tiling microarrays to identify whole-genome epigenetic changes associated with breast cancer metastasis to lymph nodes. We used a highly metastatic variant (MDA-MB-468GFP-LN; 468LN) of the poorly metastatic MDA-MB-468GFP human breast adenocar-cinoma cell line [39]. In breast cancer, the lymphatic system serves as a direct route for the spread of primary tumor cells to the lymph nodes and is also a potential route for dissemina-tion throughout the body to distant organs. This variant 468LN cell line displays profound morphological changes and increased growth rate relative to its parental line, and when injected orthotopically into nude mice, these cells produce abundant spontaneous lymph node metastases [39]. We identified widespread hypomethylation and hypermethylation events in these cells by using promoter tiling microarrays and we identified the altered DNA methylation status of several genes implicated in epithelial–mesenchymal transition (EMT) [40]. Furthermore, we confirmed functional associations between this altered methylation status and changes in gene expression with quantitative real-time RT-PCR (qRT-PCR). Here we show for the first time that genome-wide epigenetic alterations may contribute to metastasis through the lymph nodes and that these epigenetic changes are functionally associated with metastatic mechanisms such as EMT.
Materials and methods
Cell lines
and 3, and grown to approximately 70% confluence. All exper-imental research reported in this article was performed within the Safety and Ethical guidelines of the University of Western Ontario.
Digestion of purified genomic DNA with MseI and ligation to annealed adaptor primers
An adaptor-mediated, PCR-based approach was used to pro-duce labeled targets for microarrays (Figure 1a). For each cell line, 2 μg of genomic DNA was isolated with the GenElute Genomic DNA Miniprep kit (Sigma-Aldrich, St Louis, MO, USA) in accordance with the manufacturer's instructions and was digested with 10 U of MseI (New England Biolabs, Pick-ering, ON, Canada) in 1 × NEB2 buffer in a final volume of 50
μl for 3 hours at 37°C. MseI-digested genomic DNA was then purified with the Qiaquick PCR Purification kit (Qiagen, Mis-sissauga, ON, Canada) and eluted in 50 μl. H-12 and H-24 primers were annealed as follows: 4 nmol of H-24 (5'-AGG CAA CTG TGC TAT CCG AGG GAT-3'; Sigma-Genosys, Oakville, ON, Canada) and 4 nmol of H-12 (5'-TAA TCC CTC GGA-3'; Sigma-Genosys) were combined in a final volume of 16 μl, heated to 80°C for 5 minutes and then allowed to cool slowly to 20°C. The annealed primers were then combined with the MseI digested, purified genomic DNA, 5 U of T4 DNA ligase (Invitrogen) and 1 × ligase buffer in a final volume of 80
μl, and the samples were ligated overnight at 16°C. The adap-tor-ligated genomic DNA was later purified with the Qiaquick PCR cleanup kit, eluted in 30 μl, digested with HhaI in a 50 μl volume for 3 hours at 37°C and then purified. Regions of dif-ferential methylation in DNA from both cell lines were deter-mined by comparing signal intensities on microarrays.
PCR amplification of adaptor-ligated, HhaI-digested genomic DNA
To generate amplicons for labeling hybridization to microar-rays, the purified adaptor-ligated, HhaI-digested DNA was amplified in 50 μl with 1 U of Taq polymerase (Invitrogen), 1 × reaction buffer, dATP, dCTP and dGTP (each at 200 μM), 160
μM dTTP, 40 μM dUTP and 1.0 μM H-24 primer. The reaction profile consisted of the following: 72°C for 5 minutes, followed by 25 cycles of 94°C for 1 minute, 55°C for 1.5 minutes and 72°C for 2 minutes, with a final extension step of 72°C for 10 minutes. PCR reactions were then purified as above and eluted in 50 μl. For each biological replicate, 7.5 μg of ampli-fied DNA was fragmented, labeled, and hybridized to Human Promoter 1.0R GeneChips (Affymetrix, Santa Clara, CA, USA), and the arrays were washed and scanned in accord-ance with the manufacturer's standard protocol. Array Image analysis and spot quantification were performed with Affyme-trix GeneChip Operating Software (GCOS) software from Affymetrix. All microarray analyses were performed at the Lon-don Regional Genomics Centre and all sequencing was per-formed at the Robarts Sequencing Facility at the University of Western Ontario.
Microarray data analysis
The .CEL files (raw methylation measurements generated by GCOS) were then imported into the Partek Genomic Suite Software [41-43]. The imported data were normalized with the Robust Multichip Averaging algorithm [44] and converted to log2 values. To detect hypermethylated regions, the mean
sig-nal from each probe for the 468GFP cells was subtracted from that of the 468LN cells across all 4.2 million probes. All probes with a positive signal after this subtraction represented regions of increased signal in 468LN cells. (A reverse subtrac-tion was performed to detect regions of significant hypometh-ylation.) Statistical parameters were set at P < 0.05 (single-sided t test), with a window of 250 nucleotides, to detect sig-nificant regions present in at least two of three biological rep-licates. These regions were annotated to their corresponding genes with the use of the Probeset ID annotation file from the Affymetrix U133_Plus_2 Expression Array. The 'Chromosome View' tool of the Partek Genomic Suite software visualized hypermethylation/hypomethylation across an entire chromo-some; to visualize methylation events at specific promoters, the 'Region View' tool of this software was used to create cus-tom tracks (.wig files) for visualization in the University of Cali-fornia at Santa Cruz (UCSC) Blat genome browser [45].
The data discussed in this publication have been deposited in the National Center for Biotechnology Information's Gene Expression Omnibus (GEO) and are accessible through GEO Series accession number GSE12122.
Bisulfite genomic sequencing
Miniprep kit (Sigma, Oakville, ON, Canada) and sequenced with the T7 promoter primer, and cloned sequences were ana-lyzed by using the ClustalW alignment algorithm [48].
Quantitative real-time RT-PCR
[image:4.612.56.541.89.572.2]Total RNA was extracted from three biological replicates of each cell line by using Trizol reagent (Invitrogen), and cDNA was synthesized with Superscript II (Invitrogen) in accordance with the manufacturer's instructions. Real-time primers were designed with Primerquest Software [49]. Reactions in Figure 1
Experimental design and chromosomal mapping of variably methylated targets
triplicate for each biological replicate used 1 × Brilliant SYBR Green QPCR Master mix (Stratagene; VWR, Mississauga, ON, Canada), 150 nM forward and reverse primers, 200 μM dNTPs and cDNA derived from 100 ng of RNA. For each gene, standard curves were generated by using cDNA derived from 100, 33.3, 11.1, 3.7 or 1.2 ng of total RNA. For each bio-logical replicate, relative amounts of each gene were deter-mined by comparison with the standard curve. The 'unknown' samples were then normalized to glyceraldehyde-3-phosphate dehydrogenase, and the expression levels in the control 468GFP cells were normalized to 1 so that results could be presented as a percentage of fold change, relative to the control.
Ingenuity Pathways Analysis
Gene networks and canonical pathways representing key genes were identified using the curated Ingenuity Pathways Analysis (IPA) database [50]. The data set containing gene identifiers and corresponding fold changes was uploaded into the web-delivered application and each gene identifier was mapped to its corresponding gene object in the Ingenuity Pathways Knowledge Base (IPKB). The functional analysis identified the biological functions and/or diseases that were most significant to the data sets. Fisher's exact test was per-formed to calculate a P value determining the probability that each biological function and/or disease assigned to the data set was due to chance alone. The data set was mined for sig-nificant pathways with the IPA library of canonical pathways, using either (1) a ratio of the number of genes from the data set that mapped to the pathway divided by the total number of genes that mapped to the canonical pathway or (2) a Fisher's exact test to calculate a P value determining the probability that the association between the genes in the data set and the canonical pathway was explained by chance alone. In addition, networks were generated by using IPA as graphical represen-tations of the molecular relationships between genes and gene products. The intensity of genes (node) colour in the net-works indicates the degree of hypermethylation (blue) or hypomethylation (yellow). Nodes are displayed using various shapes that represent the functional class of gene products.
Results
Variably methylated regions are spread across the genomes of 468GFP and 468LN cells
We undertook high-resolution DNA methylation profiling with the Affymetrix human promoter microarray platform to identify metastasis-related methylation differences between the 468GFP and 468LN cell lines. This single-chip technology is composed of more than 4.6 million 25-base-pair probes tiled across 10 to 12.5-kilobase regions and includes the transcrip-tion start sites of more than 25,500 gene promoter sequences. DNAs from the cell lines were used in an adaptor-mediated, PCR-based approach to probe triplicate microar-rays. In the 468LN cells, relative to the 468GFP cells, we iden-tified 2,209 unique hypermethylated and 1,235 unique
hypomethylated regions in at least two of three replicates (P < 0.05; Figure 1b). These regions were spread across the genome, and clustering of the methylation changes could be identified across specific chromosome arms. For example, enriched regions of hypermethylation events were identified on chromosomes 6p, 7p, 11p/q, 18p and 19p/q, and similar hypomethylated regions also could be identified (1p, 3q, 7q and 20q). These regions were not uniform, however, because there was evidence of interspersed hypermethylation and hypomethylation events across many of the chromosomes.
The Affymetrix promoter microarrays provide a robust platform that can identify gene-specific and regional differences in DNA methylation patterns in this breast cancer metastasis model. We found a high degree of reproducibility across the replicate microarrays, with individual tracings virtually overlapping at the chromosome level (Figure 2). Furthermore, interfacing the Partek analysis software with the Blat tool of the UCSC genome browser showed that signal reproducibility within individual promoter regions was uniform down to the level of individual probe tiles within these promoter sequences (data not shown).
Ingenuity Pathways Analysis of differentially methylated gene targets
Figure 2
Mapping of genomic DNA methylation changes
network involving approximately 35 hypermethylation and hypomethylation events (Figure 4).
DNA methylation changes in genes involved in epithelial–mesenchymal transition
To complement these database-generated functional analy-ses, we investigated the involvement of EMT in our breast can-cer metastasis model on the basis of our previous observations of distinct morphological differences between these cell lines that showed a shift from an epithelial to a more mesenchymal phenotype [39]. We generated an IPA network that addressed the biological relationships between genes/ gene products implicated in EMT [40] and we overlaid our methylation data set onto this network (Figure 5). These genes include commonly used molecular markers of EMT showing both increased and decreased levels of expression that phe-notypically increase the capacity for migration, invasion and/or the resistance to apoptosis [40]. Using the statistical parame-ters described in the Materials and methods section to detect significant changes in methylation status, we undertook sodium bisulfite analysis (Figure 6a) for several genes in this network.
[image:7.612.60.552.111.444.2]We tested for and identified changes in methylation status at several gene loci, including CDH1, CST6, EGFR and the tran-scriptional regulators SNAI2 and ZEB2. The EGFR locus was intriguing for several reasons, because we had initially visual-ized a reproducibly significant hypermethylation 'spike' at the 7p11.2 region, which contains the EGFR gene (Figure 2) as well as several other nearby gene targets on the list of hyper-methylated gene targets. Sodium bisulfite analysis using prim-ers specific to the EGFR promoter region (Figure 6a) confirmed the presence of significant levels of DNA methyla-tion within the EGFR promoter in 468LN cells (47% methyl-ated), in contrast with the 468GFP cells (1% methylated). Two other genes (CDH1 and CST6) displayed significant altera-tions in CpG methylation in the 468LN cells (up to 80% CpG methylation), in contrast with 1 to 12% in the 468GFP cells, confirming the promoter microarray in silico analyses. In con-trast, ZEB2 was markedly hypomethylated in the 468LN cells, in contrast with the 468GFP cells (1% versus 68% methyla-tion), whereas SNAI2 showed only moderate overall DNA methylation differences (65% versus 61%) between the cell lines. However, these particular bisulfite profiles suggest that two separate SNAI2 allelic methylation patterns (namely Table 1
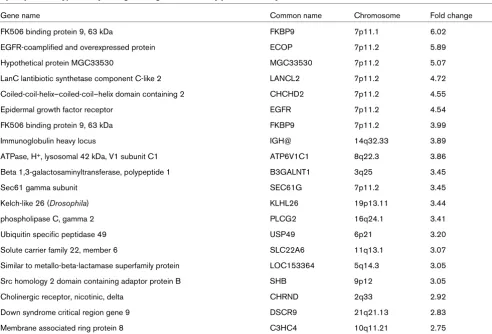
Top 20 putative hypermethylated gene targets detected by promoter analyses of 468GFP and 468LN cells
Gene name Common name Chromosome Fold change
FK506 binding protein 9, 63 kDa FKBP9 7p11.1 6.02
EGFR-coamplified and overexpressed protein ECOP 7p11.2 5.89
Hypothetical protein MGC33530 MGC33530 7p11.2 5.07
LanC lantibiotic synthetase component C-like 2 LANCL2 7p11.2 4.72
Coiled-coil-helix–coiled-coil–helix domain containing 2 CHCHD2 7p11.2 4.55
Epidermal growth factor receptor EGFR 7p11.2 4.54
FK506 binding protein 9, 63 kDa FKBP9 7p11.2 3.99
Immunoglobulin heavy locus IGH@ 14q32.33 3.89
ATPase, H+, lysosomal 42 kDa, V1 subunit C1 ATP6V1C1 8q22.3 3.86
Beta 1,3-galactosaminyltransferase, polypeptide 1 B3GALNT1 3q25 3.45
Sec61 gamma subunit SEC61G 7p11.2 3.45
Kelch-like 26 (Drosophila) KLHL26 19p13.11 3.44
phospholipase C, gamma 2 PLCG2 16q24.1 3.41
Ubiquitin specific peptidase 49 USP49 6p21 3.20
Solute carrier family 22, member 6 SLC22A6 11q13.1 3.07
Similar to metallo-beta-lactamase superfamily protein LOC153364 5q14.3 3.05
Src homology 2 domain containing adaptor protein B SHB 9p12 3.05
Cholinergic receptor, nicotinic, delta CHRND 2q33 2.92
Down syndrome critical region gene 9 DSCR9 21q21.13 2.83
Membrane associated ring protein 8 C3HC4 10q11.21 2.75
hypermethylated and hypomethylated) are present in the 468LN cell line. A similar methylation pattern also seems to be present in the CDH1 clones, which may explain the non-iden-tification of CDH1 by the initial microarray analyses as a signif-icantly hypermethylated target in the 468LN cells.
Quantitative real-time RT-PCR (Figure 6b) showed that expression of the hypermethylated CDH1, CST6 and EGFR genes was decreased in 468LN cells, whereas the hypometh-ylated ZEB2 gene was significantly increased relative to the 468GFP cells. SNAI2 expression was also significantly expressed in 468LN cells, perhaps reflecting a subpopulation of 468LN cells possessing a hypomethylated SNAI2 allele. Our data suggest that epigenetic mechanisms contribute to the gene expression changes observed with these two cell lines in this breast cancer metastasis model and that these are complex relationships that need to be validated on a gene-by-gene basis.
Discussion
Previous studies addressing epigenetic contributions to metastasis have primarily focused on mapping increased DNA
methylation levels within the promoter regions of individual candidate genes [16,20,21]. These studies have therefore provided only a limited understanding of the functional mech-anisms related to metastasis that may be modulated epigenet-ically, because in most cases only individual candidate genes rather than pathways and/or gene networks have been impli-cated. Here we have used promoter tiling microarrays and a unique breast cancer metastasis model to provide a whole-genome map of epigenetic changes related to cancer metas-tasis. The Affymetrix promoter microarray platform provided near-total coverage of CpG-rich regulatory regions in the human genome, with the inclusion of more than 25,000 human promoter regions, including 1,300 cancer-related genes. Our cell-line model system consisted of a poorly metastatic MDA-MB-468GFP human breast adenocarcinoma cell line and a highly metastatic variant (468LN) that exhibits profound mor-phological changes and an increased growth rate and pro-duces extensive spontaneous lymph node metastases [39].
We directly mapped significant regions of variable DNA meth-ylation to specific CpG islands by interfacing the imported microarray data analyzed by the Partek Genomics Suite soft-Table 2
Top 20 putative hypomethylated gene targets detected by promoter analyses of 468GFP and 468LN cells
Description Gene symbol Chromosome Fold change
Chromogranin A (parathyroid secretory protein 1) CHGA 14q32 6.44
DKFZP434B0335 protein DKFZP434B0335 7q21.3 3.73
Zinc finger, C3HC-type containing 1 ZC3HC1 7q32.2 3.41
Centrosomal protein 57 kDa CEP57 11q21 3.22
Stromal antigen 1 STAG1 3q22.3 3.12
Vesicle-associated membrane protein 3 (cellubrevin) VAMP3 1q36.23 3.07
Ectonucleoside triphosphate diphosphohydrolase 7 ENTPD7 10q24.2 2.98
Transmembrane emp24 domain trafficking protein 2 TMED2 12q24.31 2.97
Glycoprotein V (platelet) GP5 3q29 2.96
CATR tumorigenicity conversion 1 CATR1 7q32 2.87
Nuclear receptor subfamily 2, group C, member 2 NR2C2 3p25 2.83
Small EDRK-rich factor 1A (telomeric) SERF1A 5q12.2-q13.3 2.83
Transcription factor 12 TCF12 15q21 2.82
Zinc finger and BTB domain containing 20 ZBTB20 3q13.2 2.82
Aurora kinase A interacting protein 1 AURKAIP1 1p36.33 2.82
Sorting nexin 1 SNX1 15q22.31 2.82
LOC136263 LOC136263 7q32.2 2.81
NEDD8 ultimate buster-1 NYREN18 7q36 2.77
Testis specific, 13 TSGA13 7q32 2.76
Solute carrier family 3A, member 2 SLC3A2 11q13 2.75
[image:8.612.60.551.113.445.2]ware [42] with the UCSC genome browser. We used IPA to mine the large data sets that were generated with Affymetrix promoter microarray platforms and to identify genes belonging to functional categories (Figure 3a) and specific canonical pathways (Figure 3b and Table 3). Functional pathway analy-sis revealed that multiple epigenetic changes were identified within several broad, all-encompassing biological pathways. Similarly, canonical pathway analysis revealed the involvement of epigenetic targets in signalling pathways linked to metasta-sis [10,52]. Interestingly, it seems that epigenetic events con-sistently involve 25 to 30% of the genes in each of these signalling pathways (Figure 3b), suggesting that these epige-netic changes represent a common yet poorly studied mecha-nism contributing to the metastatic process. In addition, these epigenetically sensitive pathways may represent common therapeutic targets for epigenetic-based chemotherapies that can restore the normal epigenetic and expression patterns of genes [53].
We also identified gene networks displaying epigenetic changes in our breast cancer metastasis model system that may correlate with specific epigenetic/gene-expression changes in the context of lymphatic metastasis. First, we used the curated Ingenuity literature database to identify networks of genes having known biological relationships to each other. As shown in Figures 4 and 5, the top significant networks
include both hypermethylated and hypomethylated genes. One network focused on the EGFR gene (Figure 4) and involved 14 hypomethylated and 20 hypermethylated genes, including members of the KCNA family of potassium voltage-gated channel genes and the receptor tyrosine kinase ERBB3. The absence of EGFR methylation in the 468GFP cells confirmed a previous report [54] showing that several breast cancer cell lines, including the parental MDA-MB 468 cells, lack DNA methylation at the EGFR promoter. The hypermeth-ylated status of EGFR in the 468LN cells predicted by the microarray and Ingenuity analysis was verified by sodium bisulfite analysis and furthermore was associated with decreased expression of this gene in comparison with the parental 468GFP cell line (Figure 6). This hypermethylation, along with the repressed EGFR expression that we observe in the 468LN cells, is somewhat paradoxical in that EGFR expression (a known oncogenic characteristic of cancer cells) has apparently been selected against in the more metastatic 468LN cell line.
[image:9.612.57.554.110.419.2]The three other most significant networks we identified were focused on the TNF, TGFβ 1 and MYC genes. Each of these networks possessed about 36 genes having altered DNA methylation profiles (Figure 4). Our data support previous reports that have also suggested the involvement of epige-netic regulation and/or roles in chromatin remodelling for Table 3
Gene lists identified from the canonical pathway analyses shown in Figure 3b
Canonical pathway Hypermethylated Hypomethylated
ERK/MAPK signaling ARAF, CREB3, CREB5, DUSP4, EGFR, ELF3, FGFR3, FGFR4, FYN, HSPB2, LTK, MERTK, MKNK1, MYCN, PIK3R2, PIK3R3, PIK3R5, PLCG2, PPM1J, PPP1CB, PPP1R10, PPP1R11, PPP1R14A, PPP2R1B, PRKACG, PRKAG2, PRKAR1A, PRKCG, RAC1, RAC2, RAPGEF1, RAPGEF4, ROR2, RPS6KA5, SHC1
ATF4, ELK1, ESR1, FOS, MAPKAPK5, MRAS, MYC, PIK3CA, PLA2G2A, PLA2G6, PPP1R3D, PPP1R7, PRKACA, PRKCD, STAT1
Axonal guidance signaling
ADAM2, ADAM30, ARHGEF12, BAIAP2, BDNF, BMP6, BMP8A, BMP8B, CFL2, DPYSL5, EFNB3, EGFR, EPHA10, EPHA8, EPHB1, FGFR3, FGFR4, FYN, GLI1, GLI2, GNAL, GNAO1, GNAT2, GNG3, L1CAM, LTK, MAG, MERTK, MICAL1, MKNK1, MYL5, MYL7, NFATC1, NFATC4, NGFB, NTF5, PIK3R2, PIK
ABLIM1, ADAM9, BMP15, CDC42, EPHA3, EPHB4, GNAS, KALRN, MRAS, MYL3, NFATC2, NTF3, NTN2L, PIK3CA, PRKACA, PRKCD, ROBO1, SMO, SRGAP3, WASL, WNT16, WNT2
B-cell receptor signaling
BCL10, BCL2A1, BCL3, CALM3, CAMK2B, CARD10, CREB3, CREB5, GSK3A, INPP5D, LYN, MAP2K4, MAP3K11, MAPK13, NFATC1, NFATC4, NFKBIE, PIK3R2, PIK3R3, PIK3R5, PLCG2, POU2F2, PRKCQ, PTEN, RAC1, RAC2, RELA, SHC1
ATF4, BCL6, CDC42, CHUK, ELK1, FCGR2A, FCGR2B, FCGR2C, MAP2K7, MRAS, NFATC2, PIK3CA
Integrin signaling ACTA1, ACTB, ACTG2, ACTN3, ACTN4, BCAR3, CAPN5, CAPN9, CAPNS1, EGFR, FGFR3, FGFR4, FYN, ITGAX, LTK, MAP2K4, MAP3K11, MERTK, MRCL3, MRLC2, MYL5, MYL7, PIK3R2, PIK3R3, PIK3R5, PLCG2, PPP1CB, PTEN, RAC1, RAC2, RALA, RAPGEF1, RHOC, RHOT2, ROR2, SHC1, TLN1, TN
ARF5, CAV1, CDC42, DDEF1, ITGA10, ITGB2, MRAS, MYLK, PIK3CA, TSPAN3, WASL
Huntington's disease signaling
BDNF, BET1L, CACNA1B, CAPN5, CAPN9, CAPNS1, CREB3, CREB5, DNM3, EGFR, GNG3, HAP1, HSPA1A, HSPA1B, HSPA2, HSPA8, IGF1R, MAP2K4, MAPK13, NAPA, NAPG, NCOR2, NGFB, PACSIN1, PIK3R2, PIK3R3, PIK3R5, POLR2C, POLR2D, POLR2H, POLR2J, PRKCG, PRKCH, PRKCQ, SHC1, SNA
these genes. For example, the TNF network includes the activ-ity-dependent neuropeptide protein (ADNP), a novel element of SWI/SNF chromatin remodelling complexes that downreg-ulates TNF and may be important in immune surveillance and cancer [55,56]. In addition, concordant epigenetic silencing of TGFβ signaling pathway genes has been widely reported in breast carcinogenesis [57]. MYC overexpression is commonly implicated in breast cancer and metastasis [58], and certain T-cell lymphomas overexpressing MYC possess specific hyper-methylation signatures [59].
We also directly addressed molecular mechanisms responsi-ble for the phenotypic characteristics observed in our meta-static breast cancer model. Given the marked morphological differences in vitro between these cell lines [39], we mapped the biological association of 35 focus genes reported to be associated with EMT [40]. The resultant network (Figure 5) showed that epigenetic changes could be identified at several of these gene loci, including EGFR, the lysosomal cysteine protease inhibitor cystatin M (CST6) [60] and the transcrip-tional repressors ZEB2 and SNAI2. SNAI2, Zeb2 and other
[image:10.612.60.552.93.409.2]family members have multiple gene targets and can recruit specific chromatin-remodelling complexes that repress E-cad-herin (CDH1), which is frequently downregulated in tumor pro-gression and EMT [61] and implicated in lymph node metastasis [23]. CDH1 did not exceed the initial significance levels set to triage differentially methylated candidate genes, but this gene was nevertheless chosen for analysis given its role as a common target for epigenetic inactivation in metasta-sis [21] and its functional relationship to other genes in the EMT network. Sodium bisulfite analysis confirmed the methyl-ation status of each of these genes (Figure 6) and we identi-fied high levels of methylation in the CpG-rich promoter regions of CDH1, EGFR and CST6, as well as hypomethyla-tion at the Zeb2 regulatory region, in the 468LN cells. While the promoter microarrays identified significant hypomethyla-tion in the SNAI2 promoter in 468LN cells, bisulfite analysis suggested only modest changes in methylation levels at this gene locus. Interestingly, sodium bisulfite profiles revealed the existence of two populations of SNAI2 clones, one of which was completely demethylated. This suggests that the 468LN cells may include a population of cells in which this gene is Figure 3
Top functional categories and canonical pathways identified by IPA
Figure 4
Network diagrams generated as a graphical representation of the molecular relationships between genes and gene products
hypomethylated and overexpressed. We also determined the functional significance of epigenetic changes observed at these loci by performing qRT-PCR (Figure 6b). The hyper-methylated status of CDH1, EGFR and CST6 was associated with significant repression of these genes in the 468LN cells, whereas hypomethylation of Zeb2 was consistent with its upregulation in these cells. We also observed marked upreg-ulation of the other transcriptional repressor SNAI2, despite only limited or modest changes in DNA methylation observed by bisulfite analysis.
Overall, we showed that over 3,400 genes exhibit altered methylation patterns between these two cell lines, with most of the methylation changes observed in the 468LN cells being hypermethylation events (64%). This relatively high frequency of hypermethylation is probably related to technical character-istics of the Affymetrix platform, which used sequences selected from the National Center for Biotechnology Informa-tion human genome assembly (Build 34) with repetitive ele-ments removed by Repeatmaster. We also observed that a proportion of these methylation changes seemed to be clus-tered within particular genomic regions (Figure 1b and Table 1). This suggested to us that either certain chromosomal
[image:12.612.62.551.99.402.2]sub-regions are hypermethylated (or hypomethylated) in a coordi-nated manner, or regional gene-dosage events are masking or biasing some epigenetic events at certain loci. Support for this latter possibility comes from G-banding, spectral karyotyping and fluorescence in situ hybridization of both cell lines by our group, which has revealed multiple different chromosome aberrations [51]. In particular, our karyotyping analysis showed differences in the modal chromosome number between the cell lines (60 for 468GFP, and 55 for 468LN), as well as the presence of chromosome alterations that are unique to each of the cell lines. For example, the 468GFP cells possessed an isochromosome [i(7)(p10)], whereas this deriv-ative chromosome was absent in the 468LN cell line. In con-trast, the 468LN cells possessed a derivative chromosome 8 [der(8);t(8;15)(q22;q24)] that is absent in the parental cell line. Our subsequent methylation analysis in the context of these complex karyotypic differences suggests that at certain loci, methylation detection may be dependent on gene dosage within these specific chromosome regions. For example, our microarray analyses of EMT-related genes identified EGFR and TWIST1 (on the duplicated 7p) as hypermethylated, whereas bisulfite sequencing confirmed the hypermethylated status of only EGFR in the 468LN cells (Figure 6a). In addition, Figure 5
IPA network of genes associated with epithelial–mesenchymal transition
these microarrays predicted SNAI2 and HEY1 (on chromo-some 8q11-21) as hypomethylated, with bisulfite sequencing confirming that only SNAI2 was hypomethylated in the 468LN cells.
Our data suggest that the complex genomic reorganization present in cancer cells (for example unbalanced translocations and deletions) may be superimposed over promoter-specific methylation events that may subsequently be responsible for gene-specific expression changes. We believe that it is there-fore of critical importance, in such whole-genome epigenetic
profiling experiments, to validate promoter methylation status at specific loci by bisulfite sequencing or similar methods. In addition, given the complex relationship between both genetic and epigenetic mechanisms in initiating and maintaining the steps involved in metastasis [11,23], such experiments to validate methylation profiles should be performed concurrently with gene expression studies, to rule out the presence of false positives (or negatives) and to ensure that methylation effects directly repress gene promoter/enhancer regions. Finally, we propose that the concurrent use of either comparative genomic hybridization or single nucleotide polymorphism/ copy-number variation microarrays may be warranted to corre-late epigenetic and gene expression patterns with differences in gene copy number between cancer cell lines. Such an approach would permit multi-platform analyses that link together genetic, epigenetic and genomic contributions to cancer progression.
Conclusion
Our use of promoter microarray technology provides a power-ful whole-genome approach with which to identify specific epi-genetic events that may correlate with particular steps in metastatic progression, such as EMT. This approach will also allow the development of epigenetic signatures of metastasis to be used concurrently with genomic signatures to enable better mapping of the evolving molecular landscape on which metastasis occurs. As a result, diagnostic, prognostic and therapeutic markers that correlate epigenetic and genetic changes can be identified. One important caveat relates to the importance of validating specific epigenetic changes by using alternative methods of methylation analysis as well as the necessity to link specific epigenetic changes functionally with gene expression. In this manner, specific changes in gene expression such as those that we identify as being associated with EMT will permit translational approaches to target altered molecular pathways related to metastatic progression in these cells.
Competing interests
The authors declare that they have no competing interests.
Authors' contributions
DR designed and coordinated the studies and wrote and revised the manuscript. JA performed the microarray, bisufite and expression studies and along with BS performed the data analysis. AM performed bisulfite analyses and WK designed and performed the Ingenuity Pathways Analyses. ABT and AFC contributed to study design. All authors read, assisted in revision and approved the final manuscript.
Acknowledgements
[image:13.612.57.294.85.506.2]We recognize our colleagues on the Metastasis Project research team [62] including Dr Catherine Ebbs; David Carter at the London Regional Genomics Centre; and our colleagues and trainees at the London Regional Cancer Program, who provided helpful discussions in the preparation of this manuscript. This research was funded by grant no. Figure 6
Sodium bisulfite and functional analyses
016506 from the Canadian Breast Cancer Research Alliance 'Special Competition in New Approaches to Metastatic Disease' with special funding support from the Canadian Breast Cancer Foundation and The Cancer Research Society. AFC is Canada Research Chair in Oncology, supported by the Canada Research Chairs Program.
References
1. Fidler IJ: The pathogenesis of cancer metastasis: the 'seed and soil' hypothesis revisited. Nat Rev Cancer 2003, 3:453-458. 2. Chambers AF, Groom AC, MacDonald IC: Dissemination and
growth of cancer cells in metastatic sites. Nat Rev Cancer 2002, 2:563-572.
3. Steeg PS: Tumor metastasis: mechanistic insights and clinical challenges. Nat Med 2006, 12:895-904.
4. Pantel K, Brakenhoff RH: Dissecting the metastatic cascade. Nat Rev Cancer 2004, 4:448-456.
5. Stark AM, Tongers K, Maass N, Mehdorn HM, Held-Feindt J: Reduced metastasis-suppressor gene mRNA-expression in breast cancer brain metastases. J Cancer Res Clin Oncol 2005, 131:191-198.
6. Harms JF, Welch DR, Miele ME: KISS1 metastasis suppression and emergent pathways. Clin Exp Metastasis 2003, 20:11-18. 7. Vijver MJ van de, He YD, van't Veer LJ, Dai H, Hart AA, Voskuil DW,
Schreiber GJ, Peterse JL, Roberts C, Marton MJ, Parrish M, Atsma D, Witteveen A, Glas A, Delahaye L, Velde T van der, Bartelink H, Rodenhuis S, Rutgers ET, Friend SH, Bernards R: A gene-expression signature as a predictor of survival in breast cancer. N Engl J Med 2002, 347:1999-2009.
8. Buyse M, Loi S, van't Veer L, Viale G, Delorenzi M, Glas AM, d'Assignies MS, Bergh J, Lidereau R, Ellis P, Harris A, Bogaerts J, Therasse P, Floore A, Amakrane M, Piette F, Rutgers E, Sotiriou C, Cardoso F, Piccart MJ: Validation and clinical utility of a 70-gene prognostic signature for women with node-negative breast cancer. J Natl Cancer Inst 2006, 98:1183-1192. 9. Feng Y, Sun B, Li X, Zhang L, Niu Y, Xiao C, Ning L, Fang Z, Wang
Y, Zhang L, Cheng J, Zhang W, Hao X: Differentially expressed genes between primary cancer and paired lymph node metas-tases predict clinical outcome of node-positive breast cancer patients. Breast Cancer Res Treat 2007, 103:319-329. 10. Wang Y, Klijn JG, Zhang Y, Sieuwerts AM, Look MP, Yang F,
Talantov D, Timmermans M, Meijer-van Gelder ME, Yu J, Jatkoe T, Berns EMJJ, Atkins D, Foekens JA: Gene-expression profiles to predict distant metastasis of lymph-node-negative primary breast cancer. Lancet 2005, 365:671-679.
11. Minn AJ, Gupta GP, Siegel PM, Bos PD, Shu W, Giri DD, Viale A, Olshen AB, Gerald WL, Massague J: Genes that mediate breast cancer metastasis to lung. Nature 2005, 436:518-524. 12. Kang Y, Siegel PM, Shu W, Drobnjak M, Kakonen SM,
Cordon-Cardo C, Guise TA, Massague J: A multigenic program mediat-ing breast cancer metastasis to bone. Cancer Cell 2003, 3:537-549.
13. Woelfle U, Cloos J, Sauter G, Riethdorf L, Janicke F, van Diest P, Brakenhoff R, Pantel K: Molecular signature associated with bone marrow micrometastasis in human breast cancer. Can-cer Res 2003, 63:5679-5684.
14. Kluger HM, Chelouche Lev D, Kluger Y, McCarthy MM, Kiriakova G, Camp RL, Rimm DL, Price JE: Using a xenograft model of human breast cancer metastasis to find genes associated with clinically aggressive disease. Cancer Res 2005, 65:5578-5587.
15. Bernstein BE, Meissner A, Lander ES: The mammalian epigenome. Cell 2007, 128:669-681.
16. Kouzarides T: Chromatin modifications and their function. Cell 2007, 128:693-705.
17. Choi IS, Estecio MR, Nagano Y, Kim do H, White JA, Yao JC, Issa JP, Rashid A: Hypomethylation of LINE-1 and Alu in well-differ-entiated neuroendocrine tumors (pancreatic endocrine tumors and carcinoid tumors). Mod Pathol 2007, 20:802-810. 18. Schulz WA, Elo JP, Florl AR, Pennanen S, Santourlidis S, Engers R, Buchardt M, Seifert HH, Visakorpi T: Genomewide DNA hypomethylation is associated with alterations on chromo-some 8 in prostate carcinoma. Genes Chromosomes Cancer 2002, 35:58-65.
19. Rodenhiser D, Mann M: Epigenetics and human disease: trans-lating basic biology into clinical applications. CMAJ 2006, 174:341-348.
20. Esteller M: Cancer epigenomics: DNA methylomes and his-tone-modification maps. Nat Rev Genet 2007, 8:286-298. 21. Rodenhiser DI: Epigenetic contributions to cancer metastasis.
Clin Exp Metastasis 2008. doi:10.1007/s10585-008-9166-2. 22. Caldeira JR, Prando EC, Quevedo FC, Neto FA, Rainho CA,
Rogatto SR: CDH1 promoter hypermethylation and E-cadherin protein expression in infiltrating breast cancer. BMC Cancer 2006, 6:48.
23. Shinozaki M, Hoon DS, Giuliano AE, Hansen NM, Wang HJ, Turner R, Taback B: Distinct hypermethylation profile of primary breast cancer is associated with sentinel lymph node metastasis. Clin Cancer Res 2005, 11:2156-2162.
24. Cavalli LR, Urban CA, Dai D, de Assis S, Tavares DC, Rone JD, Bleggi-Torres LF, Lima RS, Cavalli IJ, Issa JP, Haddad BR: Genetic and epigenetic alterations in sentinel lymph nodes metastatic lesions compared to their corresponding primary breast tumors. Cancer Genet Cytogenet 2003, 146:33-40.
25. Fabianowska-Majewska K, Kordek R, Krawczyk B: Studies on the methylation status of CpG sequences located in promoters of selected tumour suppressor genes in breast cancer cells. Nucleosides Nucleotides Nucleic Acids 2006, 25:1025-1028. 26. Mimori K, Kataoka A, Yoshinaga K, Ohta M, Sagara Y, Yoshikawa
Y, Ohno S, Barnard GF, Mori M: Identification of molecular markers for metastasis-related genes in primary breast can-cer cells. Clin Exp Metastasis 2005, 22:59-67.
27. Osanai T, Takagi Y, Toriya Y, Nakagawa T, Aruga T, Iida S, Uetake H, Sugihara K: Inverse correlation between the expression of O6-methylguanine-DNA methyl transferase (MGMT) and p53 in breast cancer. Jpn J Clin Oncol 2005, 35:121-125. 28. Murata H, Khattar NH, Gu L, Li GM: Roles of mismatch repair
proteins hMSH2 and hMLH1 in the development of sporadic breast cancer. Cancer Lett 2005, 223:143-150.
29. Lui EL, Loo WT, Zhu L, Cheung MN, Chow LW: DNA hypermeth-ylation of TIMP3 gene in invasive breast ductal carcinoma. Biomed Pharmacother 2005, 59(Suppl 2):S363-S365. 30. Guo H, Lin Y, Zhang H, Liu J, Zhang N, Li Y, Tang Q, Kong D, Ma
D: Tissue factor pathway inhibitor-2 was repressed by CpG hypermethylation through inhibition of KLF6 binding in highly invasive breast cancer cells. BMC Mol Biol 2007, 8:110. 31. Umetani N, Mori T, Koyanagi K, Shinozaki M, Kim J, Giuliano AE,
Hoon DS: Aberrant hypermethylation of ID4 gene promoter region increases risk of lymph node metastasis in T1 breast cancer. Oncogene 2005, 24:4721-4727.
32. Nimmrich I, Sieuwerts AM, Meijer-van Gelder ME, Schwope I, Bolt-de Vries J, Harbeck N, Koenig T, Hartmann O, Kluth A, Dietrich D, Magdolen V, Portengen H, Look MP, Klijn JG, Lesche R, Schmitt M, Maier S, Foekens JA, Martens JW: DNA hypermethylation of PITX2 is a marker of poor prognosis in untreated lymph node-negative hormone receptor-positive breast cancer patients. Breast Cancer Res Treat 2007. doi:10.1007/s10549-007-9800-8.
33. Hu XC, Wong IH, Chow LW: Tumor-derived aberrant methyla-tion in plasma of invasive ductal breast cancer patients: clini-cal implications. Oncol Rep 2003, 10:1811-1815.
34. Takahashi Y, Miyoshi Y, Takahata C, Irahara N, Taguchi T, Tamaki Y, Noguchi S: Down-regulation of LATS1 and LATS2 mRNA expression by promoter hypermethylation and its association with biologically aggressive phenotype in human breast cancers. Clin Cancer Res 2005, 11:1380-1385.
35. Rivenbark AG, Livasy CA, Boyd CE, Keppler D, Coleman WB: Methylation-dependent silencing of CST6 in primary human breast tumors and metastatic lesions. Exp Mol Pathol 2007, 83:188-197.
36. Wendt MK, Cooper AN, Dwinell MB: Epigenetic silencing of CXCL12 increases the metastatic potential of mammary carci-noma cells. Oncogene 2008, 27:1461-1471.
37. Gupta A, Godwin AK, Vanderveer L, Lu A, Liu J: Hypomethylation of the synuclein gamma gene CpG island promotes its aber-rant expression in breast carcinoma and ovarian carcinoma. Cancer Res 2003, 63:664-673.
39. Vantyghem SA, Allan AL, Postenka CO, Al-Katib W, Keeney M, Tuck AB, Chambers AF: A new model for lymphatic metastasis: development of a variant of the MDA-MB-468 human breast cancer cell line that aggressively metastasizes to lymph nodes. Clin Exp Metastasis 2005, 22:351-361.
40. Lee JM, Dedhar S, Kalluri R, Thompson EW: The epithelial–mes-enchymal transition: new insights in signaling, development, and disease. J Cell Biol 2006, 172:973-981.
41. Partek [http://www.partek.com/]
42. Downey T: Analysis of a multifactor microarray study using Partek genomics solution. Methods Enzymol 2006, 411:256-270.
43. Sadikovic B, Andrews J, Carter D, Robinson J, Rodenhiser DI: Genome-wide H3K9 histone acetylation profiles are altered in benzopyrene treated MCF7 breast cancer cells. J Biol Chem 2008, 283:4051-4060.
44. Irizarry RA, Hobbs B, Collin F, Beazer-Barclay YD, Antonellis KJ, Scherf U, Speed TP: Exploration, normalization, and summa-ries of high density oligonucleotide array probe level data. Biostatistics 2003, 4:249-264.
45. UCSC Genome Browser [http://genome.ucsc.edu/]
46. Clark SJ, Harrison J, Paul CL, Frommer M: High sensitivity map-ping of methylated cytosines. Nucleic Acids Res 1994, 22:2990-2997.
47. Li LC, Dahiya R: MethPrimer: designing primers for methylation PCRs. Bioinformatics 2002, 18:1427-1431.
48. Chenna R, Sugawara H, Koike T, Lopez R, Gibson TJ, Higgins DG, Thompson JD: Multiple sequence alignment with the Clustal series of programs. Nucleic Acids Res 2003, 3:3497-3500. 49. Integrated DNA Technologies [http://www.idtdna.com/Sci
Tools/SciTools.aspx]
50. Ingenuity Systems [http://www.ingenuity.com/]
51. Xu J, Chambers AF, Tuck AB, Rodenhiser DI: Molecular cytoge-netic characterization of human breast cancer cell line MDA-MB-468 and its variant 468LN, which displays aggressive lym-phatic metastasis. Cancer Genet Cytogenet 2008, 181:1-7. 52. Driouch K, Landemaine T, Sin S, Wang S, Lidereau R: Gene
arrays for diagnosis, prognosis and treatment of breast cancer metastasis. Clin Exp Metastasis 2007, 24:575-585.
53. Sigalotti L, Fratta E, Coral S, Cortini E, Covre A, Nicolay HJ, Anzal-one L, Pezzani L, Di Giacomo AM, Fonsatti E, Colizzi F, Altomonte M, Calabro L, Maio M: Epigenetic drugs as pleiotropic agents in cancer treatment: biomolecular aspects and clinical applications. J Cell Physiol 2007, 212:330-344.
54. Montero AJ, Diaz-Montero CM, Mao L, Youssef EM, Estecio M, Shen L, Issa JP: Epigenetic inactivation of EGFR by CpG island hypermethylation in cancer. Cancer Biol Ther 2006, 5:1494-1501.
55. Quintana FJ, Zaltzman R, Fernandez-Montesinos R, Herrera JL, Gozes I, Cohen IR, Pozo D: NAP, a peptide derived from the activity-dependent neuroprotective protein, modulates macro-phage function. Ann N Y Acad Sci 2006, 1070:500-506. 56. Mandel S, Gozes I: Activity-dependent neuroprotective protein
constitutes a novel element in the SWI/SNF chromatin remod-eling complex. J Biol Chem 2007, 282:34448-34456. 57. Hinshelwood RA, Huschtscha LI, Melki J, Stirzaker C, Abdipranoto
A, Vissel B, Ravasi T, Wells CA, Hume DA, Reddel RR, Clark SJ: Concordant epigenetic silencing of transforming growth fac-tor-β signaling pathway genes occurs early in breast carcinogenesis. Cancer Res 2007, 67:11517-11527.
58. Jamerson MH, Johnson MD, Dickson RB: Of mice and Myc: c-Myc and mammary tumorigenesis. J Mammary Gland Biol Neoplasia 2004, 9:27-37.
59. Opavsky R, Wang SH, Trikha P, Raval A, Huang Y, Wu YZ, Rod-riguez B, Keller B, Liyanarachchi S, Wei G, Davuluri RV, Weinstein M, Felsher D, Ostrowski M, Leone G, Plass C: CpG island meth-ylation in a mouse model of lymphoma is driven by the genetic configuration of tumor cells. PLoS Genet 2007, 3:1757-1769. 60. Rivenbark AG, Jones WD, Coleman WB: DNA methylation-dependent silencing of CST6 in human breast cancer cell lines. Lab Invest 2006, 86:1233-1242.
61. Peinado H, Olmeda D, Cano A: Snail, Zeb and bHLH factors in tumour progression: an alliance against the epithelial phenotype? Nat Rev Cancer 2007, 7:415-428.