D Dissertation T D
ITS PHA
submitted in PH THE TAMIL DEPARTME K UARMACE
n partial fulf
MASTER
HARMACE
LNADU Dr
ENT OF PH K.M. COLL UTHANGU
A
EUTICAL
lfillment of t degree of
R OF PHAR IN EUTICAL C OF .M.G.R ME CHENNAI HARMACE LEGE OF P UDI, MADU APRIL-2012
L FORMU
the requirem RMACY CHEMISTR EDICAL UN I UTICAL C HARMACY URAI-625107 2ULATION
ment for the
RY
NIVERSITY
CHEMISTR Y
7
award of th
Y,
RY
CERTIFICATE
This is to certify that the dissertation entitled “DEVELOPMENT OF ANALYTICAL METHODS FOR THE DETERMINATION OF NITAZOXANIDE IN BULK DRUG AND ITS PHARMACEUTICAL FORMULATION” submitted by Mrs.Swathy Lakshmi.N, to The Tamilnadu Dr.M.G.R Medical university, Chennai, in partial fulfillment of the requirement for the award of Master of Pharmacy in Pharmaceutical Chemistry, at K.M.College of Pharmacy, Uthangudi, Madurai.It is a bonafide work carried out by her under my guidance and supervision during the academic year of 2011 – 2012 This dissertation partially or fully has not been submitted for any other degree or diploma of this universityor other universities.
GUIDE PRINCIPAL
Dr. S.Venkataraman. M.Pharm, Ph.D Dr. S. Jayaprakash.M.Pharm, Ph.D Professor & Head Professor & Head
Dept of Pharmaceutical Chemistry Dept of Pharmaceutics K.M College of Pharmacy K.M College of Pharmacy
Milestones in life are achieved, not by individual efforts but by blessing and guidance of elders, near and dear. I therefore take this opportunity to register my acknowledgement to all of them.
The notes start with thanks to Almighty whom I thank most for everything I got. It is because of His grace, I could complete my research work.
I owe my deepest and sincere gratitude to my teacher and guide Dr.S. Venkataraman M.Pharm. PhD, Vice Principal and HOD of Dept. of Pharmaceutical Chemistry for his logistic approach and encouragement for the progression and smoothness of this thesis program.
I want to express my heartfelt thanks to Mr. Xavier Arulappa, M.Pharm (PhD), Assistant Professor, Dept. of Pharmaceutical Chemistry for his warm supervision and thoughtful guidance.
With sincere note of gratitude I specially shower my honest gratitude to Dr.M.Sundarpandian, M.Pharm, PhD, Assistant Professor, and Dept.of Pharmaceutical Analysis for giving me excellent guidance about my work and for listening me whenever I was excited about a new idea.
I am very much thankful to Professor M. Nagarajan, M.Pharm, M.B.A, DMS (IM), DMS (BM), Correspondent, K.M College of Pharmacy for providing me all the facilities and support for the completion of my thesis work.
I would like to express my deep sense of gratitude to Dr.S.Jayaprakash, M.Pharm, PhD, Principal, and HOD of Dept. of Pharmaceutics for his valuable suggestion throughout my work.
I felt so happy to acknowledge my debt to Mr. M.S Prakash, M.Pharm, Professor, Dept. of Pharmaceutical Analysis who truly inspire me and taught me to work with commitment for the successful completion of my thesis work.
I would like to express my sincere thanks to Dr.S. Meena, Dept of Pharmaceutical Analysis, Mr. M Bhoopathi, M.Pharm, Dept. of Pharmaceutical Analysis. Mrs.Senthamil Selvi, M.Pharm, Dept of Pharmaceutical Analysis for their valuable help and suggestion for the completion of my thesis work.
With deep sense of veneration and gratitude am really indebted to Mr.Jeeva Eswar for providing me the drug at the right time.
I cannot forget my gratitude to Mrs.Shanmugapriya,D.Pharm, Store in charge, Ms. A.Vijayalakshmi, BSc, Lab Assistant. Mrs. Shanthi, B.A, M.Li.Sc, M.Phil, Librarian for their kind support for the completion of my thesis work.
It’s my indeed pleasure to express my thanks to Mr.K.C. Karthikeyan, M.C.A for his support throughout my thesis work.
It’s an honour for me to express my unending gratitude to Mr. Shivadas. B.Menon (Managing Director), Dr.S.Narayanan (General Manager), A.V.Jayanthi (Quality Manager), Sterling Test House, Cochin for allowing me to work in their esteemed institution as part of my thesis work. I extend my honest gratitude to my colleagues Mr.Prathap L.C, Mr. Jijo John, Nihas N.H for their support in the successful completion of my thesis work.
to say thanks to my dearest friends Mrs. Vidya Ramachandran, Mr. Tallapudi Kiran Kumar, Mr. Juno Raphael,Mr. Anoop. P, Mr. Mathew Ebin P. Sovichan, Mr. M. Rajaraman, Mr. Jagadeesh,Ms. Emelia Theresa Thomas, Ms. Reenu Jacob, Mrs. Asha Das, Ms. Chinnumol, Ms. Y.Kinnera, Ms. Princy for their unexplainable support in the successful completion of my thesis work.
My husband, Mr.Sairam.V, without whom, this effort would have been worth nothing. Your love, care, support and constant patience have taught me so much about sacrifice, discipline and compromise.
It’s a good time to memorize my unexplainable gratitude and love to my father-in –law, mother-in-law, parents and my sister who prayed for me and supported me for the successful completion of my thesis work.
A word of thanks to all those gentle people, around with this work directly or indirectly and for my career growth, whose names, I have been unable to mention here as they are like the countless stars in numerous galaxies.
THANK YOU ALL ……
I INTRODUCTION
1Chemical analysis holds an important position in our modern society. Knowledge of analytical procedures has become essential in practically all arts and science as well as technical separation of industry. The discovery of new medicines, new fabrics, and new alloys would not be possible without the services of analytical chemist. Analytical chemistry is such an important part of our industrial structure and advancing science that without it our present day economy couldn’t exist.
In early days of chemistry, analysis was most synonymous with chemistry itself. Robert Boyle (1626-1691) was first introduced the word “analysis” to apply to the identification of individual substance in presence of each other. Berzelius (1779-1848) developed many new experimental methods which include the separation of the metal constituents from a number of complex minerals.
The last 50years have witnessed an expanding interest in the problems and methods of chemical analysis. There has been a vast increase in the number of analysis that is needed in daily problems of engineering metallurgy, manufacturing and many other fields. Agriculture has been aided with increased yields and enhanced soil fertility through accurate chemical analysis. Advances in medicine and public health would not be possible without chemical analysis.Eg-analysis of blood, urine.
SCOPE OF QUANTITATIVE ANALYSIS
Quantitative analysis is concerned with the identification and separation of chemical substances and chemical principles on which such procedures are based on. Quantitative analysis deals with the determination of the amount of a chemical substance represent either alone or in a simple or complex mixture of other substances.
There are two types of quantitative analysis.
Group 1:-Methods in which the final measurement of the substance sought is made by direct or indirect measurement of volume and weight after proper treatment of a measured portion of the material to be analysed.They are of 2 types.
a) Gravimetric:- Analysis is carried out by a series of weighing operation . The most usual method is the isolation of a substance sought by direct precipitation of substance, or a suitable compound of it with subsequent purification. E.g. Detection of chlorides, sulphates in water soluble samples in the absence of interfering substances.
b) Titrimetric:-In this the substances sought is determined by a careful measurement of volume of a solution of known concentration required to react with the solution to be analysed. They are of 2 types.
1. Neutralization reaction. E.g.:-Determination of acids and bases 2. Oxidation-reduction reaction.
Group 2:-This involves methods in which the final measurement is made upon the system as a whole. Eg:-Measurement of specific gravity.
• Thermal measurement-Melting point, Boiling point • Electrical measurement-Dielectric constant
• Optical measurement
ANALYTICAL CHEMISTRY2
Analytical chemistry deals with the solving of quantitative problems. In quantitative analysis the goal is to determine what are the constituents present in the sample while in qualitative analysis the goal is to determine how much of each constituent in sample. An important part of analytical chemist’s task is choosing the optimum pathway, a choice which is simplified only through the assimilation of knowledge and experience. Thus in solving analytical problems the analytical chemist is often required to design or repair electronic systems, design instruments, interpret spectra and instrumental data, perform chemical analysis with simple chemicals and solutions, develop and evaluate new procedures or modify old ones, separation of simple, complex mixtures, purify samples and write computer programmes.
The measurement of properties such as absorption or emission of energy, optical rotation, refractive index, equilibrium constant is more complex. The reliability, utility, accuracy, interpretation and specificity of these measurements are the responsibilities of an analytical chemist. Another important responsibility of an analyst is to make the measure which is usually based on a tried and tested procedure in a routine manner.
Analytical chemistry deals with the methods for determining the composition of samples or matter. A qualitative method yields information about the identity of atomic or molecular species or the functional groups in the sample. A quantitative method, in contrast, provides numerical information as to the relative amount of one or more of these components.
TYPES OF ANALYSIS3
1. Proximate analysis:-The amount of each element in a sample is determined with no concern as to the actual compounds present.
2. Partial analysis:-This deals with the determination of selected constituents in the sample.
3. Trace constituent analysis:-The determination of specified components present in very minute quantity.
4. Complete analysis:-In this the proportion of each component of sample is determined.
On the basis of sample size, analyses are classified into three. They are:- a. Macro methods;-Determination of quantities of 0.1gm or more.
b. Semi micro methods:-Deals with quantities ranging from 0.01gm -0.1gm. c. Micro methods:-Quantities not exceeding 0.001
ANALYTICAL INSTRUMENTATION4
Analytical instrumentation plays an important role in the production and valuation of new products and the protection of consumers and the environment. Most analytical techniques fit into one of the three principal areas: spectroscopy, electrochemistry and chromatography. The first task is to define an analytical problem. The analyst should determine the nature of sample, the end use of the analytical results, the species to be analyzed and the information required. Once the problem has been defined the next task is to select the appropriate method.
Classification of analytical methods:-5
Various new analytical techniques which are being used can be categorized as follows:-
GENERAL CLASSIFICATION SCIENTIFIC CLASSIFICATION TRADITIONAL CLASSIFICATION MODERN CLASSIFICATION GENERAL CLASSIFICATION:-
This classification includes:-
a) Spectral methods: These are based on light absorption or emission characteristics of drugs.
E.g.:-UV, Visible, NMR Spectroscopy, Fluorimetry, Colorimetric etc.
b) Chromatographic methods: These are based on the affinity or partition coefficient differences between drugs.
E.g.:-Thin layer chromatography (TLC), High Performance Liquid Chromatography (HPLC), Paper chromatography etc.
c) Electro analytical method: These are based on the electrochemical property of the drug.
E.g.:-Potentiometry, Conductometry, Polarography, Amperometry.
E.g.:-Biological assay of some vitamins, microbiological assay of antibiotics &vitamins.
e) Radioactive methods: In these methods the radioactivity is measured for analyzing the drugs.
E.g.:-Radio Immune Assay (RIA)
f) Physical methods: In these methods some physical characteristics of drugs are measured.
E.g.:-Differential Thermal Analysis (DTA), Differential Scanning Calorimetry (DSC).
g) Miscellaneous technique methods: Conventional titrimetric methods,polarimetric methods etc.
SCIENTIFIC CLASSIFICATION:- This classification includes:-
a)
Instrumental methods: A physical property of a substance is measured to determine its chemical composition.E.g.:-Electro-chemical method- change in the electrical properties of the system. Electrogravimetry, Potentiometry, Conductometry etc.
b)
Chemical methods: In these methods chemical reaction or chemical extraction is involved. These are volumetric and gravimetric method.TRADITIONAL CLASSIFICATION:- This classification includes:-
a)
Gravimetric method: This method involves measurement of weight. The substance to be determined is converted into an insoluble precipitate which is collected and weighed or in electro gravimetry, electrolysis is carried out and the material deposited on one of the electrodes is weighed. It may be carried out by:-
b)
Volumetric method: These are the methods in which measurements are made in volume. In this technique volume of titrant is measured and these are of four types depending on the type of reaction involved in it.• Acid-base titration
• Oxidation-reduction titration • Precipitation titration • Complexometric titration
c)
Optical method: These methods are based on how the sample acts towards electromagnetic radiation.• Absorption or emission of radiant energy • Bending of radiant energy
• Scattering of radiant energy
d)
Electrical method: It involves the detection of amount of concentration of a component in terms of• Component upon an electrode • Upon an impressed voltage
• Sample in changing the chemical state of component
e)
Separation method: Based on the principle of affinity of the component to be separated (or) analyzed.MODEREN CLASSIFICATION:-
This classification includes the modern & latest methods of analysis.
a)
Chemical methods:i. Acidimetric and alkalimetric methods ii. Non-aqueous titration methods iii. Oxidation-reduction methods iv. Argentrimetric methods
v. Complexometric methods vi. Gravimetric methods
b)
Physical methods: i. Refractometry ii. Polarimetryiii. Optical rotatory dispersion
c)
Electrochemical methods:i. Electro analytical methods ii. Polarography
d)
Spectroscopic methods:i. Visible spectrophotometry ii. Ultraviolet spectrophotometry
iii. Flame and atomic absorption spectrophotometry iv. Fluorimetry
v. Infrared spectrophotometry
vi. Nuclear magnetic resonance spectrophotometry vii. Mass spectrophotometry
e)
Separation methods:i. Chromatographic methods ii. Electrophoresis
f)
Radiochemical methodsg)
Miscellaneous types:i. Particle size analysis
CHROMATOGRAPHY
According to USP51 chromatography can be defined as a procedure by which solutes are separated by a differential migration process in a system consisting of two or more mobile phases, one of which the individual substance exhibit different mobilities by reason of difference in adsorption, partition, solubility, vapour phase, molecular size or ionic charge density.
Chromatography52 is a new separation technique, discovered by Dr.Michael Tswett (1906) for the separation of complex mixtures by the process of adsorption. According to him chromatography is defined as a process used in separating substance by filtering the solution through a column of finely powdered adsorbent and then developing the column with a solvent.
Classification of chromatographic methods
¾ In all chromatographic techniques53, difference in affinity involves the process of either adsorption or partition. In adsorption, the binding of a compound, to the surface of solid phase takes place where as in partition the relative solubility of a compound in two phases, results in partition of compound between two phases. ¾ Components of a mixture are carried through the stationary phase by the flow of a
mobile phase and the separation is based on difference in migration rates among the mobile phase components.
¾ Elution: - It is a process in which solutes are washed through a stationary phase by the movement of a mobile phase. The mobile phase that exits the column is termed as eluate.
Chromatography
Adsorption Partition
Gas-solid Liquid-liquid Gas liquid Liquid-liquid
Adsorption column Thin layer Chromatography Chromatography (ACC) (TLC)
High Performance Liquid Chromatography (HPLC)
54The technique of HPLC was discovered by Csaba Horvath (1964), Kirkland & Huber (1969). The first mixture to be separated was nucleic acid components associated with thyroid function.
All forms of LC are differential migration processes where sample components are selectively retained by a stationary phase. The different techniques are LSC (adsorption chromatography), LL (Partition chromatography). LLC is divided, based on relative polarities of stationary phase and mobile phase i.e. Reverse Phase chromatography and Ion Pair chromatography. In addition to LSC and LLC. LC comprises bonded phase chromatography, gel permeation chromatography, ion exchange & affinity chromatography.
In HPLC, eluents from the solvent reservoir is filtered, pressurized and pumped through the column. A mixture of solutes injected at the top of the column is separated into components. Individual solutes are monitored by the detector and recorded automatically.
The principal advantages of HPLC compared to classical column chromatography are:- Improved resolution of separated substances.
Faster separation time.
Increased accuracy, precision, sensitivity.
Types of chromatographic techniques
55I. Based on modes of chromatography
Normal phase- Stationary phase is polar Mobile phase is non-polar
Reverse phase- Stationary phase is non polar Mobile phase is polar
II. Based on principle of separation
Partition (Liquid-liquid chromatography) –Based upon the difference in partition coefficient of the individual components of a mixture between a liquid stationary phase and a gaseous or liquid mobile phase.
Ion-exchange (Ion pair chromatography)
Size exclusion (Gel permeation/gel filtration) – In this the fractionation is based on molecular weight.
Affinity – In this a covalent bonding between the reagents called “affinity ligand” and solid supports takes place.
Chiral phase- In this a “Chiral resolving agent or Chiral stationary phase” preferentially complexes one of the enantiomers.
III. Based on elution technique
Isocratic- In this the composition of solvent remains constant.
Gradient -In this the composition is changed continuously or in a series of steps.
II DRUG PROFILE
6INTRODUCTION
Nitazoxanide49 was originally discovered in the 1980s by Jean- François Rossignol at the Pasteur Institute. Initial studies demonstrated activity versus tapeworms. In vitro studies demonstrated much broader activity. Dr. Rossignol co-founded Romark Laboratories, with the goal of bringing nitazoxanide to market as an anti-parasitic drug. Initial studies in the USA were conducted in collaboration with Unimed Pharmaceuticals, and focused on development of the drug for treatment of cryptosporidiosisin AIDS. Controlled trials began shortly after the advent of effective anti-retroviral therapies.
Romark launched an impressive series of controlled trials. No other agent has proven efficacy in the treatment of cryptosporidiosis. However, a placebo-controlled study of nitazoxanide in cryptosporidiosis demonstrated significant clinical improvement in adults and children with mild illness. Among malnourished children in Zambia with chronic cryptosporidiosis, a three-day course of therapy not only led to clinical and parasitological improvement, but also improved survival. In treatment of giardiasis, nitazoxanide was superior to placebo and comparable to metronidazole. Nitazoxanide was successful in the treatment of metronidazole-resistant giardiasis. Studies have suggested efficacy in the treatment of cyclosporiasis, isosporiasisand ameobiasis.
DESCRIPTION7
C IU M M S B CHEMICAL UPAC NAM 2-[(5-nitro MOLECULA
C12H9N3O MOLECULA 307.283g/ YNONYMS 2-(Ac 2-Ace Nitazo Nitazo Nitazo Nitazo NTZ BRAND NAM Alinia Fental Phavi L STRUCTU ME9 o-1, 3-thiazo AR FORMU O5S
CATEGORY
Anti parasitic agents
PROPERTIES
1 Physical state Solid, white or yellowish, crystalline powder
2 Melting point 202 0C
3 Experimental properties
Property Value
log P 1.2
4 Predicted properties Water solubility 7.55e-03g/l
log P 2.14 Log S -4.61 Hydrogen acceptor count 5 Hydrogen donor count 1
Polar surface area 114.11
Rotatable bond count 5
Refractivity 73.89
Polarizability 27.54
5 Solubility
Soluble in N, N-dimethyl acetamide; very slightly soluble
in alcohol; practically insoluble in water.
PHARMACOLOGY13
Mechanism of action: The antiprotozoal activity of nitazoxanide is believed to be
transfer reaction may not be the only pathway by which nitazoxanide exhibits antiprotozoal activity.
Pharmacokinetics14:
1. Absorption: The relative bioavailability of the suspension compared to the tablet was 70%.
2. Volume of distribution: Not available.
3. Metabolism: Rapidly hydrolyzed to an active metabolite, tizoxanide (desacetyl-nitazoxanide)
4. Excretion: Tizoxanide is excreted in urine
Protein binding: Very high (greater than 99%), bound to proteins. Binding is not
affected by degree of renal impairment.
Clearance: Not available.
Half life: 3.5 hours in patients with normal renal function.
Toxicity: In acute studies in rodents and dogs, the oral LD50 was higher than
10,000mg/kg. Single oral dose administered to healthy adult volunteers without significant adverse effects.
Storage and stability: 15Store the tablets, unsuspended powder, and the reconstituted
oral suspension at 250C (77 0F)
Precautions:
i. General: Nitazoxanide must be administered with caution to patients with hepatic and biliary disease, to patients with renal disease and to patients with combined renal and hepatic disease.
ii. Information for patients: Alinia tablets and Alinia suspension should be taken with food. Diabetic patients and caregivers should be aware that the oral suspension contains 1.48gm of sucrose per ml.
iv. Pregnancy: Teratogenic effect.
v. Nursing mothers: Caution must be exercised during administration.
ADVERSE DRUG REACTIONS:- Alinia tablets:-:
9 Body as a whole-asthenia, fever, pain, allergic reaction, pelvic pain, back pain, chills.
9 Nervous system- dizziness, somnolence, insomnia, tremor, hypesthesia.
9 Digestive system-vomiting, dyspepsia, anorexia, flatulence, constipation, dry mouth, thirsts.
9 Urogenital system-discoloured urine, dysuria, kidney pain
9 Metabolic and nutrition-increased SGPT
9 Hemic and Lymphatic system- Anemia, leukocytosis.
9 Skin- rash, pruritis.
9 Respiratory system- epitaxis, pharyngitis.
9 Cardiovascular system- tachycardia, hypertension.
9 Muscular system-myalgia, leg cramps.
Alinia oral suspension:-
9 Digestive system-nausea, anorexia, flatulence
9 Body as whole- fever, infection, malaise.
9 Metabolic and nutrition-increased creatinine, increased SGPT
9 Skin-pruritis, sweat
9 Respiratory system-rhinitis
9 Nervous system-dizziness
DRUG INTERACTION:-
Since it is highly bound to plasma proteins, caution should be taken while administering nitazoxanide with other highly plasma-bound drugs with narrow therapeutic indices. It is expected that no interaction would occur when nitazoxanide is co-administered with drugs that either metabolized or inhibited by cytochrome P450enzyme.
INDICATIONS: - 16 1. Antiprotozoal agent
(1) The first-line choice for the treatment of illness caused by Cryptosporidium parvum or Giardia lamblia infection in immunocompetent adults and children, and is an option to be considered in the treatment of illness caused by other protozoa and/or helminthes.
(2) Treatment of infectious diarrhea caused by Cryptosporidium parvum and Giardia lamblia in pediatric patients 1 year through 11 years of age, which has been approved by FDA, USA
(3) Metronidazole-resistant giardiasis.
2. Anti-virus
(1) Phase II clinical trials for the treatment of hepatitis C, in combination with pig interferon α - 2α and ribavirin.
(2) Chronic hepatitis B
(3) Reduced the duration of rotavirus disease in hospitalized pediatric patients. (4) Activity against influenza A virus
1. Treatment of equine protozoal myeloencephalitis (EPM) caused by sarcocystisneurona in horse
2. Grass and flowers in western countries.
CONTRAINDICATIONS: - 17
DOSAGE&ADMINISTRATION:-
Indication Age Dosage Duration
Treatment of diarrhea caused by Giardia lamblia or
Cryptosporidium parvum
1-3 years
4-11years
5ml of alinia for oral suspension (100mg NTZ) every 12hrs with food.
10ml of alinia for oralsuspension (200mg NTZ) every 12hrs with food.
3days
≥12years 1Alinia tablet (500mg NTZ) every 123hrs with food or 25ml of Aliniaoral suspension (500mg NTZ) every 12hrs with food.
OVERDOSAGE:-
In the event of over dosage, gastric lavage may be given soon after oral administration. Patients should be carefully observed and given symptomatic and supportive treatment.
DOSAGE FORMS:-
• Oral suspension • Tablet
The follo nitazoxan 1. Spectrop form.18 Prab methods(1, with p-dim vanillin in chromogens The reductio temperature 25mg/ml, 5 been valida obtained wi 2. Spectrop and oflo NITAZO
II
owing metho nide and itsphotometric
bhakar. G, et 2, 3). These methyl amin acidic cond s with absor on of nitazo e in methan 5-25mg/ml, ated precise,
ith visible sp
photometric oxacin in co
OXANIDE
I LITER
ods of analy formulations
c estimation
t al; develop e methods ar no benzalde ditions to for
rption maxim xanide was nol. Beer’s l and 10-50m rapid and e pectrophotom
c methods fo ombined bulk
RATURE R
ysis have be s.
of nitazoxa
ped three sim re based on ehyde, p-dim
rm pink, ora ma at 559nm carried out w law is obey mg/ml respec
economic. T metric metho
for simultan lk and pharm
REVIEW
een reported
nide in phar
mple and sen the reaction methyl amin
ange red an m,534.5nm with Zn gran yed in the c
ctively. The he results w odsin methan
neous determ maceutical f
OFLOXA
d for the dete
rmaceutical
nsitive spectr n of reduced no cinnama nd orange ye and 475nm nules and 5N oncentration results of were compar nol at 402nm
mination of formulations
ACIN
ermination o
l dosage rophotometr d nitazoxanid aldehyde an ellow colore m respectively
N HCl at room n range of 5
analysis hav ed with thos m.
f nitazoxanid s19.
Singh H.P, et al; developed the simultaneous determination of nitazoxanide & ofloxacin using three simple, rapid, economical, accurate & reproducible spectrophotometric methods, namely vierodt’s method, Q-analysis, dual wavelength method. 1st method, is based on formation and solving of simultaneous equation at 346.361nm (nitazoxanide) and 296.496nm (ofloxacin). Second method is based on absorbance ratio at two selected wavelength 307.520nm & 346.361nm. In third method two wavelengths were selected for each drug in a way so that the difference in absorbance were measured for the determination of ofloxacin, similarly difference in absorbance at 302.4nm and 289.2nm were measured for determination of nitazoxanide. The results of analysis were validated statistically. Recovery studies gave satisfactory results indicating that none of common additives & recipients interfere the assay method.
3. Colorimetric estimation of Nitazoxanide and Ofloxacin in Pharmaceutical dosage form.20
Vidya Sagar, et al; developed the simultaneous estimation of nitazoxanide & ofloxacin in tablet dosage form i.e. they launched a combined therapy of both drugs. The colorimetric estimation where the wavelengths selectedfor quantitation was486nm (ofloxacin) and 747nm (nitazoxanide). The method obeys Beer’s law in concentration range from 5-50mcg/ml of OFL and 10-100mcg/ml for NTZ. The percentage label claim and percentage label claim and percentage recoveries estimated were close to 99.55% and 98.75% with low value of standard deviation.
4. Development of a simple, rapid and validated spectrophotometric method for nitazoxanide in pharmaceutical formulations and compressed with HPLC21.
in coated tablets and in powders for oral suspension. This method was compared to a previously developed and validated method for liquid chromatography to the same drug. There was no significant difference between these methods for nitazoxanide quantitation.
5. Estimation of Nitazoxanide by U.V Spectrophotometric method22.
Vanitha J.A, et al; developed an accurate, precise, specific, linear, rapid and cost effective spectroscopic methods in UV region for the determination of nitazoxanide in bulk and tablet dosage forms. Nitazoxanide is a new anti-protozoal drug, which showed maximum absorbance at 346nm with apparent molar absorptivity of 23783.92 Lmol-1cm-1. Beers law obeyed in the concentration range of 2-14μg/ml. According to ICH guidelines, results of the analysis were validated statistically and by recovery studies.
6. Simultaneous UV Spectrophotometric Method for the Estimation of Nitazoxanide and Ofloxacin in Combined Dosage Form23.
Senthilraja M, developed a simple, sensitive, rapid, accurate and precise simultaneous UV-spectrophotometric method for the estimation of nitazoxanide and ofloxacin dosage form. Ratio of absorbance at two selected wavelengths, one of which an isoabsorbance point and being the λ max of the one of the two components. Ofloxacin has absorbance maxima at 300nm and nitazoxanide has absorbance maxima at 344nm in Ethanol. The isoabsorbance point of ofloxacin and nitazoxanide was found to be 347nm. Linearity was obtained in the concentration range of 2-25μg/ml for each nitazoxanide and ofloxacin. Results of analysis have been validated statically and by recovery studies.
7. Simultaneous determination of nitazoxanide and ofloxacin in tablet by ultraviolet spectrophotometry (dual wavelength method) 24.
nitazoxanide were 271.5nm & 359.5nm, whereas, the wavelengths selected for determination of ofloxacin were 300.5nm and 365.5nm. A mixture of dichloromethane and n-Hexane (60:40) was taken as a solvent. Regression analysis of beers plots showed good correlation in the concentration range of 5-25μg/ml for nitazoxanide and 2-10 μg/ml for ofloxacin. Accuracy of method was found between 98.5-101.5%. The precision (intra-day, inter-day and analyst to analyst) of method was found within limits (%CV<2). The proposed method was successfully applied to determination of these drugs in laboratory-prepared mixtures and commercial tablets.
8. Development and Validation of Spectrophotometric and Colorimetric Method for the determination of Nitazoxanide in its Bulk and Pharmaceutical Dosage Form(Tablets)25
Lopamudra Adhikari, et al; developed two simple and sensitive spectroscopic methods in UV region and visible region for the estimation of Nitazoxanide in its pharmaceutical dosage forms. Method A is based on Nitazoxanide showing its absorption maxima at 238.3nm in acetonitrile and water (9:1). The method B is based on the reaction of Nitazoxanide with 1ml, 1% ferric chloride and 2ml, 0.1%MBTH to produce a greenish color, characteristic light absorption at 732nm. These method obey Beer- Lambart’s law at a concentration range of 5-40mcg/ml and 50-250mcg/ml respectively. The % recoveries were found out to be 98.75 – 100.45. The results obtained with the proposed methods are in good agreement with the labeled amounts when tablet dosage forms were analyzed.
9. Simultaneous High-Performance Liquid Chromatographic Determination of Nitazoxanide and Ofloxacin in Tablet Formulation
used for the quantification. Caffeine was used as an internal standard. The method validated for linearity, accuracy, precision, limit of detection, limit of quantification and robustness. The calibration curve shows excellent linearity over the concentration ranges of ofloxacin and nitazoxanide in the range of 20-200μg mL-1 and 8-80 μg mL-1, respectively. The separation was completed less than 6 minutes. The proposed method can be used for the quality control of formulation products.
10.Simultaneous RP-HPLC Estimation of Nitazoxanide and Ofloxacin in Tablet DosageForms27.
Siva Kumar R, et al; developed a Reverse Phase HPLC method for the determination of nitazoxanide and ofloxacin in bulk and tablet formulations. The determination was carried out by using Phenomenex C18 column with 0.24% sodium lauryl sulphate: acetonitrile: acetic acid(pH-4.0) (58:40:02) as the mobile phase. The flow rate was 1.5 ml/ min. and the eluents were monitored at 295 nm. The Retention time of nitazoxanide and ofloxacin were 2.2 and 5.4 respectively. Linearity for the nitazoxanide and ofloxacin were found in the range of 400-600
μg/ml and 160 - 240 μg/ml respectively. The method was reproducible, with good resolution between nitazoxanide and ofloxacin and can be use for routine analysis.
11.A Validated RP-HPLC Method for Simultaneous Estimation of Nitazoxanide and Ofloxacin in Pharmaceutical Formulation28.
12.RP-HPLC method for simultaneous estimation of nitazoxanide and ofloxacin in tablets.29
Sharma S, et al; developed a reverse phase high performance liquid chromatography method and for the simultaneous estimation of nitazoxanide and ofloxacin in tablet formulation. The separation and quantification was achieved by HiqSil C18 V Size 4.6mm 250mm column in isocratic mode, with mobile phase consisting of acetonitrile-methanol 0.4mm citric acid, (60:30:10,v/v/v). Citric acid is used to mobilize nitazoxanide and ofloxacin in mobile phase. The mobile phase was pumped at a rate of 0.6ml/mt and the detection was carried out at 304nm. The retention time of nitazoxanideand ofloxacin was found to be 3.122 and 5.902min, respectively. The method was validated for linearity,accuracy and precision. Linearity for ofloxacin and nitazoxanide were in range 2-36µg/ml and 5-90µg/ml, respectively. The developed method was found to be accurate, precise and selective for simultaneous estimation of ofloxacin and nitazoxanide in tablets.
13.Rapid determination of nitazoxanide in tablets using reversed-phase ultra-performance liquid chromatography (UPLC) and high-ultra-performance liquid chromatography30.
14.Simultaneous RPHPLC determination of nitazoxanide and ofloxacin in combined tablet dosage form. (Short Communication)(reverse phase high performance liquid chromatography)(Clinical report) 31.
Kalta R, et al; devoloped a simple, precise, accurate, rapid and reproducible
reverse phase high performance liquid chromatographic procedure for simultaneous determination of nitazoxanide and ofloxacin in tablet dosage form at a single wavelength. The mobile phase used was a combination of acetonitrile: 0.25M potassium dihydrogen phosphate buffer (80:20) with 0.5%v/v of triethylamine and the pH was adjusted to 2.5 by adding orthophosphoric acid. The detection of the combined dosage form was carried out at 320 nm and flow rate was set to 1ml/min. Linearity was obtained in the concentration range of 5 to 25 mg/ml of nitazoxanide and ofloxacin with correlation coefficients of 0.9987 and 0.9995, respectively. The results of the analysis were validated statistically and recovery studies confirmed the accuracy of the proposed method.
15.Development and validation of spectrophotometric methods for the estimation of nitazoxanide in tablet dosage form32.
Lakshminarayana K.V, et al; developed two simple and sensitive visible spectrophotometric methods (A and B) for the quantitative estimation of nitazoxanide, in bulk drug and pharmaceutical dosage forms. Methods were based on the formation of reddish yellow coloured and green colouredchromogens, which were measured at 544 nm and 715 nm, respectively. The results obtained with the proposed methods are in good agreement with the labeled amounts when tablet dosage forms were analyzed.
16.A validated stability indicating HPTLC method for the determination of nitazoxanide33.
and in oxidative stress condition and degradation product was well separated from pure drug. Densitometric analysis of nitazoxanide was carried out in absorbance mode at 350nm. Linear regression analysis data for mean calibration plots showed good linear relationship with r²=0.9997 in 400-1600ng/spot. Method was validated with respect to linearity, precision, accuracy, specificity, robustness. The limits of detection and quantization were 15 and 50ng/spot, respectively. HPTLC method could effectively separate drug from its degradation product and can be employed as a stability-indicating method.
17.Development of a Validated Stability-Indicating LC Method for Nitazoxanide in Pharmaceutical Formulations34
18.Evaluation of Nitazoxanide and Oxfendazole Efficacy against Cystic Echinococcosis in Naturally Infected Sheep35.
Cesar M. Gavidia, et al; developed a method to determine the efficacy of nitazoxanide (NTZ) and oxfendazole (OXF) against CE in naturally infected sheep. A total of 151 ewes were assigned to the following groups: 15 mg/kg of NTZ weekly for five weeks (NTZ5); two rounds of 15 mg/ kg of NTZ a day for five days (NTZ5×2) two weeks apart; 30 mg/kg of OXF a week for 11 weeks (OXF11); 30 mg/kg of OXF plus 15 mg/kg of NTZ a week for 11 weeks (OXF/NTZ); and the control group. OXF11 and OXF/NTZ decreased the number of fertile cysts, increased the number of degenerated cysts, and were more efficacious (49.6–61.2%) against lung cysts and liver cysts (91.8–100%) than any other treatment group. OXF might be an additional strategy for control programs and an optional treatment of human CE after it is licensed.
19.High dose prolonged treatment with nitazoxanide is not effective for cryptosporidiosis in HIV positive Zambian children: a randomized controlled trial36.
Beatrice Amadi, et al; carried out a double-blind, randomized, placebo controlled trial in paediatric patients which was shown to be positive for both HIV and cryptosporidiosis, in the children's diarrhoea/malnutrition ward of the University Teaching Hospital, Lusaka. Children were included if between 1 and 11 years of age, if positive in at least 2 of 3 stool samples for Cryptosporidium spp. (oocysts identified using auramine phenol staining), if they had diarrhoea with 3 or more unformed stools daily, and if HIV seropositive as confirmed by the Capillus Rapid Test (Trinity Biotech, Ireland). If Cryptosporidium spp. oocysts were present in the initial screening but not in
the baseline samples, the patient was excluded unless they tested positive for oocysts within one week from this first sample. Children were excluded if they had a bacterial cause for diarrhoea or if positive
20.Stability indicating CZE method and stress release degradation studies of Nitazoxanide37.
Marcelo DonadelMalesuika, et al; devoloped and validated a new, simple, and effective stability-indicating CZE method for the determination of nitazoxanide in pharmaceutical formulations, using nimesulide as an internal standard. The optimum separation was carried out on a fused silica capillary (48.5 cm × 75 μmi.d., effective length 40 cm) maintained at 25°C, and a running electrolyte containing sodium acetate buffer (pH 5.2; 30 mM)-acetonitrile (80:20, v/v). The injections of the samples were performed using the pressure mode at 50 mm bar for 5 s, with detection at 360 nm using a photo-diode array detector. The method was suitably validated for specificity, linearity, precision, and accuracy, limit of detection and quantitation, and robustness. The high sensitivity of the method was proven with the limit of detection (0.05 μg mL−1) and quantitation (0.2 μg mL−1). The stability-indicating capability of the method was proven using stress conditions (acid and basic hydrolysis, oxidation, and photolysis). The proposed method was successfully applied for the determination of nitazoxanide in coated tablets and oral suspension powder.
21.Liquid chromatography–tandem mass spectrometry analysis of nitazoxanide and its major metabolites in goat38.
revealing that it could be used to rapid screen and identify the structures of active metabolites responsible for pharmacological effects of nitazoxanide and to better understand its in vivo metabolism.
22.Nitazoxanide for the treatment of Giardia Duodenalis infection: A comparative trial with Secnidazole39.
Maria Elena Gonzalezi, et al; carried out a randomized controlled open-label trial at the Cuban Institute of Gastroenterology in adults with confirmed Giardia duodenalis mono-infection. 125 patients were randomly assigned to receive either NTZ [500 mg two times daily for three days (n= 62)] or SNZ [2 g single dose (n= 63)]. The evaluation of the efficacy was based on parasitological response. All patients were asked to provide three faecal samples on days 3, 5, and 10 after treatment completion. Patients were considered to be cured if no Giardia trophozoites or cysts were found in any of the three post-treatment faecal specimens evaluated by direct wet mounts and/or after Ritchie concentration techniques.
23.Development of Visible Spectrophotometric Methods for the Estimation of Nitazoxanide in Bulk and Pharmaceutical Formulation Using Ferric Chloride40.
24. Development and Validation of a Dissolution method with Isocratic High-Performance Liquid Chromatographic Determination of Nitazoxanide and Ofloxacin in Pharmaceutical Dosage form41.
Sharma M.C, et al., devoloped a simple, specific, accurate and precise Isocratic reverse phase high pressure liquid chromatographic method for the simultaneous determination of Nitazoxanide and Ofloxacin from combined dosage form by reverse phase separation on columns containing different stationary phases, the final choice giving satisfactory resolution and run time was the 25 cm × 4.6 mm i.d, 5-μm particle; Phenomenex Luna C18 reversed-phase column. 2.0gm sodium dihydrogen phosphate and 5M of triethylamine are mixed into 500mL Milli Q water and pH was adjusted to 4.5 by orthophosphoric acid and diluted to 1000mL as a mobile phase at a flow rate of 1.2ml/min and detection at 246nm. The average retention times for amoxicillin (Internal standard), Nitazoxanide and Ofloxacin was found to be 3.11, 5.28 and 7.31 min, respectively and recoveries from combined dosage form were between 98 and 102%. Quantification and linearity was achieved at 276 nm over the concentration range of 100-400 μg mLG1 for Nitazoxanide and 10-150 μg mLG1 for Ofloxacin. The method was validated for specificity, linearity, accuracy, precision, LOD, LOQ and robustness. The proposed method was optimized and validated as per the ICH guidelines. The method can be used for estimation of combination of these drugs in combined dosage form.
25.A Validated Stability Indicating RP-LC Method for Nitazoxanide, a New Ant parasitic Compound42.
(N-(5-nitro-1,3-
thiazol-2-yl) acetamide) and Imp-C (2-{[(5-nitro-1,3-thiazol-2-yl) amino] carbonyl} phenyl 2-(acetyloxy) benzoate) was found greater than three. The developed RP-HPLC method was validated with respect to response function, accuracy, precision, specificity, stability of analytical solutions and robustness. Also to determine related substances and assay determination of nitazoxanide that can be used to evaluate the quality of regular production samples. The developed method can also be conveniently used for the assay determination of nitazoxanide in pharmaceutical formulations.
26.Method Development and Validation for Assay of Nitazoxanide in Tablet Using RP-HPLC43.
Valarmathy J, developed a simple, selective, rapid, precise and accurate reverse phase high pressure liquid chromatographic method for the assay of nitazoxanide (NTZ) in tablets. An isocratic LC separation was performed on a inertsil C18 (250mm×4.6mm) Column with mobile phase consisting of 0.005M tetra butyl ammonium hydrogen sulphate (45): acetonitrile (55): at a flow rate at 1.0 (ml/min). Detection was carried out at 345 nm. The retention time of nitazoxanide was 7.468 min respectively. The developed method was validated for linearity, accuracy, precision, solution stability, robustness, ruggedness. There was no interference of excipients on the determination of active pharmaceutical ingredients. It can be applied to the quantitative determination of drug in tablets and powder for oral suspension.
27.RP-HPLC Determination of Nitazoxanide in Bulk and Different Tablet Formulations44.
The mean percent recoveries were found to be 100.19. 0.584 for Brand 1 and 100.26. 1.1341 for Brand 2. The method was validated with respect to linearity, precision and accuracy as per the International Conference on Harmonisation (ICH) guidelines.
28.Development and validation of nitazoxanide in tablet dosage form.45
Sonal Bhale, et al; put forwarded a simple, precise, accurate, rapid and reproductive RPHPLC procedure for the determination of Nitazoxanide (NTZ) in tablet dosage form at a single wavelength. The mobile phase used was a combination of methanol: water: acetonitrile (30:40:30% v/v/v). The detection of NTZ was carried out at 330nm & flow rate was set to 1ml/min. Linearity was obtained in the concentration range of 5‐25ug/ml of NTZ with correlation coefficients of 0.9948. The results of the analysis were tested and validated statistically for various parameters according to ICH guidelines and recovery studies confirmed the accuracy of the proposed method.
29.RP-HPLC methods for estimation of Nitazoxanide single and simultaneous estimation of Nitazoxanide with Ofloxacin in pharmaceutical dosage forms46.
of analysis shows that the amounts of drugs were in good agreement with the labeled claim of the formulations. The method validation parameters checked as per the ICH guidelines. Thus the methods are specific and sensitive.
30.Mixed Hydrotropy in Spectrophotometric Analysis of Nitazoxanide47
Sherje AP, et al; investigated and illustrated the application of mixed hydrotropy. There was significant synergistic effect on enhancement in solubility of a poorly water soluble drug by mixing two hydrotropic agents. The enhancement in solubility of nitazoxanide was more than 10 and 12 folds in 1M sodium benzoate solution (SB) and 1M sodium salicylate (SS) solution, respectively as compared to its solubility in distilled water. The enhancement in the solubility of nitazoxanide in a mixed hydrotropic solutions (SB-SS) containing 1M sodium benzoate and 1M sodium salicylate was more than 17 folds. Thus, a mixed hydrotropic solution of sodium benzoate and sodium salicylate was employed to carry out spectrophotometric analysis precluding use of organic solvents. The tablets containing nitazoxanide were analyzed successfully. Recovery studies and statistical data proved accuracy, reproducibility and the precision of the proposed method. The presence of hydrotropic agents did not interfere in the analysis.
31.Stripping Voltammetric Methods for Determination of the Ant parasitic Drug Nitazoxanide in Bulk Form, Pharmaceutical Formulation and Human Serum48.
Hanaa S. El-Desoky, et al; recorded the cyclic voltammograms of nitazoxanide at the hanging mercury drop electrode in the Britton-Robinson universal buffer of pH values 2 to 11 containing 20% (v/v) ethanol exhibited a single 4-electron irreversible cathodic peak corresponding to the reduction of its NO2 group to the
nitazoxanide. Limits of detection of 1.5×10⁻¹⁰, 2.4×10⁻¹⁰ and 3.0×10⁻¹¹ mol L-1 and limits of quantification of 5.0×L-10-L-10, 8.0×L-10-L-10 and L-1.0×L-10-L-10 mol L-L-1 nitazoxanide in the bulk form were achieved by means of the described LS, DP and SW adsorptive cathodic stripping voltammetric methods, respectively. The described methods were successfully applied for determination of nitazoxanide in its pharmaceutical formulation (Cryptonaz powder) and in spiked human serum without the necessity for sample pretreatment, time consuming extraction steps or formation of colored chromogens prior to the analysis. Besides, nitazoxanide was successfully determined without interference from its acid or base-induced degradation products indicating the stability-indicating power of the described voltammetric methods.
IV AIM OF PRESENT STUDY
No official methods have been mentioned in IP, BP for the estimation of nitazoxanide in raw materials and in pharmaceutical dosage forms. From the literature review it was revealed that there were only few HPLC and spectrophotometric methods reported.
So there is a need to develop simple, rapid, reproducible and economic spectrophotometric methods for the estimation of nitazoxanide.
V PLAN OF WORK
The present work deals with the determination of three spectrophotometric methods.
i. First method is based on the formation of Schiff’s base. ii. Second method is based on diazotization coupling method. iii. Third method is based on a simple spectrophotometric method.
iv. Fourth method is Reverse-Phase High Performance Liquid Chromatography.
IV INSTRUMENTS AND MATERIALS USED
1. Perkin Elmer EZ 301-UV-Visible Double beam spectrophotometer 2. Shimadzu - Analytical balance-0.1mg
3. Shimadzu,Japan - Electronic balance AY220 4. Micro pipette (1ml,0.02ml) - Huawei 5. Accu pipette (0.2ml) - Huawei 6. Zinc powder (AR)
7. Conc. HCl (AR)
8. 4-Hydroxy benzaldehyde (AR) 9. Sodium nitrite (AR)
10.Ammonium sulphamate (AR) 11.Phluroglucinol (AR)
12.Methanol (AR) 13.Distilled water 14.HPLC (Shimadzu)
15.Dipottasium hydrogen phosphate:acetonitrile
VII INTRODUCTION TO PRESENT STUDY
Nitazoxanide49 is used for the treatment of diarrhea caused by Giardia lambia /intestinalis or Cryptosporidium parvum. This novel agent has a broad spectrum of activity against many other gastrointestinal pathogens, including bacteria, round worms, flat worms and flukes. Nitazoxanide is used in many areas of the world, especially in Central and South America, as broad-spectrum parasiticidal agents in adults and children. Chemically nitazoxanide is [2-[(5-nitro-1, 3-thiazol-2-yl) carbamoyl] phenyl] ethanoate.
Absorption spectroscopy is considered as a versatile technique frequently used in pharmaceutical analysis. Using this technique many pharmaceutical substances can be determined by UV-visible spectrophotometry, HPLC with great precision and accuracy.
1st Method:-It is based on the formation of Schiff’s base (Aromatic aldehydes react with aliphatic /aromatic amines to form a derivative known as Schiff’s base)
2nd Method: -It is based on diazotization & coupling method. In this method nitazoxanide was reduced by Zn dust and 5N HCl, and then it is diazotized with HNO2 and excess of HNO2 was destructed by ammonium sulphamate. The diazotized salt was coupled with phluroglucinol to form a light orange coloured dye having maximum absorbance at 450nm.
O C H3C
O C O N H N S NO2
Zn / HCl
Nitazoxanide
O C H3C
O C O N H N S NH2 Reduced Nitazoxanide
NaNO2 / HCl
O C H3C
O C O N H N S N Diazonium Salt N Cl OH HO OH Phluroglucinol O C H3C
O C O N H N S N
Azo Dye (Light Orange Colour)
HO
HO
3rd Method:-It is a simple spectrophotometric method using methanol as solvent. It shows maximum absorbance at 340nm.
4th method:-A rapid, precise and accurate high performance liquid chromatographic method for the determination of nitazoxanide in bulk drug and pharmaceutical formulation. The devoloped method was validated in terms of different parameters.
SPE Spec hydr Chem 1 2 3 4 Chem Chem Mole Mole Solu Sligh Prep CTROPHOT ctrophotome roxybenzalde micals used: 1. 4-Hydrox 2. Methano 3. Conc.HC 4. Zn powd
mical Structu mical Name ecular Form ecular Weig ubility:- htly soluble
paration of
4-It was pr
TOMETRIC etric determi ehyde56 - xy benzaldeh ol (AR) Cl (AR) der (AR) ure:
: - p-hydroxy
mula: - C7H8O
ght: - 122.12
in water and
-hydroxy be
repared by di
VIII MET
C DETERMI
ination of n
hyde (AR)
yl benzaldeh
O2
2g/mol
d soluble in m
enzaldehyde issolving 2g
THODOL
INATION-Ι nitazoxanide hyde methanol (2%) of 4-hydroxOGY -
Ι
e by Schiff’
xy benzaldeh
’s base meth
hyde in 100m
hod using 4
ml methanol
Preparation of standard stock solution
25mg of nitazoxanide was dissolved in 5ml of methanol and was treated with 2.5ml 5N HCl and 200mg Zn powder with continuous stirring for 20mts at room temperature. It was then filtered and the residue was washed with methanol. Then the volume was made upto25ml with methanol (Stock solution Ι, 1000µg/ml)
Absorption spectra of coloured species
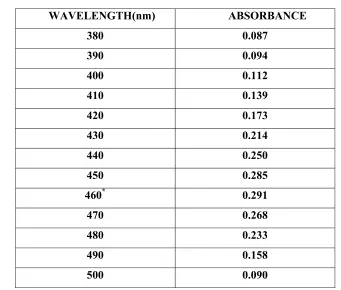
5ml of standard stock solution Ι was pipetted into 50ml volumetric flask and it was diluted to 50ml with methanol (Stock solution ΙΙ, 100µg/ml). From this 3ml was pipetted out into 10ml volumetric flask and 1ml of 2% 4-hydroxy benzaldehyde, 1ml of Conc.HCl were added and kept aside for 5mts. The volume was made up to 10ml with methanol. The final volume concentration of the solution was 30µg/ml. The absorbance was measured between 340-480nm against reagent blank.
Readings were shown in table no:1 and plotted in graph no:1
Absorption spectra for the drug nitazoxanide by using 4-hydroxy benzaldehyde
[image:48.612.141.482.410.700.2]Drug concentration-30µg/ml
TABLE NO: 1
WAVELENGTH(nm) ABSORBANCE
380 0.087 390 0.094 400 0.112 410 0.139 420 0.173 430 0.214 440 0.250 450 0.285
460* 0.291
470 0.268 480 0.233 490 0.158 500 0.090
Calibration curve for nitazoxanide using 4-hydroxy benzaldehyde
GRAPH NO: 1
0.087 0.094
0.112 0.139
0.173 0.214
0.25
0.285 0.291 0.268
0.233
0.158
0.09
0 0.05 0.1 0.15 0.2 0.25 0.3 0.35
380 400 420 440 460 480 500
Absorba
n
ce
Effect of reagent concentration
Choosing of correct reagent concentration was an important aspect in the colorimetric determination. The optimum concentration of reagent was chosen by adding 1ml of reagent of different concentration .ie 1%, 2%, 3% of 4-hydroxy benzaldehyde solution in methanol with series concentration of drug solution.
The calibration curve for each concentration was prepared by using drug in the concentration range of 10-50µg/ml and the absorbance was measured at 460nm against reagent blank. The readings were recorded in table no: 2 graphically plotted in graph number 2.
Data for calibration curve plot with different reagent concentration
TABLE NO: 2
Drug concentration (µg/ml)
Absorbance of reagent concentration
1% 2% 3%
10 0.062 0.092 0.184
20 0.132 0.187 0.285 30 0.204 0.277 0.403
40 0.276 0.364 0.498 50 0.347 0.455 0.530
Calibration curve plot for nitazoxanide with different reagent concentration
GRAPH NO: 2
0 0.062
0.132
0.204
0.276
0.347
0
0.092
0.187
0.277
0.364
0.455
0
0.184
0.285
0.403
0.498
0.53
0 0.1 0.2 0.3 0.4 0.5 0.6
0 10 20 30 40 50 60
Absorba
n
ce
Drug Concentration mcg/ml
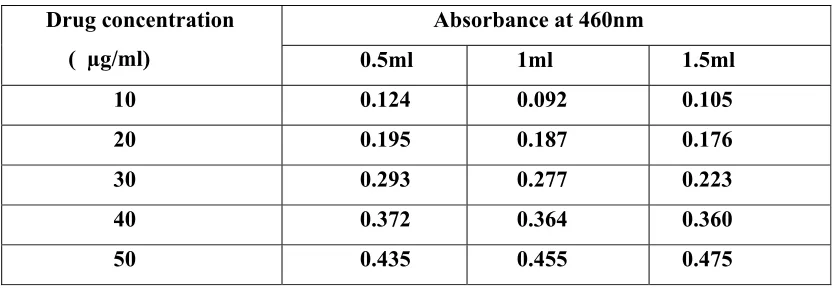
Effect of reagent amount
[image:52.612.108.525.275.419.2]Addition of correct amount of reagent was an important aspect in this experiment. The optimum amount of reagent was fixed by constructing calibration curve. The calibration curve was prepared by employing the drug in the concentration range of 10-50µg/ml with different amount of reagent.ie 0.5ml, 1ml, 1.5ml. The readings were recorded in table no: 3 and graphically plotted in graph no: 3
TABLE NO: 3
Drug concentration ( µg/ml)
Absorbance at 460nm
0.5ml 1ml 1.5ml 10 0.124 0.092 0.105 20 0.195 0.187 0.176 30 0.293 0.277 0.223 40 0.372 0.364 0.360 50 0.435 0.455 0.475
Calibration curve plot for nitazoxanide using different amounts of 2%reagent concentration
GRAPH NO: 3
0 0.124 0.195 0.293 0.372 0.435 0 0.092 0.187 0.277 0.364 0.455 0 0.105 0.176 0.223 0.36 0.475 0 0.05 0.1 0.15 0.2 0.25 0.3 0.35 0.4 0.45 0.5
0 10 20 30 40 50 60
Abso
rbance
Drug Concentration mcg/ml
FIXATION OF VARIOUS PARAMETERS
1.
λ
max(
Wavelength maximum)The absorption spectral data showed that the maximum absorbance was observed at 460nm when scanned between 380-500nm.
2. Specific extinction coefficient
The specific extinction coefficient can be calculated by using the formula:-
E1%1cm=A/IC
where,
A-Absorbance
I-Light pathlength expressed in cm C-Concentration of drug in g/100ml BEERS’S LAW PLOT
Beer’s law states that the fraction of the monochromatic radiant energy absorbed on passing through a solution is directly proportional to concentration of the absorbent. Log10 I0/It=K.C
where,
K-Proportionality constant C-Concentration
I0-I intensity of incident light
It-Intensity of transmitted light
Having fixed other parameter, Beer’s law plot was constructed by measuring the absorbance of various concentration of drug solution against reagent blank.
SCHEMATIC REPRESENTATION OF BEER’S LAW PLOT
25mg of pure nitazoxanide ♦ 25ml (solution- I, 1000µg/ml)
5ml→50ml (solution-II, 100µg/ml)
1ml 2ml 3ml 4ml 5ml
* * * * *
10ml 10ml 10ml 10ml 10ml
(10µg/ml) (20µg/ml) (30µg/ml) (40µg/ml) (50µg/ml)
♦200mg Zn powder+2.5ml 5N HCl+5ml methanol
*1ml 2%4-hydroxy benzaldehyde+1ml Conc.HCl
[image:55.612.133.489.103.354.2]DATA FOR BEER’S LAW PLOT
TABLE NO: 4
Drug concentration (µg/ml)
Absorbance
10 0.092 20 0.185 30 0.277 40 0.363 50 0.455
Calibration curve for nitazoxanide using 4-hydroxy benzaldehyde
GRAPH NO: 4
0
0.092
0.185
0.277
0.363
0.455
0 0.05 0.1 0.15 0.2 0.25 0.3 0.35 0.4 0.45 0.5
0 10 20 30 40 50 60
Absor
b
ance
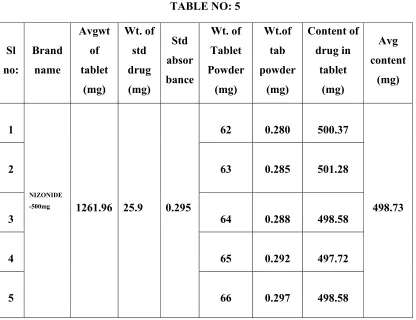
ASSAY OF TABLET
10 tablets of nitazoxanide were taken for analysis. The average weights of tablets were calculated and were powdered in a glass mortar. Tablet powder equivalent to 25mg was accurately weighed and dissolved in 5ml of methanol and treated with Zn powder (200mg) and 2.5ml 5N HCl with continuous stirring for 1hr at room temperature. It was filtered and the residue was washed with methanol and then the volume was made up to 25ml with methanol (Solution-I). 5ml of stock solution-1 was pipetted into 50ml volumetric flask and the volume was made upto 50ml with methanol solution-II). From this 3ml was pipette out into 10ml volumetric flask followed by addition of 1ml 2%, 4-hydroxy benzaldehyde and 1ml concentrated HCl and kept aside for 5mts. The volume was made up with methanol to produce final drug concentration of 30µg/ml. The absorbance of this solution was measured at 460nm against reagent blank. The same procedure was repeated 5 times. In similar manner standard absorbance was measured with pure drug in same final concentration that of assay method. The data for assay of tablet were recorded in table no: 5.
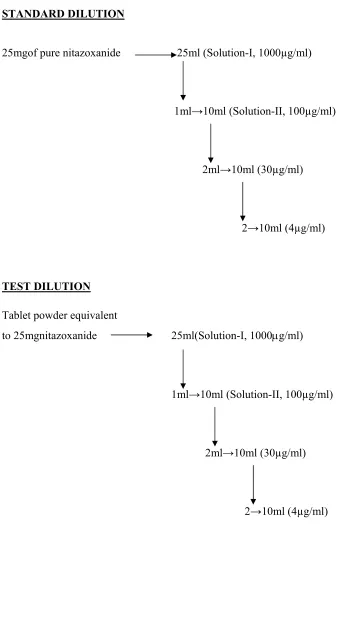
STANDARD DILUTION
25mg of pure nitazoxanide ♦ 25ml (solution-I, 1000µg/ml)
5ml→50ml (solution-II, 100µg/ml)
*
3ml→10ml (30µg/ml)
♦200mg Zn powder+2.5ml 5N HCl+5ml methanol
TEST DILUTION
25mg of pure nitazoxanide ♦ 25ml (solution- I, 1000µg/ml)
5ml→50ml (solution-II, 100µg/ml)
*
3ml→10ml (30µg/ml)
♦200mg Zn powder+2.5ml 5N HCl+5ml methanol
*1ml ,2% 4-hydroxy benzaldehyde+1ml Conc. HCl
CALCULATIONS
Using the absorbance of the standard and sample solution, the content of tablet was calculated as follows:-
The content of nitazoxanide present in each tablet of average weight =
Test absorbance Std absorbance x
Wt of std drug mg
25 x
5 10 x
25
[image:59.612.111.527.139.459.2]
DATA FOR ASSAY OF TABLET (Label claim: 500mg)
TABLE NO: 5
Sl no: Brand name Avgwt of tablet (mg) Wt. of std drug (mg) Std absor bance Wt. of Tablet Powder (mg) Wt.of tab powder (mg) Content of drug in tablet (mg) Avg content (mg) 1 NIZONIDE
-500mg 1261.96 25.9 0.295
62 0.280 500.37
498.73
2 63 0.285 501.28
3 64 0.288 498.58
4 65 0.292 497.72
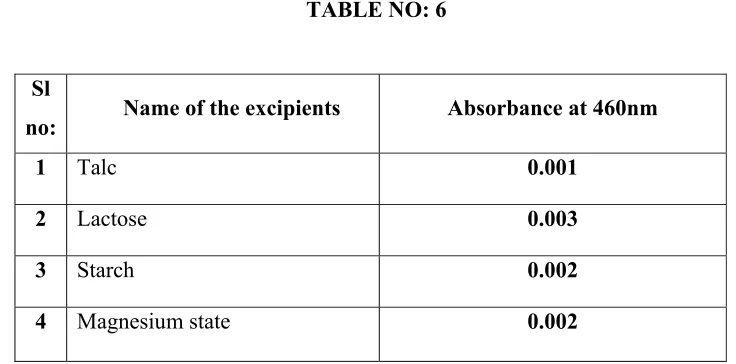
INTERFERENCE STUDIES
The interference studies of additives used in the formation of tablet were done by distributing them individually in distilled water and set aside for 10mts before filtering. The filtrate was diluted and proceeded as per tablet assay and the absorbance was measured at 460nm against reagent blanks.
This procedure was repeated 5 times of each additive and the average value for each additive was given the following table no: 6
[image:60.612.128.496.301.483.2]DATA FOR THE INTERFERENCE STUDIES TABLE NO: 6
Sl
no: Name of the excipients Absorbance at 460nm
1 Talc 0.001
2 Lactose 0.003
3 Starch 0.002
4 Magnesium state 0.002
The results show that the effect of interference studies in this spectroscopic method was found to be negligible.
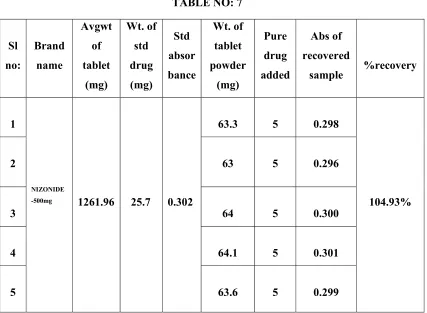
RECOVERY STUDIES
In order to justify the reliability and suitability of the proposed method, recovery studies were carried out.
standard solution (1mg/ml) of pure sample of nitazoxanide was added to the flask. It was shaken well and the volume was made upto 25ml with methanol and the procedure for the assay of nitazoxanidewas followed. The experiment was repeated 5 times. The results were recorded in table no: 7. The percentage recovery was calculated by using the formula:-
[image:61.612.109.536.268.581.2]% of Recovery= x 100
TABLE NO: 7
Sl no: Brand name Avgwt of tablet (mg) Wt. of std drug (mg) Std absor bance Wt. of tablet powder (mg) Pure drug added Abs of recovered
sample %recovery
1
NIZONIDE
-500mg 1261.96 25.7 0.302
63.3 5 0.298
104.93%
2 63 5 0.296
3 64 5 0.300
4 64.1 5 0.301
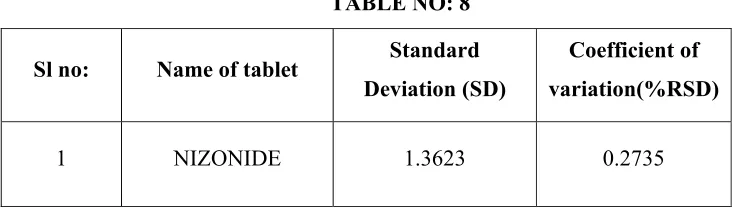
STANDARD DEVIATION
It is determined by assaying a sufficient number of aliquots of a homogenous sample to be able to calculate statistically valid estimation of the standard deviation using the formula:-
SD =
X-Observed value
x-mean/arithmetic average
N-Number of observations
The square root of standard deviation is called variance./The more accurate measure of precision is called Coefficiant of variation/%RSD
%RSD= (SD/x) x 100
PRECISION57
The precision of an analytical method is the degree of reproducibility among the individual test results when the procedure was applied repeatedly to multiple sampling of homogenous sample. The precision of an analytical method is usually expressed as standard deviation or percentage RSD of a series of measurements.
[image:62.612.133.504.489.595.2]The precision study was done based on the data obtained from table no: 7 and the results were shown in table no: 8
TABLE NO: 8
Sl no: Name of tablet Standard
Deviation (SD)
Coefficient of variation(%RSD)
ACCURACY57
[image:63.612.119.513.199.263.2]Accuracy is the closeness of the test results obtained by the procedure to the true value. Accuracy of the proposed method was evaluated by comparing the average value obtained by the proposed method with that of reported method (standard method) and results were given table no: 9
TABLE NO: 9
Sl no: Amount obtained by standard
method Amount obtained by proposed
1 499.05mg 498.73mg
STANDARD METHOD
Preparation of standard
10mg of pure nitazoxanide was accurately weighed and transferred into 25ml volumetric flask and made up to 10ml with DMF (stock solution-I). 1ml of solution-I was pipetted into 10ml volumetric flask and the volume was made up to 10ml wit