1
MORPHOMETRIC ANALYSIS OF THE
ADULT KNEE AND ITS CORRELATION
WITH CURRENT KNEE ARTHROPLASTY
SYSTEMS
Dissertation submitted for
M.D Anatomy Branch V
Degree Examination
The Tamil Nadu Dr. M.G.R Medical University,
Chennai, Tamil Nadu
2
CERTIFICATE
This is to certify that
“Morphometric analysis of the
adult knee and its correlation with current knee
arthroplasty systems” is a bona fide work of
Dr. Samuel
Frank Stephen in partial fulfillment of the requirements
for the M.D. Anatomy examination (Branch V) of The Tamil
Nadu Dr. M.G.R Medical University to be held in April
2013.
Dr. SUNIL JONATHAN HOLLA, M.S.,
Professor and Guide,
Department of Anatomy Christian Medical College, Vellore, Tamil Nadu.
Dr. IVAN JAMES PRITHISHKUMAR, M.S.,
Associate Professor and Co-guide Department of Anatomy,
3
CERTIFICATE
This is to certify that
“Morphometric analysis of the
adult knee and its correlation with current knee
arthroplasty systems” is a bona fide work of
Dr. Samuel
Frank Stephen in partial fulfillment of the requirements
for the M.D. Anatomy examination (Branch V) of The Tamil
Nadu Dr. M.G.R Medical University to be held in April
2013.
Dr. BINA ISAAC, M.S., Dr. ALFRED JOB DANIEL, M.S.,
Professor and Head, Principal,
Department of Anatomy Christian Medical College
4
ACKNOWLEDGEMENTS
I sincerely thank,
Dr. Sunil J. Holla, my guide, for his constant guidance,
encouragement, and for his meticulous attention to detail.
Dr. Ivan James Prithishkumar, my mentor and co-guide,
for his enduring support and for making my ideas to take
direction.
Dr. Bina Isaac (Head, Department of Anatomy), for her
encouragement and advice.
Dr. Manasseh Nithyananth (Associate Professor,
Department of Orthopedics) for his help since the early stages
of inception, his ongoing advice and for information on the
implants.
The Department of Anatomy, St. John’s College, Bangalore
for allowing me to use their lab and facilities.
Dr. Tripti Jacob (Assistant Professor, Department of
Anatomy), for being a role model in hard work and sincerity.
Dr. Jayaprakash Muliyil (Professor Emeritus), for helping
me to appreciate epidemiology and statistics.
Dr. Jeyaseelan. L (Head, Department of Biostatistics) for
5
To the Institutional Review Board (IRB) of Christian
Medical College Vellore for giving me permission and for
funding this project.
All my co-postgraduates for their timely help.
All non-teaching staff in the anatomy department for giving
their time and energy whenever required.
My friends and relatives for their prayers.
My parents for sacrificing their lives so that I could grow.
Sharon, for being a constant friend.
Most importantly, I thank my Lord Jesus Christ for being my
strength and my help and for giving meaning to my life and
6
CONTENTS
Page number
1. Introduction 1
2. Aim 3
3. Objectives 4
4. Literature review 5
5. Materials and Methods 14
6. Results 24
7. Discussion 51
8. Conclusions 67
9. Limitations 69
10. References 70
ABSTRACT
TITLE: MORPHOMETRIC ANALYSIS OF THE ADULT KNEE AND ITS CORRELATION WITH CURRENT KNEE ARTHROPLASTY SYSTEMS
DEPARTMENT : ANATOMY
NAME OF THE CANDIDATE : SAMUEL FRANK STEPHEN
DEGREE AND SUBJECT :
M.D. Anatomy (Branch V)
NAME OF THE GUIDE : Dr. SUNIL JONATHAN HOLLA
OBJECTIVES:
To measure the dimensions of distal femur, proximal tibia and
patella in the Indian population by collecting data from cadaveric knees and dry bones and to obtain the fraction ‘Aspect ratio’.
To compare these dimensions between male and female specimens
to identify gender differences.
To compare the morphometric dimensions with other racial groups
and with current knee arthroplasty systems in India
METHODS:
Dissection of the knee joint was done on fourteen adult cadavers (8 female and 6 male) and measured. The dry bones measured were181 femurs and 161 tibias. All the data was entered into Excel workbook sheets (Microsoft Office Excel; version 2007, Microsoft ® Corporation, US.) and analysed using SPSS (version 17.0; SPSS Inc., Chicago, IL). The statistical analyses done were measures of dispersion, bivariate
correlation analysis and liner regression analysis. Student’s t test for
RESULTS:
In the dry bones Aspect ratio for the distal femur was 1.29 ± 0.1 and
for the proximal tibia was 1.52 ± 0.18.
In the cadaveric data Aspect ratio for the distal was 1.27 ± 0.4 and
for the proximal tibia was 1.48 ± 0.2.
On comparing the morphometry of the distal femur and proximal
tibia between the two genders it was found that the measurements were significantly more in males than in females.
On comparing with other racial groups the dimensions of the distal
femur were smaller as compared to the Caucasian and other Asian races. No such differences were found while comparing the dimensions of the proximal tibia.
The femoral component of the present knee arthroplasty systems
7
1. INTRODUCTION
Osteoarthritis is a degenerative joint disorder commonly affecting
the knees, which is now being treated often by total knee
replacement. Success of total knee replacement surgery depends a
lot upon the choice of the knee prosthesis. Many studies amongst
other population groups have shown the need for a race and gender
specific knee prostheses. However, there is scanty literature on the
morphometry of the normal adult Indian knee with relevance to
knee replacement.
The currently used knee arthroplasty systems for total knee
replacement in India are based on morphometric patterns of
Western population. There is a need therefore, to improve the
design and kinematics of knee prosthesis available in India in order
to duplicate patient anatomy more closely. In order to fulfill this
need, the initial step would be to have a comprehensive
morphometric data on non-osteoarthritic Indian knees.
In this study, dimensions of the distal femur, proximal tibia and
patella were measured from dry bones in the Departments of
Anatomy at Christian Medical College (CMC) Vellore and St. John’s
Medical College, Bangalore, and dissected cadavers at CMC Vellore.
8 identify significant differences so that the need for gender specificity
in knee prosthesis can be ascertained.
The aspect ratio which is the ratio of the medial-lateral
dimensions to anterior-posterior dimensions was assessed for the
proximal aspect of the tibia and the distal part of the femur in order
to determine the individuality of the knee morphometry in the
Indian race.
These anthropometric measurements will provide guidelines for
designing knee prostheses which are specific for the Indian
9
2. AIM
To study the morphometry of normal adult knees in the Indian
population in order to assess the need for a knee arthroplasty
10
3. OBJECTIVES
- To measure the dimensions of distal femur, proximal tibia and
patella in the Indian population by collecting data from cadaveric
knees and categorized dry bones.
- To compare the morphometry of the distal femur, proximal tibia
and patella between male and female specimens in order to
identify gender differences if any.
- To estimate the mean aspect ratio (mediolateral dimension
divided by the anteroposterior dimension) of the femur and tibia in
Indian knees.
- To compare the morphometric dimensions with other racial
groups across the world.
- To compare the morphometric dimensions with current knee
11
4. LITERATURE REVIEW
4.1: Structure and design of the human knee
The knee is the largest synovial joint in the body and functions
to control the centre of body mass and posture in the activities of
daily living. This requires a large range of movements in three
dimensions together with the ability to withstand high forces.
The joint consists of a complex array of bone, soft tissue, muscle
and fluid, making it the most sophisticated joint in the human
frame. It has three distinct and partially separated compartments
which are; two condyloid joints (tibio-femoral joints), one between
each condyle of the femur and the corresponding meniscus and
condyle of the tibia; and a third between the patella and the femur
(patello-femoral joint), that together form a complex hinge joint.
This articulation, allows for motion in six degrees of freedom and
makes the knee joint inherently unstable and especially susceptible
to damage(1).
4.2: Insult to the knee joint
The knee joint is involved in several degenerative and
inflammatory disorders of which the commonest one is
osteoarthritis (OA). Osteoarthritis is a chronic degenerative disorder
12 and periarticular bone remodeling. Studies estimate the prevalence
of OA in India is 22-39% (2) amongst patients with joint disease.
Osteoarthritis of the knee is the most common cause of locomotor
disability in the elderly. Patients with persistent pain and
progressive limitation of daily activities despite medical
management may be candidates for surgery in whom, total knee
replacement is proven to be safe and cost effective treatment for
alleviating pain and restoring physical function (2).
4.3: Total knee replacement
The introduction of the total condylar prosthesis by Insall and
colleagues in 1972, marks the era of modern knee replacement (3).
This prosthesis was the first to replace all three compartments of
the knee. Modern total knee arthroplasty consists of resection of
the diseased articular surfaces of the knee, followed by resurfacing
with metal and polyethylene prosthetic components. For the
properly selected patient, the procedure results in significant pain
relief, improved function and quality of life (4)
Outcome of a knee replacement surgery may be influenced by
factors related to choice of prosthesis. Improvement in success
rates have been achieved with the evolution of prosthesis design
over time. There are a large number of manufacturers and designs
13 prosthesis choice leading to wide variance among individual
surgeons (5).
In total knee arthroplasty (TKA), improper fit between the
implant and the bony surface leads to several problems. If
components are too small (underhang), the bone–implant interface
will be reduced leading to higher contact stresses, increased risk of
fracture and accelerated process of loosening. The Swedish Knee
Arthroplasty Register (2006) reported this problem as the main
reason for TKA revision between 1995 and 2004 (6). Conversely, if
components are too large (overhang), they may impinge on the
surrounding capsular tissues and ligaments, causing pain and
limiting the range of motion of the joint(7).
4.4: Anthropometric measurements of the knee joint
Anthropometry is the scientific study of the measurements and
proportions of the human body. Various anthropometric
measurements of the knee joint have been used to obtain a three
dimensional morphometry of the knee joint. The common
measurements are anteroposterior and mediolateral dimension of
the femur and the tibia. The patellar dimensions measured are
mediolateral and superoinferior width.
The aspect ratio of the femur which is the ratio of the
14 important measurement used for correlation and comparison with
various knee arthroplasty systems.
A study done by Hitt et al. involved collection of morphometric
measurements of the knees of 295 patients undergoing total knee
primary arthroplasty. The mean femoral aspect ratio reported for
men was 0.81 and for women was 0.84 showing an obvious gender
difference, and on correlating the measurements of the distal
femoral and proximal tibial measurements with those of existing
knee arthroplasty systems, it was found that the prostheses were
not adequately sized (8).
In China, Cheng et al. used three dimensional CT measurements
of the proximal tibia and distal femur of 172 knees and compared
the anthropometric measurements with five total knee prostheses.
They found that in the smaller sized prostheses, the tibial
mediolateral dimension was undersized while in the larger
prostheses there was overhang of the same. Decrease in aspect
ratio with increase in anteroposterior diameter was found in both
the tibia and the femur, as compared to the constant aspect ratio
shown by conventional total knee prostheses(9). These studies
show that detailed anthropometric measurements of the knee joint
are needed to design better prostheses which may improve the
15 The anthropometric measurements done in studies so far have
been performed on osteoarthritic knees either intra-operatively after
resection or using computed tomography/ magnetic resonance
imaging. However, to ascertain the true measurements and
proportions of the human knee, one needs to study normal joints
and bones, which is possible only by dissection on cadavers and by
dry bone measurements.
4.5: Gender differences in knee morphometry
The major anatomical differences between the knees of males
and the knees of females need to be studied to support, or refute
the need for a female specific implant design.
Conley et al. have advocated the need for a female-specific total
knee design based on three anatomic variations of the female knee
as compared to the male knee. These are an increased Q Angle, less
prominent anterior medial and lateral femoral condyles and a
reduced medial-lateral to antero-posterior (ML:AP) femoral condylar
aspect ratio (10). The Q angle is the complimentary angle formed
between the patellar tendon and the resultant line of force of the
quadriceps muscles. Women have been found to have a larger Q
angle than men in several studies (11).
The anterior condylar height is less pronounced in female knees
16 radiological study of the knee anatomy of 200 normal subjects, half
of whom were women and found that the anterior height of the
lateral and medial condyles in women were 1.5mm and 1.1mm
lower as compared to that of the males (12).
The ML: AP aspect ratio has been reported to be less in the
female knee. As mentioned earlier, the multi centric study done by
(? Kirby) Hitt et al. found that the distal femoral aspect ratio was
smaller in females as compared to males and different implants
significantly varied in accommodating this difference (12).
There is currently no scientific literature available about the
gender differences in knee anthropometric measurements in the
Indian population.
4.6: Differences of knee anthropometry between population groups
Anthropometric studies have suggested that current design of
total knee arthroplasty (TKA) does not cater to the racial differences
in knee anthropometry. Most of the commercially available TKA
prostheses are designed according to the anthropometric data of
Caucasian knees and this may lead to component mismatch in
Asian people.
Yue et al. undertook a study among healthy Chinese and
17 measurements using three dimensional models of the knees by CT
and MRI. The study showed that Chinese females had a
significantly narrower distal femur than Caucasian females
whereas Chinese men had a wider proximal tibia than their
Western counterparts. The study confirmed the hypothesis that
there is a significant difference in size and shape between Chinese
and Caucasian knees (13).
Ho et al. did morphometric measurements in the resected
femurs of seventy Chinese patients who underwent total knee
arthroplasty and compared them to five femoral implants currently
used. Three implants were found to have a larger medial-lateral
width than the total width of the resected distal condyle and so they
had a tendency to overhang. The study concluded that femoral
implants which were previously shown to be suitable for use in
Caucasian patients were not suitable in Chinese patients and
manufacturers needed to design femoral implants better suited to
Chinese patients (14).
These studies and similar ones done in Japan, Korea and
Taiwan show that there are significant racial differences in the
shape and size of the knee and this may impact on the design of
18
4.7: Anthropometric measurements of the knee joint in the Indian
population
In India, a morphometric study was done by Vaidya et al. among
patients with osteoarthritis using CT scan. 47 patients with
osteoarthritis were studied of which 21 were men and 26 women.
The study showed that most Indian men (86.8%) could have the
femoral component satisfactorily replaced by available designs.
However, a statistically significant number of women (60.4%) had
femoral anteroposterior diameters smaller than the smallest
available femoral component and they also had splaying in
mediolateral dimension. This study concluded that the implants
currently used for TKA in India were not suitable for the knee
morphology of Indian patients (15).
Bagaria et al. conducted a study to measure the dimensions of
knee joints among Indians using MRI scans of 25 patients who
underwent bilateral knee scans for various joint pathologies. The
mediolateral, anteroposterior dimensions and the aspect ratio of the
femur, tibia and patella were measured and compared with the
prostheses. The study concluded that none of the current
prostheses designs correlated well with the patient’s
19 In India, there is scanty literature available on the
anthropometric measurements of the knee joint for the purpose of
correlating with the knee prostheses currently being used here.
Furthermore, the studies done so far have been imaging studies
which may not provide accurate measurements needed for
20
5. MATERIALS AND METHODS
The study was done after approval from the Institutional Review
Board (IRB) and Ethics Committee. The study included
measurements on knees of adult cadavers and unpaired dry adult
bones.
Dissection of the knee joint was done on fourteen adult cadavers
(8 female and 6 male) during routine dissection in the Department
of Anatomy, Christian Medical College Vellore. All cadavers were
embalmed and stored in 5% formalin solution. The knee joint was
meticulously dissected using standard instruments and the distal
femur, proximal tibia and patella were completely exposed for
measurements.
The dry bones (181 femurs and 161 tibias) were obtained both
from the Department of Anatomy, St. John’s Medical College,
Bangalore as well as the Department of Anatomy, Christian Medical
College, Vellore. Bones having deformity, fractures, unfused
epiphyses and macerated condyles were not included in the study.
Measurements (in cadavers and bones) were taken using the
Sliding Digital Caliper (ROBUST, Germany), with a resolution of
21
Figure 1a: Sliding digital caliper
Figure 1b: Field Osteometric Board
22 Bone length was measured using sliding Field Osteometric Board
(0-90cm) (Figure 1b).
Cadaver height was measured using a tailor’s inch tape (0-150cm),
resolution of 1.0mm (Figure 1c).
A sufficient period of ‘trial and error’ (pilot study) preceded
actual systematic record of measurements. Parameters of the knee
were standardized and measured to 1/100th of a millimeter. Each
measurement was made by one observer, voiced vocally and
recorded on a Dictaphone and its repeat measurement was done on
another day in the same way to reduce intra-observer bias that
might arise. The readings were then entered in the data form after
all the measurements had been done (Annexure I, II).
The parameters included were:
5.1: Condylar measurements in Distal Femur
5.1.1: Medio-lateral length (ML): This dimension was defined as the
maximum distance between the two femoral condyles at the
transepicondylar axis (Figure 2a).
5.1.2: Antero-posterior length (AP): The anteroposterior length of
23
Figure 2a: Measurement of Medio-lateral length (ML) between
epicondyles at the distal end of the right femur
Figure 2b: Measurement of Antero-posterior length (AP) of the medial
condyle at the distal end of the right femur
Figure 2c: Measurement of Width (W) of the medial condyle at the
24 separately and was defined as the largest measurement along its
length (Figure 2b).
5.1.3: Width of condyles (W): This dimension was defined as the
maximum thickness of the medial (WMC) and lateral (WLC) condyle
at the transepicondylar plane (Figure 2c).
5.1.4: Height of condyles (H): This dimension was defined as the
maximum distance from the tangent drawn to each condyle
(parallel to the transepicondylar axis) to the superior aspect of the
of the articular surface of the medial (HMC) and lateral (HLC)
condyle (Figure 2d).
5.1.5: Depth of intercondylar notch (DIC): This dimension was
defined as the antero-posterior depth of the femoral intercondylar
notch at the transepicondylar plane (Figure 2e).
5.1.6: Width of intercondylar notch (WIC): This dimension was
defined as the maximum width of the femoral intercondylar notch
(Figure 2f).
5.1.7: Femoral length: Length of the femur was measured using the
sliding osteometric board and defined as the maximum
measurement from the head of the femur to the common horizontal
25
Figure 2d: Measurement of Height (H) of the medial condyle at the
distal end of the right femur
Figure 2e: Measurement of Depth of intercondylar notch (DIC) at the
distal end of the right femur
Figure 2f: Measurement of Width of intercondylar notch (WIC) at the
26
5.2: Articular surface measurements in Distal Femur
5.2.1: First horizontal dimension on anterior articular surface (A):
This dimension was the distance between the medial margin to the
lateral margin of the femoral anterior articular surface at a level
just inferior to the patellar extension on the lateral condyle (Figure
3a).
5.2.2: Second horizontal dimension on anterior articular surface
(B): This dimension was defined as the extent between the medial
margin to the lateral margin of the femoral anterior articular
surface at the anterior limit of the intercondylar notch (Figure 3b).
5.2.3: Width of condyles: These dimensions were defined as the
width of the articular surface of medial (CM) and lateral (CL)
condyles along the transepicondylar plane (Figure 3c).
5.2.4: Patellar extension on the lateral condyle (X): This dimension
was defined as the extent to which the lateral condylar femoral
articular surface exceeding that of the medial condyle (Figure 3d).
5.2.5: Anteroposterior extent of anterior femoral articular surface
(Y): This dimension was defined as the midline anteroposterior
27
Figure 3a: Measurement of the first horizontal dimension (A) of the
articular surface of the distal end of the right femur.
Figure 3b: Measurement of the second horizontal dimension (B) of the
articular surface of the distal end of the right femur.
Figure 3c: Measurement of the width of the condyles (CM, CL) of the
28
Figure 3d: Measurement of the patellar extension of the lateral
condylar articular surface (X) of the distal end of the right femur
Figure 3e: Measurement of the anteroposterior extent of intercondylar
femoral articular surface (Y) of the distal end of the right femur
Figure 3f: Measurement of the length (LM. LL) of the articular surface
29 5.2.6: Length of articular surface of femoral condyles: The length of
the articular surface of the medial (LM) and lateral (LL) condyles
was measured along the middle of the articular surface using an
inch tape (0-150cm) (Figure 3f).
5.3: Condylar measurements in Proximal tibia
5.3.1: Anteroposterior length (AP): The maximum anteroposterior
length of the medial (APMC) and lateral (APLC) tibial condyle was
measured separately. The midline anteroposterior length (MAP) was
defined as the anteroposterior distance in the intercondylar region
opposite the tibial tuberosity (Figure 4a).
5.3.2: Mediolateral length (ML): This was defined as the maximum
length in the mediolateral dimension (Figure 4b).
5.4: Articular surface measurements in Proximal tibia
5.4.1: Mediolateral dimension of the tibial articular surface: This
dimension was measured on both medial (L) and lateral (K)
condyles as the maximum horizontal distance from the
corresponding intercondylar tubercle to the articular margin (Figure
30
Figure 4a: Measurement of the midline anteroposterior length (MAP) of
the proximal end of the right tibia.
Figure 4b: Measurement of the mediolateral length (ML) of the
31
Figure 4c: Measurement of the mediolateral length (L, K) of the right
tibial articular surface.
Figure 4d: Measurement of the anteroposterior length (N, M) of the
right tibial articular surface.
Figure 5a: Measurement of the superoinferior length (SI) of the right
32 5.4.2: Anteroposterior dimension of the tibial articular surface: This
dimension was measured on both medial (N) and lateral (M)
condyles as the maximum anteroposterior distance between the
tangents on the anterior and posterior borders of the respective
articular surfaces (Figure 4d).
5.5: Measurements of Patella
5.5.1: Superoinferior length (SI): This dimension was defined as the
maximum vertical distance from the base to the apex of the patella
(Figure 5a).
5.5.2: Mediolateral length (ML): This dimension was defined as the
maximum horizontal distance between the two borders of the
patella (Figure 5b).
5.5.3: Thickness (T): This dimension was defined as the maximum
thickness of the patella from the anterior surface to the vertical
intra-articular ridge on the posterior surface of the patella
5.6: Patellar Articular Surface Measurements
5.6.1: Articular Superoinferior length (aSI): This dimension was
defined as the maximum vertical length between the margins of the
33
Figure 5b: Measurement of the mediolateral length (ML) of the right
patella.
Figure 5c: Measurement of the superoinferior length (aSI) of the
articular surface of the right patella.
Figure 5d: Measurement of the mediolateral length (aML) of the
34 5.6.2: Articular Mediolateral length (aML): This dimension was
defined as the maximum horizontal length between the margins of
the articular surface on the posterior surface of the patella (Figure
5d).
5.7: Analysis
All the data was entered into Excel workbook sheets (Microsoft
Office Excel; version 2007, Microsoft ® Corporation, US.) and
analysed using SPSS (version 17.0; SPSS Inc., Chicago, IL).
The data was analysed as follows.
The dimensions were summarized as the mean and standard
deviation and compared using paired t-test.
5.7.1: Aspect Ratio (AR): The aspect ratio (which is calculated as
the mediolateral dimension divided by the anteroposterior
dimension) was noted using various dimensions of the femur and
the tibia.
For Femur:
AR 1= ML/ APMC
AR 2= ML/ APAVG, [APAVG = average of the anteroposterior
35 For Tibia:
AR 1= ML/ APMC
AR 2= ML/ MAP
AR 3= ML/ APAVG, [APAVG = average of the anteroposterior
distance of medial (APMC) and lateral (APLC) condyle]
The ANOVA (analysis of variance) was applied to find out the
statistical difference between the means of different types of Aspect
ratios.
5.7.2: Reliability (Data reliability): The Interclass Correlation (ICC)
test was used for assessing Rater Reliability.
5.7.3: Correlation:
Bivariate correlation was done between various sets of variables
and the Pearson’s correlation coefficient obtained was interpreted to
identify positive linear, low positive, negative or no correlation. A
Pearson’s coefficient close to +1 is said to have high positive
correlation between the variables. A Pearson’s coefficient close to -1
is said to have strong negative correlation between the variables.
Other values of the coefficient can be interpreted as a gradient
between +1 to 0 to -1. All values of the Pearson’s coefficient should
be accompanied with a statistically significant p value (p value of <
36
Scatter plots with best-fit lines were calculated with the use of
least-squares regression to graphically visualize the correlation
between two variables; where the slope of the graph is (r)2, where “r”
is the Pearson’s correlation coefficient.
In a scenario if variables are said to have a high positive
correlation, then linear regression between them can be calculated
to arrive at a regression equation which helps to determine the
dependent variable from the independent variable as below:
Independent variable = ‘B constant’ + factor x dependent variable.
Linear Regression was done for variables which were independent
of each other (i.e.: not derived from each other) and were not
belonging to a mixed sample.
A Student’s t test for equality of means was performed to determine
if the morphological measurements were statistically different
between sexes (in cadaveric data) and two sides of unpaired bones.
All statistical tests were two-tailed and a p value of < 0.05 was
taken as significant.
The ‘Aspect Ratio’ was compared with data from other studies
involving different racial groups and also with prosthetic systems
(Depuy, Altius) currently used by the Department of Orthopedics,
37
5.8: Conflict of interest
There were no benefits or funds received from companies in support
of the study and no personal relationships with organizations that
38
6. RESULTS
6.1: RESULTS OF THE BONE MORPHOMETRIC MEASUREMENTS
(FEMUR)
Morphometric measurements were done for 177 unpaired femurs in
dry bones; out of which 92 were right sided and 85 were left sided.
The mean aspect ratio of the femurs was found to be 1.29 (± 0.1).
The measurements of the femurs are summarized in Table 1.
Morphomet ric Measureme
nt
Mean
(mm) Median
(mm) Standa rd Deviati on Range Minimu
m (mm) Maximum
(mm)
Length 436.
83
435. 0
27.161 378 500
APMC 58.1
5
58.2 3.64 50.7 68.5
APLC 57.5
8
57.6 3.34 50.8 70.0
ML 74.9
6
75.2 4.08 65.3 84.1
Aspect Ratio (ML/
APMC)
1.29 1.29 0.05 1.12 1.44
APMC- Anteroposterior length of medial condyle; APLC- anteroposterior length of lateral condyle; ML- Mediolateral length at transepicondylar axis
39
6.1.1: Comparison of Right and Left femoral dimension
On comparison of the right and left femurs in dry bones it was
found that the mean APMC and Aspect ratio were significantly
different between right and left femurs. The mean APMC of the right
side was 57.56 and that of the left side was 58.78, the difference of
the APMC was 1.22 mm (left more than right, p value 0.02). The
mean Aspect ratio of the right side was 1.30 and that of the left side
was 1.28, (right more than left, p value 0.02). There was no
statistical difference between means of Length, APLC or ML; results
as shown in Table 2.
Morphometric Measurement Right femur Mean (mm) Left femur Mean (mm) Standard Error of difference between means
p value
Length 433.07 441.30 6.1 0.20
APMC 57.56 58.78 0.54 0.02
APLC 57.75 57.39 0.50 0.48
ML 74.76 75.18 0.61 0.5
Aspect Ratio 1.30 1.28 0.00 0.02
40
TABLE 2: Comparison of means of femoral dimensions between sides
6.1.2: Difference in methods of calculating Aspect ratio of femur
In this study the Aspect ratio of femur was calculated in two ways.
The first method (Aspect ratio 1) was calculated as the ratio of ML
and APMC and the second method (Aspect ratio 2) being the ratio of
ML and the average of APMC and APLC (APAVG). The means of
both Aspect ratio 1 and Aspect ratio 2 was 1.29. There was
significant positive correlation (Pearson’s r value = 0.90, p value
0.00) between Aspect ratio 1 and Aspect ratio 2 as shown in Figure
6.
6.1.3: Correlation between femur dimensions
Correlation analysis was done between various femoral dimensions
measured for 177 femurs. There was positive correlation between
APMC and the ML dimensions of the femur, i.e. as the
anteroposterior dimensions of the distal femur increased there was
a linear proportionate increase in the mediolateral width. The
Aspect ratio 1 correlated moderately with APMC (negative
correlation). However ML and APAVG did not show any correlation
41
Figure 6: Correlation between Aspect Ratio 1 and Aspect ratio 2 (N =
177), showing a linear positive correlation. Pearson’s r value = 0.90
S.No. X- Axis Y- Axis Pearson’s r value p value
1 APMC ML 0.70 0.00
2 APMC AR 1 -0.52 0.00
3 ML AR 1 0.23 0.02
4 APAVG AR 1 -0.42 0.00
APMC- Anteroposterior length of medial condyle; APAVG- Average of Anteroposterior length of medial and lateral condyle; ML- Mediolateral length at transepicondylar axis; AR 1- Aspect ratio 1(ML/APMC)
42 The correlation scatter plots for the dimensions in Table 3 are
shown in Figures 7, 8, 9 and 10.
6.1.4: Correlation between femoral length and other femoral
dimensions
The length of the femur was found to have low to moderate
correlation with APMC (Pearson’s r = 0.61) and ML (Pearson’s r =
0.58) and no correlation with Aspect ratio 1 (Table 4), proving the
incapability of predicting APMC, ML or Aspect ratio using the length
of the femur.
S.No. X- Axis Y-
Axis
Pearson’s r value
p value
1 Length of
femur
APMC 0.61 0.00
2 Length of
femur
ML 0.58 0.00
3 Length of
femur
AR 1 -0.026 0.82
APMC- Anteroposterior length of medial condyle; ML- Mediolateral length at transepicondylar axis; AR 1- Aspect ratio 1(ML/APMC)
43
Figure 7: Correlation between APMC and ML of femur (N = 177) showing a linear positive correlation. Pearson’s r = 0.70.
44
Figure 9: Correlation between ML and Aspect ratio 1 of femur (N = 177) showing low correlation. Pearson’s r = 0.23.
[image:46.595.124.470.74.344.2] [image:46.595.124.469.423.695.2]45 The correlation scatter plots between Length of femur and other
femoral dimensions are shown in Figures 11, 12 and 13.
6.1.5: Regression analysis in femur
As can be gathered from the scatter plot (Figure 7) the best
parameter to predict the mediolateral width of distal femur is APMC
since, the relationship between APMC and ML appears to be
straight (positive linear correlation, r= 0.70, p value 0.00) and there
is no evidence of a mixed sample. The variables are independent
and no obvious outliers are visible. Therefore for the 177 femurs
using APMC as independent variable and ML as the dependent
variable, the linear regression equation thus obtained is:
For example: For given APMC = 53.0 mm using the regression
equation,
ML = 29.11 + 0.78 (53.0)
ML = 70.45 mm
Linear regression analysis could not be done for other variables
since they were not independent of each other, though they were
not belonging to a mixed sample and showed correlation.
46
[image:48.595.138.472.74.345.2]Figure 11: Correlation between Length of femur and APMC of femur (N = 81) showing moderate correlation. Pearson’s r = 0.61.
[image:48.595.135.476.414.683.2]47
48
6.2 RESULTS OF THE BONE MORPHOMETRIC MEASUREMENTS
(TIBIA)
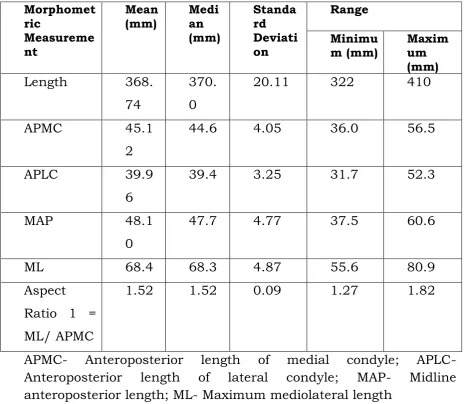
Morphometric measurements were done for 161 unpaired adult
tibias (dry bones); out of which 84 were right sided and 77 were left
sided. The mean aspect ratio of the tibia bones was found to be
[image:50.595.66.532.284.688.2]1.15 (± 0.56). The measurements of the tibias are summarized in
Table 5. Morphomet ric Measureme nt Mean
(mm) Median
(mm) Standa rd Deviati on Range Minimu
m (mm) Maximum
(mm)
Length 368.
74
370. 0
20.11 322 410
APMC 45.1
2
44.6 4.05 36.0 56.5
APLC 39.9
6
39.4 3.25 31.7 52.3
MAP 48.1
0
47.7 4.77 37.5 60.6
ML 68.4 68.3 4.87 55.6 80.9
Aspect Ratio 1 = ML/ APMC
1.52 1.52 0.09 1.27 1.82
APMC- Anteroposterior length of medial condyle; APLC- Anteroposterior length of lateral condyle; MAP- Midline anteroposterior length; ML- Maximum mediolateral length
49
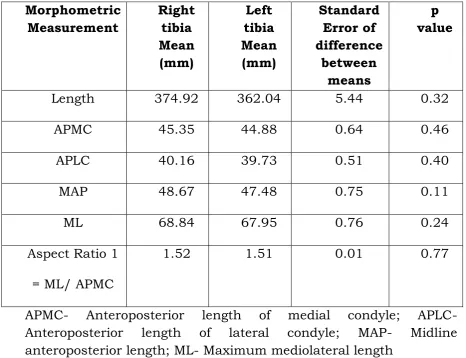
6.2.1: Comparison of Right and Left tibial dimension
On comparison of the right and left tibias in dry bones it was found
that there was no significantly difference between the means of any
dimension as shown in Table 6.
Morphometric Measurement Right tibia Mean (mm) Left tibia Mean (mm) Standard Error of difference between means p value
Length 374.92 362.04 5.44 0.32
APMC 45.35 44.88 0.64 0.46
APLC 40.16 39.73 0.51 0.40
MAP 48.67 47.48 0.75 0.11
ML 68.84 67.95 0.76 0.24
Aspect Ratio 1
= ML/ APMC
1.52 1.51 0.01 0.77
[image:51.595.65.532.284.642.2]APMC- Anteroposterior length of medial condyle; APLC- Anteroposterior length of lateral condyle; MAP- Midline anteroposterior length; ML- Maximum mediolateral length
50
6.2.2: Difference in methods of calculating Aspect ratio of tibia
In this study the Aspect ratio of tibia was calculated in three ways.
The first method (Aspect ratio 1) was calculated as the ratio of ML
and APMC, the second method (Aspect ratio 2) was calculated as
the ratio of ML and the midline anteroposterior length (MAP) and
the third being the ratio of ML and the average of APMC, APLC
and MAP (APAVG). However with the application of the ANOVA test;
this study shows that there is no statistically significant difference
between the means of Aspect Ratio 1, 2 or 3 as shown in Table 7.
Aspect Ratio Mean F statistic
(between groups)
p value
Aspect ratio 1 1.52 0.084 0.77
Aspect ratio 2 1.42 0.843 0.36
Aspect ratio 3 1.54 0.015 0.90
Aspect ratio 1 = ML/ APMC, Aspect ratio 2 = ML/ MAP, Aspect ratio 3 = ML/ Average of APMC, APLC and MAP
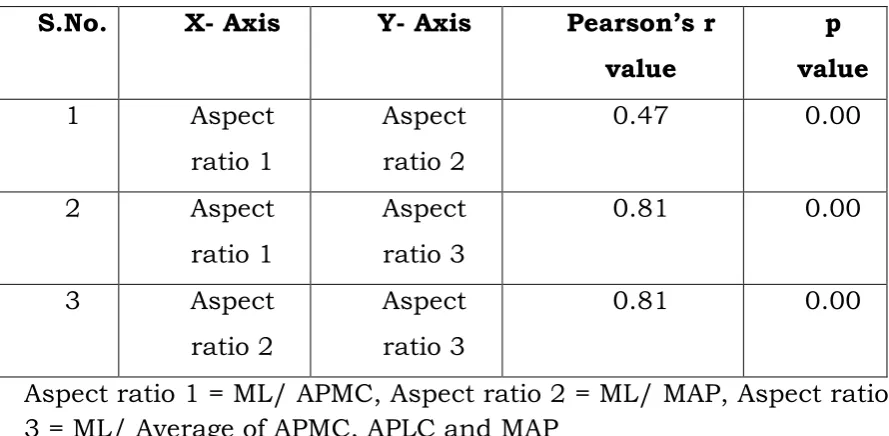
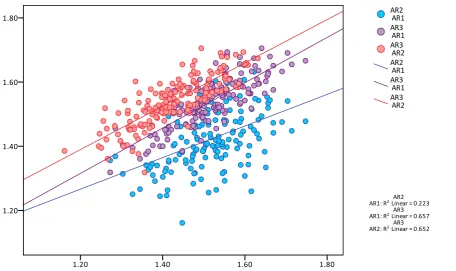
51 The correlation scatter overlay plot between the Aspect ratios for
tibia was computed (Figure 14) and found that there is significant
correlation between them as shown in Table 8.
S.No. X- Axis Y- Axis Pearson’s r value
p value
1 Aspect
ratio 1
Aspect ratio 2
0.47 0.00
2 Aspect
ratio 1
Aspect ratio 3
0.81 0.00
3 Aspect
ratio 2
Aspect ratio 3
0.81 0.00
[image:53.595.78.523.191.409.2]Aspect ratio 1 = ML/ APMC, Aspect ratio 2 = ML/ MAP, Aspect ratio 3 = ML/ Average of APMC, APLC and MAP
Table 8: Correlation of Aspect ratios of tibial dimensions
Since there is no significant difference between the aspect ratios 1,
2, 3 (p value 0.00); Aspect ratio 1 has been used for further analysis
of tibia.
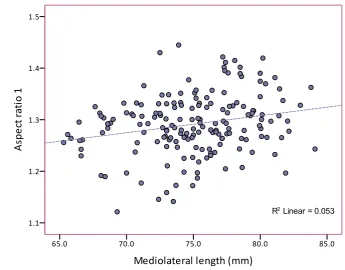
6.2.3: Correlation between other tibial dimensions
For the 161 tibias in this study correlation analysis was done
between the various dimensions (Table 9). There was positive
correlation between APMC and ML (Pearson’s r = 0.753, p value
52
53 i.e. as the anteroposterior length (of the medial condyle and the
midline AP) of the proximal tibia increased, there was a
proportionate increase in the mediolateral width linearly as shown
in Figures 15, 16. There was however no correlation between the
other dimensions (Figures 17, 18 and 19).
S.No. X- Axis Y- Axis Pearson’s r value p value
1 APMC ML 0.753 0.00
2 MAP ML 0.754 0.00
3 APMC AR 1 -0.57 0.00
4 ML AR 1 0.10 0.19
5 MAP AR 1 -0.23 0.00
APMC- Anteroposterior length of medial condyle; APLC- Anteroposterior length of lateral condyle; MAP- Midline anteroposterior length; ML- Maximum mediolateral length; Aspect ratio 1 = ML/ APMC
Table 9: Correlation between various tibial dimensions
The other variables show no correlation between them as shown in
54
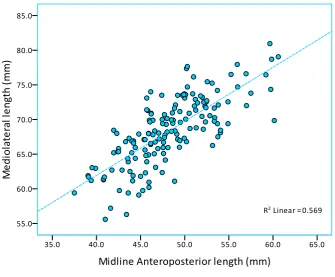
Figure 15: Correlation between APMC and ML of tibia (N = 161) showing strong positive correlation between APMC and ML of the proximal tibia. Pearson’s r = 0.75.
[image:56.595.126.468.74.336.2] [image:56.595.135.471.430.707.2]55
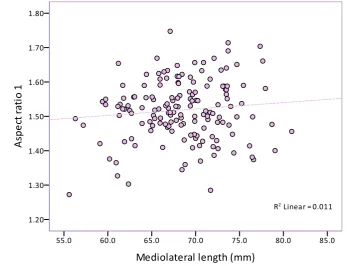
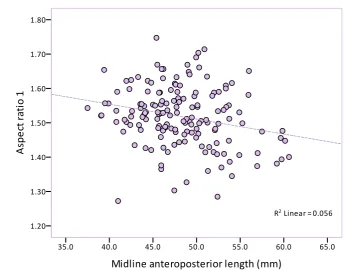
Figure 17: Correlation between APMC and Aspect ratio 1 of tibia (N = 161), showing negative correlation. Pearson’s r = -0.57.
[image:57.595.124.475.413.679.2]56
[image:58.595.123.468.208.479.2]57
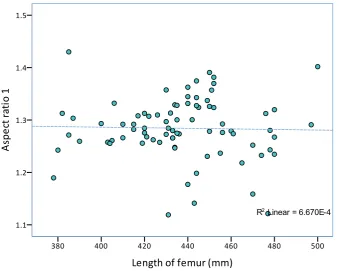
6.2.4: Correlation between tibial length and other tibial dimensions
The length of the tibia was found to have statistically significant
correlation with APMC (Pearson’s r = 0.59, p value 0.00), MAP
(Pearson’s r = 0.66, p value 0.00) and ML (Pearson’s r = 0.68, p
value 0.00). There was no correlation between length of tibia and
Aspect ratio 1 (p value 0.64), as shown in Table 10. The length of
the tibia can therefore be used as a good predictor of APMC, MAP
and ML dimensions of the tibia (p value 0.00).
S.No. X- Axis Y- Axis Pearson’s r
value
p value
1 Length of
tibia
APMC 0.59 0.00
2 Length of
tibia
MAP 0.66 0.00
3 Length of
tibia
ML 0.68 0.00
4 Length of
tibia
Aspect ratio 1
-0.06 0.64
APMC- Anteroposterior length of medial condyle; MAP- Midline anteroposterior length; ML- Mediolateral length at transepicondylar axis; AR 1- Aspect ratio 1(ML/APMC)
Table 10: Correlation of Length of tibia with other femoral dimensions
The correlation scatter plots between Length of tibia and other tibial
58
Figure 20: Correlation between Length of tibia and APMC (N = 50), showing moderate correlation. Pearson’s r = 0.59
[image:60.595.127.468.74.342.2] [image:60.595.127.478.415.678.2]59
[image:61.595.124.468.72.345.2]Figure 22: Correlation between Length of tibia and ML (N = 50), showing moderate correlation Pearson’s r = 0.68
[image:61.595.132.471.411.688.2]60
6.2.5: Regression analysis in tibia
As shown in Table 9 and 10, there is a good correlation between
APMC and ML, MAP and ML, Length of tibia and APMC, Length of
tibia and ML. Linear regression analysis was done for the above
variables (Table 11) which showed a positive linear correlation,
which were independent of each other and were not belonging to a
mixed sample (scatter plots Figures 15, 16, 20 and 22).
Independent variable
Dependent variable
Regression equation
APMC ML ML = 26.82 + 0.92
(APMC)
MAP ML ML = 30.71 + 0.78
(MAP)
Length of tibia APMC APMC = 4.04 + 0.1
(Length)
Length of tibia ML ML = 6.37 + 0.16
(Length)
[image:62.595.68.530.338.584.2]APMC- Anteroposterior length of medial condyle; MAP- Midline anteroposterior length; ML- Maximum mediolateral length
61 For example:
I) For given APMC = 50.85 mm; using the regression equation,
ML = 26.82 + 0.92 (50.85)
ML = 73.60 mm
II) For given MAP = 48.0 mm; using the regression equation,
ML = 30.71 + 0.78 (48.0)
62
6.3: Results of Cadaveric measurements
Dissection of the knee joint was performed on 14 cadavers, of which
8 were female and 6 were male. The distal femur, proximal tibia
and patella were exposed after carefully dissecting out the
surrounding soft tissue. None of the cadaver knees revealed any
evidence of gross pathology, previous surgical procedures or
traumatic lesions.
6.3.1: Morphometric measurements of distal femur in cadavers
6.3.1.1: Comparison of right and left dimension
The means of all the measured parameters was compared between
the two sides (right and left) using the paired t test for the
comparison of means and results are as shown in Table 12. It was
found that there was no significant difference between the two sides
in any of the morphometric dimensions measured.
This is consistent with the findings in the dry bones measurement
given in section 6.1.1. The measurements of both the sides also
showed very strong correlation (with Pearson’s coefficient ‘r’ value
63
Pair Dimension Mean p
value for paired t test
Pearson’s
r value Correlation p value
1 RAPMC 59.2 0.24 0.97 0.00
LAPMC 58.8
2 RAPLC 59.9 0.45 0.88 0.00
LAPLC 59.5
3 RML 75.2 0.90 0.88 0.00
LML 75.2
4 RWMC 26.6 0.90 0.51 0.57
LWMC 26.7
5 RWLC 28.4 0.97 0.63 0.01
LWLC 28.5
6 RHMC 35.1 0.89 0.89 0.00
LHMC 35.2
7 RHLC 34.5 0.62 0.81 0.00
LHLC 34.2
8 RDIC 25.7 0.16 0.34 0.22
LDIC 23.7
9 RWIC 19.3 0.07 0.82 0.00
LWIC 18.6
APMC - Anteroposterior length of medial condyle; APLC-
Anteroposterior length of lateral condyle ML- Mediolateral length at transepicondylar axis; WMC– Width of medial condyle; WLC- Width of lateral condyle; HMC– Height of medial condyle; HLC- Height of lateral condyle; DIC- Depth of Intercondylar notch; WIC- Width of Intercondylar notch.
[image:65.595.64.532.70.611.2]64
Pair Dimension Mean p
value for paired t test
Pearson’s
r value Correlation p value
1 RA 35.5 0.88 0.73 0.00
LA 35.6
2 RB 56.1 0.35 0.84 0.00
LB 55.5
3 RCM 22.9 0.69 0.81 0.00
LCM 23.1
4 RCL 24.6 0.08 0.90 0.00
LCL 24.1
5 RX 12.3 0.41 0.62 0.01
LX 11.7
6 RY 30.4 0.88 0.86 0.00
LY 30.3
7 RLM 113.8 0.47 0.89 0.00
LLM 114.7
8 RLL 116.0 0.75 0.91 0.00
LLL 116.3
A - First horizontal dimension on anterior articular surface; B - Second horizontal dimension on anterior articular surface; CM - Width of the articular surface of medial condyle along the transepicondylar plane; CL - Width of the articular surface of lateral condyle along the transepicondylar plane X - Patellar extension of articular surface on the lateral condyle; Y - Anteroposterior extent of anterior femoral articular surface; LM - Length of medial condyle; LL – Length of the lateral condyle; AR- Aspect ratio (ML/APMC).
Table 12b: Comparison of morphometric data of right and left
distal femur in cadaveric specimens (articular surface
65
6.3.1.2: Gender-wise comparison of distal femoral dimension
In prosthesis design of distal femur, in order to closely replicate
normal anatomy and functionality the dimensions that play critical
role are AP and ML. Therefore in order to assess the need for a
gender specific prosthesis one needs to consider the differences in
these measurements in the two genders. In this study the APLC
and ML measurements were significantly more in males than in
females (difference of APLC: 4.1mm , p value 0.03 , difference of ML:
4.4mm, p value 0.02). The gender differences among other
measurements of the distal femur are as seen in Table 13 which
were compared by using the independent t test for comparison of
means.
Femoral
dimension Gender Mean (mm) SD Significance p value of
difference between
means
Length Male 1563.3 121.76 0.41
Female 1523.1 53.91
APMC Male 61.2 5.88 0.11
Female 57.3 2.68
APLC Male 62.0 4.54 0.03
Female 57.9 1.87
66
Female 73.3 2.08
WMC Male 27.0 2.10 0.71
Female 26.4 2.95
WLC Male 29.1 3.05 0.41
Female 27.9 2.31
HMC Male 36.9 4.30 0.12
Female 33.8 2.54
HLC Male 36.4 3.70 0.02
Female 32.8 1.51
DIC Male 25.4 3.94 0.58
Female 24.3 3.53
WIC Male 19.0 2.14 0.94
Female 18.9 2.27
APMC - Anteroposterior length of medial condyle; APLC- Anteroposterior length of lateral condyle ML- Mediolateral length at transepicondylar axis; WMC– Width of medial condyle; WLC- Width of lateral condyle; HMC– Height of medial condyle; HLC- Height of lateral condyle; DIC- Depth of Intercondylar notch; WIC- Width of Intercondylar notch.
Table 13: Gender differences between various femoral condylar measurements
6.3.1.3: Correlation between APMC and ML in cadaveric distal
femur
As shown in Figure 24, in the cadaveric measurements of distal
femur, it was found that there were strong correlations between
[image:68.595.81.520.68.497.2]67 analysis done derived an equation (as below) with ML as the
dependent and APMC as the independent variable.
This is similar to the findings in the dry bone measurements where
the regression equation was: ML = 29.11 + 0.78 (APMC). Therefore,
there exists a linear relationship between APMC and ML of distal
femurs in Indian population.
Figure 24: Correlation between APMC and ML of cadaveric distal femur
[image:69.595.131.478.348.620.2]68
6.3.1.4: Correlation between various cadaveric femoral dimensions
(Gender wise)
As seen in the scatter plot in Figure 25, the female knees included
in this study had smaller Mediolateral dimension for given
Anteroposterior length of medial condyle.
Figure 25: Gender wise correlation between APMC and ML in cadaveric knees, showing positive correlation in both sexes. Pearson’s r (male) = 0.91, Pearson’s r (female) = 0.95.
On applying linear regression, the following regression equations
were obtained for both sexes.
Regression equation in Male knees: ML = 36.44 + 0.67(APMC)
[image:70.595.123.483.259.530.2]69
6.3.1.5: Gender wise results of the articular surface measurements
of the distal femur
The gender differences among articular surface measurements of
the distal femur are seen in Table 14, which were compared using
the independent t test for comparison of means. There was a
statistically significant difference observed between sexes in the
dimensions of: B - Second horizontal dimension on anterior
articular surface; Y - Anteroposterior extent of anterior femoral
articular surface and LL - Length of medial and lateral condyle.
Femoral
dimension Gender Mean (mm) SD Significance of difference
between means p value
A Male 35.9 2.88 0.67
Female 35.2 2.87
B Male 57.8 4.60 0.07
Female 54.3 2.07
CM Male 23.6 2.05 0.37
Female 22.5 2.29
CL Male 25.2 2.49 0.22
Female 23.7 1.96
X Male 13.2 2.01 0.16
Female 11.2 2.75
70
Female 29.0 2.39
LM Male 119.2 8.62 0.06
Female 110.5 7.52
LL Male 123.1 8.39 0.00
Female 111.0 4.22
AR Male 1.27 0.06 0.77
Female 1.28 0.03
A - First horizontal dimension on anterior articular surface; B - Second horizontal dimension on anterior articular surface; CM - Width of the articular surface of medial condyle along the transepicondylar plane; CL - Width of the articular surface of lateral condyle along the transepicondylar plane X - Patellar extension of articular surface on the lateral condyle; Y - Anteroposterior extent of anterior femoral articular surface; LM - Length of medial condyle; LL – Length of the lateral condyle; AR- Aspect ratio (ML/APMC).
Table 14: Gender differences between various femoral articular surface measurements
6.3.2: Morphometric measurements of proximal tibia in cadavers
6.3.2.1: Comparison of right and left tibial dimensions
The means of all the measured parameters of proximal tibia were
compared between the two sides (right and left) using the paired t
test for the comparison of means and results are as shown in Table
15. It was found that there was no significant difference between
71 the proximal tibia. This is consistent with the findings in the dry
bones measurement given in Table 6, section 6.2.1.
The measurements of both the sides also showed good correlation
(with Pearson’s coefficient ‘r’ value high and close to 1).
Pair Dimension Mean p
value for paired
t test
Pearson’s
r value Correlation p value
1 RAPMC 46.5 0.69 0.78 0.00
LAPMC 46.2
2 RAPLC 42.3 0.53 0.76 0.00
LAPLC 42.0
3 RMAP 44.9 0.55 0.70 0.00
LMAP 45.3
4 RML 69.0 0.75 0.93 0.00
LML 68.8
APMC - Anteroposterior length of medial condyle; APLC- Anteroposterior length of lateral condyle; MAP – Midline anteroposterior length; ML-Maximum Mediolateral length.
[image:73.595.66.531.224.537.2]72
6.3.2.2: Gender-wise comparison of proximal tibial dimension
The gender differences among other measurements of the
proximal tibia are as seen in Table 16 which were compared by
using the independent t test for comparison of means. This showed
that there was statistically significant difference in APMC
(difference of 3.01 mm; males more than females) and APLC
(difference of 2.72 mm; males more than females).
Tibial
dimension Gender Mean (mm) SD Significance of difference between means p value
APMC Male 48.01 2.32 0.08
Female 45.0 3.19
APLC Male 43.62 2.40 0.02
Female 40.90 1.47
MAP Male 45.79 3.90 0.46
Female 44.56 1.57
ML Male 70.7 5.07 0.17
Female 67.4 3.15
APMC - Anteroposterior length of medial condyle; APLC- Anteroposterior length of lateral condyle; MAP – Midline anteroposterior length; ML-Maximum Mediolateral length.
[image:74.595.91.506.329.616.2]73
6.3.2.3: Gender wise results of the articular surface measurements of the proximal tibia
On comparison of gender differences between tibial articular
surface measurements there was no difference observed (Table 17).
Therefore, articular surface measurements of the proximal tibia are
not critical in determining the implant size.
Tibial
dimension Gender Mean (mm) SD Significance of difference
between means p value
K Male 30.8 2.34 0.39
Female 40.7 3.94
L Male 30.9 2.64 0.79
Female 30.7 2.38
M Male 37.9 2.45 0.87
Female 37.8 2.52
N Male 44.9 2.74 0.32
Female 44.4 2.40
74
Table 17: Gender differences between various Tibial articular surface measurements
6.3.2.4: Correlation between APMC and midline AP (MAP) with ML
in cadaveric proximal tibia
In the cadaveric measurements of proximal tibia, it was found
that there were strong correlations between APMC and ML
(Pearson’s r = 0.67, p value 0.00) and between MAP and ML
(Pearson’s r = 0.76, p value 0.00) as shown in figures 26 and 27.
The regression analysis done derived an equation (as below)
with ML as the dependent and APMC and MAP as the independent
variable.
This is similar to the findings in the dry bone measurements
where the regression equation was: ML = 26.82 + 0.92 (APMC).
Therefore, there exists a linear relationship between APMC and ML
of proximal tibias in Indian population.
Regression equation: ML = 25.76 + 0.93(APMC)
75
Figure 26: Correlation between APMC and ML of cadaveric proximal tibia, showing positive correlation. Pearson’s r = 0.67.
[image:77.595.135.473.75.349.2] [image:77.595.136.474.414.685.2]76
6.3.2.5: Gender-wise correlation between APMC and ML in
proximal tibias.
The APMC and ML of the proximal tibia in males showed strong
correlation (Pearson’s r = 0.82), whereas in females the ML
dimension was smaller for a given APMC dimension.
Figure 28: Gender-wise correlation between APMC and ML in proximal tibias, showing positive correlation in both sexes. Pearson’s r (male) = 0.82, Pearson’s r (female) = 0.47.
Linear regression analysis was done for the APMC and ML
variables which showed a positive linear correlation, which were
independent of each other and were not belonging to a mixed
[image:78.595.131.487.228.514.2]77
7. DISCUSSION
This research was aimed to study the morphometry of normal
adult knees in the Indian population in order to assess the need for
a knee arthroplasty system specific to the Indian population by
measuring the various dimensions of the distal femur, proximal
tibia and patella in cadavers and dry bones, and comparing the
findings with current arthroplasty systems in India and other racial
groups around the world.
Morphometric measurements in general have been used in
research for; identifying and characterizing structural differences
among populations, racial groups and between sexes. In knee
arthroplasty related studies, morphometric measurements of the
knee joint have been done to describe racial and gender differences
and also to understand prosthesis designs.
Knee arthroplasty, is the surgical procedure that replaces the
knee joint surfaces, to alleviate the pain and disability caused by
osteoarthritis which cannot be managed by conservative
treatment(17). Total knee arthroplasty (TKA) is a precision surgery,
requiring accurate soft tissue balancing and resection of bone
thickness equal to the thickness of the prostheses implanted, so
that flexion - extension spacing are equal, allowing joint stability
78 to a large extent on prostheses selection, accurate sizing and proper
placement of the components (20,21).
The femoral component
In the sizing of the femoral component, the anteroposterior
diameter of medial condyle (APMC) is important in maintaining
flexion - extension spacing and optimal tension in the quadriceps
mechanism (21), whereas the mediolateral diameter (ML)
determines adequate coverage of the resected bone surface,
allowing even stress distribution, tension-free wound closure, and
smooth tracking of the patellar component in the trochlear groove
during flexion (22,23). Accurate sizing of the femoral component is
essential in the anteroposterior dimension and the permissible
error in component selection should not exceed 3 to 4 mm(22).
Oversizing in the anteroposterior dimension alters the balance in
flexion-extension spacing, resulting in postoperative flexion
tightness because of increased tension in the quadriceps
mechanism(21,24).
Comparing the right and left sides of distal femur
In this study, in the comparison of right and left femurs in dry
bones it was found that amongst most parameters there was no
79 APMC which showed a statistically significant difference between
the mean of right (57.56) and left (58.78) side, but this difference of
1.22 mm may not be clinically significant. This difference was not
observed in the measurements of the cadavers. Other studies
within each racial group also showed no statistical difference
between right and left sides for distal end of femur (7–9,16,25,26).
This therefore proves the assumption in common practice that,
there are no significant differences on anatomical and functional
comparison of parameters from one side to the other (although
symmetry is unknown) (27).
Compari