A STUDY ON THE VALIDATION OF
PAEDIATRIC INDEX OF MORTALITY 2 (PIM2)
SCORE IN THE PAEDIATRIC INTENSIVE CARE
UNIT OF CMC, VELLORE
A dissertation submitted to the TN. Dr. MGR medical
University, Tamil Nadu, in partial fulfillment of the rules and
regulations for the M.D. branch VII (PAEDIATRICS)
CERTIFICATE
This is to certify that this dissertation entitled
“
A STUDY ON THE VALIDATION OF PAEDIATRIC INDEX OF
MORTALITY 2 (PIM2) SCORE IN THE PAEDIATRIC INTENSIVE
CARE UNIT OF CMC, VELLORE
”
is a bonafide work done by
Dr.Muthulakshmi.N
.
in partial fulfillment of the rules and regulations for the
M.D. Branch VII (PAEDIATRICS) examination of the
Tamilnadu, Dr. M.G.R. Medical University, Chennai, to be held in
March 2008.
PLACE: DATED:
Dr. KALA EBENEZER M.D., D.C.H
Professor,
Division of Paediatric Intensive Care,
Department of Child Health,
Christian Medical College,
Vellore. Tamil Nadu
Dr. ATANU KUMAR JANA M.D., D.C.H
Professor and Head,
Declaration
I hereby declare that the investigations that form the subject matter of my thesis was carried out by me under the guidance of Dr. Kala Ebenezer M.D., D.C.H, Professor, Division of Paediatric Intensive Care, Department of Child Health, Christian Medical College,Vellore. This has not been submitted in any other university in part or in full.
Dr.Muthulakshmi.N
Department of Child Health
Christian Medical College
Vellore.
ACKNOWLEDGEMENTS
I wish to express my deep gratitude to Dr. Kala Ebenezer, M.D., D.C.H., Professor and Head of the Paediatric Intensive Care Unit, and Professor, Department of Child Health, Christian Medical College, Vellore, for her valuable guidance and constant encouragement throughout the course of the study.
I am thankful to Dr. Atanu Kumar Jana, M.D., D.C.H., Professor and head of the Department of Child Health, for his interest and help in the successful completion of the study.
I am extremely thankful to all patients, my colleagues and staff of the Paediatric Intensive Care Unit for the cooperation they extended during the course of the study.
CONTENTS
1. Title
2. Introduction
3. Aims and objectives of the study
4. Review of literature
5.
Materials and methods
6. Analysis of results
7. Discussion
8. Conclusion
9. Bibliography
AIMS AND OBJECTIVES
•
To validate the Paediatric Index of Mortality 2 (PIM 2) score in the
paediatric intensive care unit of CMC, Vellore
•
To compare the performance of our PICU with the other intensive
Introduction
Paediatric intensive care is a rapidly developing super specialty especially in the later half of the 20th century. While these developments happened much later in
developing countries, over the past 10 years there has been a tremendous growth in Paediatric intensive care in India.
Paediatric Intensive Care Units (PICU) constantly aim at promoting care to critically ill children which often involves huge amounts of technology that comes at exorbitant cost, often unreachable to many families. Even though the underlying condition is potentially treatable, the outcome is often uncertain.
The question of how best to utilize critical care resources is one that challenges intensive care unit (ICU) directors on a daily basis. Shortages in space, human and economic resources especially in developing countries limit the ability to provide complete care. As costs of health care in ICU have gone up dramatically, correctly identifying those children who are salvageable from moribund group of children becomes necessary for implementation of effective and rational medical therapy.
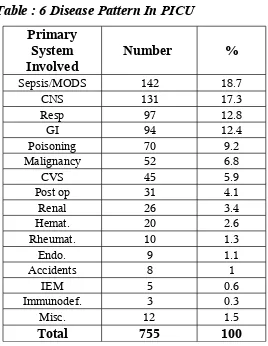
Infectious diseases, respiratory and sepsis syndromes comprise the majority of admissions followed by neurological illness. Majority of the patient population are infants. The overall mortality is about 20-25% which is high compared to figures from intensive care units abroad. This finding is probably related to the patient profile as well as a greater load of sicker patients being managed with scarce resources.
This has compelled us to do an outcome analysis by predictive scoring system so that accurate outcome data is available for guidance of prognostication and counseling the parents.
Literature review had shown that there are two important scores that are available for use in Paediatric intensive care units. The Paediatric Risk of Mortality score (PRISM) published in 1988 by Pollack et al. is still the most widely known and used prognostic score for evaluation of disease severity in children. In 1997 Shann et al developed and validated the Paediatric Index of Mortality score (PIM SCORE) which was simpler to collect as it had less variables than PRISM and performed well as compared to PRISM. The same authors published a revised score in 2003- PIM-2 which was better calibrated, safer and better adjusted for diagnostic groups than its original version.
The PIM Score which was originally developed in Australian PICUs, has been tested and found to have good discriminatory capacity in intensive care units in the U.K and by the same group of authors. Other studies from Hong Kong, Argentina and Italy have also shown comparable results. Limited Indian data is available in the literature. The only study from India compared the performance of Pediatric Risk of Mortality (PRISM), Pediatric Index of mortality (PIM) and PIM2 in 246 children admitted to a 6 bedded PICU in New Delhi. The area under the receiver operating characteristic curve for all models was >0.8. However all scores under predicted mortality.
Moreover, nutritional status of the children will be very different and will be a major compounding factor that might influence the outcome.
We were interested in determining if the PIM score is applicable for our intensive care unit with its patients as described. PIM data is easy to collect and is available on the internet free of cost. It is done at time of admission and is independent of the intensive care delivered to the patients. Hence this study of validating the PIM-2 score in the PICU of Christian Medical College & Hospital was undertaken.
Literature Review
The provision of intensive care to infants, children, and adultsincreased steadily during the latter half of the 20th century, with particular, rapid expansion during the 1970s and 1980s. In paediatric intensive care, the growth in activity has followed somewhat later.
The main goals for intensive care can be simplified to save the lives of the salvageable patients with reversible medical conditions and offer the dying patient a peaceful and dignified death. Correctly identifying these two groups of patients is necessary for implementation of effective and rational medical therapy. The escalation in health care costs over the past 25 years has paralleled the development of specialized intensive care units and the recognition of critical care medicine as a separate medical specialty. ICU beds make up about 5% -10% of the total hospital beds. In developed countries such as the United States of America the total health care costs equal approximately 11-12% of GNP with the total critical care costs representing about 1% of the GNP1. Similar data in the developing world is forthcoming.
Thus outcome analysis by predictive scoring systems has become a growing field of interest in clinical research conducted in critical care medicine. Two important reasons for this are the rising cost of health care and the need for accurate outcome data so that patients, their families, and physicians can make informed health care decisions.
Utilization of the intensive care unit
Rationing of ICU facilities
Rationing of all types can occur in ICU setting – rationing of equipment, staffing, medications especially as ICU is the site of application of most advanced technologies. Admission to ICU often serves as a signal to proceed with a continuous series of interventions – a process that can be difficult to limit or stop.
Decisions about which patients should be admitted and which patients should be rejected may consume relatively large amounts of time; in fact, decisions about how to manage a patient after admission to the ICU often are less labored than the discussions about whether or not to admit the patient to ICU.
The imbalance between the supply and the demand for ICU beds and the resulting rationing that must occur justify the need to develop formal guidelines for ICU admission and allocation of this scarce resource2. This is particularly the case as patient selection for
ICU admission often must be accomplished expeditiously, on short notice, at inopportune times and by junior members of the ICU staff. Unless specific policy guidelines are developed, implemented and adhered to such decision making becomes subject to the variabilities of personal biases.
Establishing ICU guidelines is not as simple as it might seem and the process itself reveals ethically troublesome issues. The information available for sound decision making is expanding. Protocols to evaluate the outcomes of patients suffering specific medical problems have led to the development of scoring systems for objectively quantitating severity of illness and predicting the outcomes based on specific underlying diseases and physiologic conditions3,4,5. Although this information has improved our
Scoring systems versus randomized controlled trials
Although rigorous experiments or large randomized controlled trials are the gold standard for evaluating existing or new interventions, these are not always possible in intensive care. For example,it is unethical to randomly allocate severely ill patients to receive intensive care or general ward care. The alternative is to use observational methods that study the outcome of carepatientsreceive as part of their natural treatment6.
Evaluation of Outcome
Intensive care has developed over the past 30 years. Without enough rigorous scientific evidence on clinical evidence, doctors delivering intensive care often have to decide which patients will benefit most. Scoring systems have been developed in response to an increasing emphasis on the evaluation and monitoring of health services. These systems enable comparative audit and evaluative research of intensive care6.
The evaluation of any outcome requires performing two specific processes. The First, the outcome of interest should be clearly defined so that it can be measured accurately and second, methods or techniques should be available to predict the outcome1. In most outcome investigations involving critically ill patients, the outcome
measured has been patient mortality. Other outcomes representing important societal issues have not received the same attention as mortality in critical care but include the effectiveness of resource utilization and cost benefit analysis of therapies and diagnostic modalities used in critical care, the resultant attitudes of patients and their families in regard to critical care, the long term quality of life after ICU care and the systematic evaluation of the process of critical care as it is being administered1.
Risk Adjusted Mortality
Risk adjusted mortality remains the commonest benchmark for neonatal, paediatric, and adultICU performance7. Mortality risk scoring systems are integral to the
drawn about outcomes of treatment in such studies the characteristics of the patients admitted to intensive care have to be taken into account. This process is known as adjusting for case mix. Scoring systems are aimed at quantifying case mix and using the resulting score to estimate outcome.
The death rate of patients admitted to intensive care units is much higher than that of other hospital patients. Given the relatively high mortality among intensive care patients, death is a sensitive, appropriate, and meaningful measureof outcome. However, death can result from many factors otherthan ineffective care. Outcome depends not only on the input (equipment,staff) and the processes of care (type, skill, and timing of care) but also on the case mix of the patients. The patient populationof an intensive care unit in a large tertiary care centre may be verydifferent from that of a unit based in a district general hospital. Patients are admitted to intensive care for a wide range of clinical indications; both the nature of the current crisis and any underlying disease must be considered. Intensive care units admitting greaterproportions of high risk patients would be expected to have ahigher mortality.
A valid scoring system must predict mortality accuratelywhile adjusting for case mix and disease severity,but also requires data capture that is feasible in clinicalpractice, and should be updated to reflect changes and advances in ICUcare7.
Measurement of Outcome
The essential characteristics of an ideal predictor of outcome would include
• The prediction rule should have a well defined biological outcome that is easily
measured and clinically relevant.
• The rule should be derived from a broad, large database so that it would be
applicable to a large number of patients.
• The error rate of any prediction rule should be well known and its significance
well understood.
founded entirely upon the knowledge of physicians and objective probability, drawn from databases of compiled clinical information.
Criteria for selecting a scoring system
• Proposed use • Validity of score • Reliability of score
• Discrimination of scoring system • Calibration of scoring system
Evolution of scoring systems in intensive care
Paediatric scoring systems can be broadly classified as in table.1. The earlier scoring systems6 were developed for trauma patients and were either
specific anatomical methods Abbreviated injury score, 1969 Burns score, 1971
Injury severity score, 1974 or
specific physiological methods Trauma index, 1971 Glasgow coma scale, 1974 Trauma score, 1981 Sepsis score, 1983
A brief description of important scoring systems which are in vogue follows. Description of scoring systems pertaining to the study will follow.
The Abbreviated Injury Score
The Abbreviated Injury Scale8 (AIS) is an anatomical scoring system first
Injuries are ranked on a scale of 1 to 6, with 1 being minor, 5 severe and 6 an unsurvivable injury. This represents the 'threat to life' associated with an injury and is not meant to represent a comprehensive measure of severity. Organ Injury Scales of the American Association for the Surgery of Trauma are mapped to the AIS score for calculation of the Injury severity score.
Injury severity score (1974)
The Injury Severity Score9 (ISS) (Table 3) is an anatomical scoring system that
provides an overall score for patients with multiple injuries. Each injury is assigned an Abbreviated Injury Score (AIS) score, allocated to one of six body regions (Head, Face, Chest, Abdomen, Extremities (including Pelvis), External). Only the highest AIS score in each body region is used. The 3 most severely injured body regions have their score squared and added together to produce the ISS score.
The ISS takes values from 0 to 75. An example of the ISS calculation is shown in table 3. If an injury is assigned an AIS of 6 (unsurvivable injury), the ISS score is auto-matically assigned to 75. The ISS correlates linearly with mortality, morbidity, hospital stay and other measures of severity.
It's weaknesses are that any error in AIS scoring increases the ISS error, many different injury patterns can yield the same ISS score and injuries to different body regions are not weighted. Since a full description of patient injuries is not known prior to full investigation & operation, the ISS (along with other anatomical scoring systems) is not useful as a triage tool.
Numerous other predictive systems have been developed to forecast patient outcomes in many clinical setting. Examples are the APACHE (Acute Physiology And Chronic Health Evaluation), the MPM (mortality prediction model), and the SAPS (Simplified Acute Physiological Score) aimed at the general intensive care population. Apart from these, models have also been developed to focus on the paediatric age group namely the PRISM, PRISM II, PRISM III, PELOD, PIM and the PIM2 which are discussed further on. For the neonates, scores such as the neonatal therapeutic scoring system (N-TISS)10, Clinical Risk Index For Babies (CRIB)11,Simplified Newborn Illness
Measuring severity by treatment
Therapeutic Intervention Scoring System (TISS)
The therapeutic intervention scoring system3 (TISS) published in 1974 was
developed to quantify severity of illness among intensive care patients based on the type and amount of treatment received. The underlying philosophy was that the sicker the patient, the greater the number and complexity of treatments given. By quantifying this, a proxy measure of the severity of illness for a patient could be obtained. The system scored 76 common therapeutic activities and was last updated in 1983. A simplified version based on 28 therapeutic activities (TISS 28)14 has been published and a version
for patients in high dependency units has been proposed. Another approach is to assess the severity of organ dysfunction based on the type and amount of treatment received. These organ failure scoring systems are used to give a probability of hospital death which takes into account the severity of dysfunction in each organ system and the effect on prognosis of dysfunction in several organ systems.
Objective probability estimates using continuous variables
Acute Physiology Score and Chronic Health Evaluation (APACHE)
In the mid1970s William Knaus developed the APACHE15. This score uses
continuous variables such as body temperature, serum sodium and pulse rate which are likely to be deranged in the setting of critical illness and therefore are more likely to portray an accurate image of the severity of physiologic derangement than non continuous variables.
However the large number of variables required for the APACHE I became a source of systemic inaccuracy. The APACHE I15 presented a practical problem because
considered critical did not improve the overall explanatory power of the system. A major criticism of the original APACHE system was that the variables were chosen by a group of physicians. This panel of experts approach to selection of variables introduces the potential for bias.
Apache II
The APACHE II4,15 (1985)(Table 4) further reduced the number of variables to 12.
When judged against the ideal predictive instrument the APACHE II has several strengths. It had a well defined outcome (Hospital Death); it was derived from a large data base, and the source of bias present in its prototype was understood and corrected. It takes into account the age, pre morbid conditions, and the principal reason for ICU admission. It is accurate in predicting overall mortality in critically ill patients and has been used widely in clinical trials.
However the APACHE is not free of disadvantages. The scoring occurs within 24 hours after admission and there is no adjustment for the clinical course. The important sources of error and bias in the APACHE II include a selection bias where inaccuracies were revealed while predicting mortality in patients with trauma (due to inadequate weight for Glasgow coma scale), cardiogenic pulmonary edema, low albumin states, hematological malignancy and hepatic failure. The acute physiologic score does not take into account previous treatment and hence may underestimate the mortality of patients referred from other hospitals and intensive care units. Another source of error would be the reliance on a single diagnosis in the regression equation in calculating the risk of mortality. Patients in the ICU often suffer from simultaneous conditions involving more than one organ system. Several errors with relation to data collection also plague the APACHE II, with the worst values over the first 24 hours of ICU stay being required. Considerable inter-observer variability with relation to detail is also a contributing factor.
Apache III
The APACHE III15 draws from a larger and more diverse patient population than
severity between patients suffering form the same disorder. Even so the presence of a selection bias is unavoidable as ICU admission is an arbitrary clinical decision.
The majority of predictive power derives from weighted continuous physiological variables used to calculate a physiology score. When combined with additional points for age and significant co morbid conditions a raw score is obtained. The raw score can range from 0 to 299 and there is a statistically significant increase in predicted mortality for a given diagnosis with each five point increase. New variables such as albumin, bilirubin, BUN, blood glucose levels and urine output values were added.
Recently the APACHE IV16 has been devised to help quantify severity of illness better.
Simplified Acute Physiology Score (SAPS)
The Simplified Acute Physiology Score15 was developed in response to the
complexity and the time consuming nature of the APACHE I. In this model the 34 variables that formed apart of the APACHE score were subjected to a discriminate analysis and multiple linear regression test, from which 13 variables were identified as having the most discriminate power and were the most frequent ones measured covering all major systems. Elements of SAPS have been incorporated into subsequent models such as the SAPS II (1993).
The Mortality Prediction Model (MPM)
Separate predictive equations were developed for estimates of mortality risk at the time of ICU admission, at 24 hours and after 48 hours of admission15. Eleven clinical
Glasgow Coma Scale is a score which is still in general use in intensive care. The scale avoids having to describe a patient's level of neurological function in words and the assumption that colleagues understand the same meaning from those words. A similar scale used in children is shown in table 5.
Scores Specific for Paediatric Intensive Care
They enable us to investigate the best ways of organizing paediatric intensive care (by comparing different units), to monitor the effects of changes in practice (by observing trends within units over time), to assess the relationship between severity of illness and length-of-stay or cost, and to monitor the effects of rationing intensive care17.
PRISM, PIM, and PELOD scores are composite scores18 (aggregate scales) that
are made up of a group of variables. It is the death rate that was used as the outcome measure to estimate the validity of all these scores. Many types of variables can be used in constructing such scores, including clinical data like heart rate, physiologic data like cardiac index, laboratory data like creatinine or PaO2, and other scores like the Glasgow coma score that is integrated into the PRISM score. The number of points of each variable are be proportional to its capacity to predict a given outcome. More points are attributed to a given variable if the predictive value of the organ or system monitored by this variable is more significant. More points are given if the dysfunction is more severe. For example, in the PELOD12 score, severe dysfunction of the cardiovascular or
Prognostic Scores versus Outcome Scores
Prognostic scores were developed to better describe the severity of illness at baseline of groups of critically ill patients. These scores consider some co-morbidities and physiologic disturbances at entry into the pediatric intensive care unit (PICU) or at randomization in a clinical trial. They were developed to maximize prediction of the overall risk of mortality among groups of critically ill patients, given the severity of the patients.
On the other hand outcome scores describe the severity of illness during stay in the intensive care unit (ICU). In this instance, organ physiologic disturbances are collected daily from baseline to outcome or discharge from the ICU. The most abnormal values are retained. The total of points can be then computed in risk of mortality. Outcome scores were developed and validated to maximize description of the clinical course of groups of patients. Mean risk of mortality of a population can also be compared with actual mortality to get a standardized mortality ratio.
Relevance of composite scores
Discrimination and calibration are two very important characteristics of a score. Discrimination is the ability of a test to differentiate patients who meet the outcome (for example, death) and those who do not. The discrimination capacity (predictor performance) of a test is best described by its area under the receiver operating characteristics curve. The calibration of a score is the degree of correspondence at different levels of probability between the probability of the outcome (for example, death) as predicted by the score and the observed frequency of the outcome. The statistical question is: are discrepancies between observed and expected mortality statistically significant?
light, moderate, or severe MODS. The problem with such a 4-grade qualitative scale (no MODS, light, moderate, or severe MODS) is that the interrater variability is large. Such qualitative scale can be considered as soft data because what is meant by words such as light, moderate and severe can be very different from one caregiver to the other. There is indeed strong evidence that qualitative expressions like that are not reliable. This must apply to qualitative scales.
A semi quantitative or ordinal score is clearly better18. For example, one can
describe the severity of cases of MODS by reporting the number of dysfunctional organs, which can range from zero to six in critically ill children. There are problems here, too, because the risk of death is different from one organ to the other. For example, in a group of critically ill patients, neurologic or cardiovascular dysfunctions are more important and more predictive of death than hepatic dysfunction. A well developed and well-validated quantitative score can take into account the independent weight of each variable that is integrated into it. Greater of fewer points are attributed to each variable included in the score.
Composite scores are relevant if they are used. This is the case when PRISM and PIM scores are frequently used to compare the efficacy of different PICUs, given the expected mortality predicted by these scores in these units (quality assurance and quality assessment), and in clinical trials to compare the severity of illness of patients at randomization.
Subsequently a few important paediatric outcome scoring systems will be reviewed (PELOD, P-MODS, DORA, CRIB, SNAP) followed by a review of the prognostic scoring systems (PTS, MSSS, PRISM, PIM,).
Outcome scores
Paediatric Logistic Organ Dysfunction (PELOD)
Multiple organ dysfunction syndrome is more frequent than death in paediatric intensive care units. Estimation of the severity of this syndrome could be a useful additional outcome measure in clinical trials in such units. The initial study12 was a
tertiary-care paediatric intensive tertiary-care units of university-affiliated hospitals (two French, three Canadian, and two Swiss) involving 1806 consecutive patients (median age 24 months; inter quartile range 5–90).
PELOD score12 (1999) includes six organ dysfunctions and12 variables and was
recorded daily. For each variable, the most abnormal value each day and during the whole stay were used in calculating the dPELOD (daily PELOD) and PELOD scores, respectively. The outcome was vital status at discharge.
Findings 21% of patients had no organ dysfunction, 26% had one, 25% had two, and 28% had three or more. Case fatality rate was 6·4%. The PELOD score was significantly higher in non-survivors than survivors (p<0·0001)12. Calibration of PELOD
and dPELOD scores was good. Interpretation PELOD and dPELOD scores was found to result in valid outcome measures of the severity of multiple organ dysfunction syndrome in paediatric intensive care units, and their use could reduce the sample size required to complete clinical trials in critically ill children.
Paediatric Multiple Organ Dysfunction Score (P-MODS)
The P MODS29 (2005) was developed in a pediatric intensive care unit at a
tertiary care pediatric teaching hospital. A total of 6,456 pediatric consecutive admissions (mean age 4.62 yrs) admitted to the pediatric intensive care unit were followed up to identify variables that could define organ dysfunction in children and also to develop a Multiple Organ Dysfunction Score (P-MODS) while looking for a correlation of the score with outcome at pediatric intensive care unit discharge.
corresponding to mortality rates of <5% and >50%, respectively. P-MODS were calculated by summing the worst score for all variables.
The score correlated strongly and in a graded fashion with pediatric intensive care unit mortality rate. In both sets (development and validation), mortality rate was <5% when the score was 0 and >70% at the highest score. Overall mortality rate was 5.9% (development set) and 5.3% (validation set). The score showed excellent discrimination reflected in areas under the curve: 0.81 (development set) and 0.78 (validation set).
Dynamic Objective Risk Assessment (DORA)
DORA (1991) is a mortality risk predictor based on physiologic data that estimates daily the probability of a patient dying within the next 24 hrs as that probability changes with disease and recovery. The study was initially done in nine pediatric ICUs. Data from 1,401 patients (116 deaths, 5,521 days of care) were used for predictor development, and 1,227 patients (105 deaths, 4,597 days of care) provided data for predictor validation31.
The predictor was developed by logistic regression analysis using the Paediatric Risk of Mortality (PRISM) scores of all previous days as potential predictor variables. Performance was measured by the area under the receiver operating characteristic curve and by the comparison of the daily predicted vs. observed patient status in five mortality risk groups (less than 0.01, 0.01 to 0.05, 0.05 to 0.15, 0.15 to 0.3, greater than 0.3).
Only the most recent and the admission day Paediatric Risk of Mortality scores (with a weighting ratio of 3:1) contributed significantly (p less than .05) to the prediction. The daily number and distribution of survivors and non survivors in the five mortality risk groups were well predicted in the total sample and each ICU separately. This dynamic predictor improved (p less than .01) ICU outcome prediction over an admission-day predictor31.
over time expanded its applicability over static predictors by enabling the charting of patient courses, and permitting ICU efficiency analysis
Clinical Risk Index for Babies (CRIB I and II)
CRIB (Table 6) is a neonatal scoring system. Scores are given for birth weight, gestational age, maximum and minimum fraction of inspired oxygen and maximum base excess during the first 12 h, and presence of congenital malformations11. CRIB was
developed retrospectively in a cohort of 812 infants of birth weight 1500 g or less or gestational age less than 31 weeks treated in four UK tertiary hospitals between 1988 and 1990. The area under the receiver operating characteristic (ROC) curve for predicting death in this validation cohort (a measure of the predictor's accuracy) was significantly greater for CRIB than for birth weight alone (0·90 [SE 0·05] vs 0·78 [0·03], P=0·03).
Calculation of risk- adjusted mortality by means of CRIB showed that babies were twice as likely to die in the non-tertiary hospitals as in the tertiary hospitals in the UK (odds ratio 2·12 [95% CI 1·39-3·24]). Adjustment for birth weight alone also showed higher odds of death in non-tertiary hospitals (1·45 [1·01-2·11]). CRIB was considered a robust index of initial neonatal risk that is more accurate than birth weight and simple enough for routine use.
The appropriateness of CRIB with contemporary data was subsequently questioned, that it might be no better in prediction of mortality than birth weight or gestation alone. Furthermore, CRIB included fraction of inspired oxygen (FiO2), which is
not a true physiological measure because it is determined by the care team and also includes data up to 12 h after admission, thus potentially introducing early treatment bias.
Therefore a new five-item CRIB II score32 was developed with data from a
Simplified Newborn Illness Severity and Mortality Risk Scores (SNAP, SNAP-II and SNAPPE-II)
Substantial variation in birth weight-adjusted mortality among neonates reflects differences in population illness severity. The Score for Neonatal Acute Physiology33
(SNAP) was developed in 1992 and validated prospectively on 1643 admissions (114 deaths) in three ICUs.SNAP scored the worst physiologic derangements in each organ system in the first 24 hours. SNAP showed little correlation with birth weight and was highly predictive of neonatal mortality even within narrow birth weight strata. It was capable of separatingpatients into groups with 2 to 20 times higher mortality risk.It also correlated highly with other indicators of severityincluding nursing workload (r = .59), physician estimates of mortality risk (r = .65),and length of stay (R2 = .59).
Subsequently a Simplified Neonatal Illness Severity and Mortality Risk Score (Table 7) (SNAP-II and SNAPPE-II) was developed in thirty neonatal intensive care units in Canada, California, and New England during the mid 1990s. SNAP-II and SNAPPE-II are empirically validated illness severity and mortality risk scores for newborn34.
The primary outcome was in-hospital mortality. Patients moribund at birth or discharged to normal newborn care in <24 hours were excluded. Starting with the 34 data elements of the Score for Neonatal Acute Physiology (SNAP), a logistic model for in-hospital mortality was designed using 10,819 randomly selected Canadian cases. SNAP-II includes 6 physiologic items; to this were added points for birth weight, low Apgar score, and small for gestational age to create a 9-item SNAP-Perinatal Extension-II (SNAPPE-II). SNAPPE-II was validated on the remaining 14,610 cases and optimized the calibration.
The discrimination of deaths from survivors by SNAPPE-II was excellent34, with
Combining only birth weight, SGA, and low Apgar score (without SNAPII) showed ROC areas of .84, .81, and.76 for the 3 birth weight groups, respectively. The substantially higher discrimination by SNAPPE-II indicated the value of the additional physiologic derangement information.
Prognostic (predictive) scores
Paediatric Trauma Score (PTS)
The Pediatric Trauma Score (Table 8) is a trauma scoring tool for use in evaluating the severity of injury. The PTS35 adjusts its scoring areas to account for the
physiological and anatomical differences unique to the pediatric patient in turn more accurately identifying the critical patient. The PTS also allows for data gathering efforts which will be especially important with the development of a country wide trauma system and trauma registry. Locally the PTS can provide data on injury patterns for a geographical location which can be used to develop injury prevention programs and continuing education programs for EMS personnel.
The PTS consists of six parameters which are common determinants of the clinical condition in the injured child. During the initial assessment of the injured child each parameter is assessed and given a numeric score based upon its three associated variables: +2 (no injury or non-life threatening), +1 (minor injury or potentially life threatening), or -1 (life-threatening). Totals can range from a +12 to a -6 with the range of <8-9 being the critical break point for transport to a comprehensive pediatric trauma care facility.
Meningococcal Septic Shock Score MSSS
A sensitive scoring method for identification of children with presumed meningococcal septic shock (PMSS) (Table 9) at risk of death at admission to the pediatric intensive care unit was developed in 200138.The investigators wanted to develop
a mortality prediction tool for PMSS and compare its performance with three other prognostic systems: 1) a generic mortality prediction tool, the Pediatric Index of Mortality (PIM), 2) the Glasgow Meningococcal Septicemia Prognostic Score (GMSPS) and 3) the Malley score. The study design was a multi-center retrospective cohort
The study involved all children aged between 1 month and 14 years with a confirmed or presumed diagnosis of meningococcal septic shock admitted to 14 PICU's of tertiary level hospitals in Spain.
The worst value of each variable during the first 2 hours in the PICU was selected for the analysis. 30 prognostic variables were tested: (demographic and clinical)39. Also
included were 2 therapeutic variables: use of mechanical ventilation and refractory hypotension. The use of steroids as a predictor was not evaluated. The logistic regression identified seven independent predictors of death at admission: cyanosis, coma (GCS < 8), refractory hypotension, oliguria, WBC < 4000/mm3, PTT > 150% of control and base excess > -10mmol/l.
The primary outcome measure was hospital mortality, defined as death occurring before hospital discharge. A higher score on the model predicted a higher probability of death. The other three scores yielded lower ROC areas and this was statistically significant for the differences between the new score and the Malley and GMSPS ROC curves.
The 95% confidence intervals for the estimates of risk of death are not stated in the article. However, by converting the % mortality estimate in the three groups into proportions and using the raw numbers given in the article it is possible to calculate the 95% CI. Of note, the confidence intervals in the three risk groups do not overlap.
several different clinical settings especially if the probabilities of death are different. Ideally, a validation of the cutoff values of the predictor variables (the prediction model) should be a) prospective and b) in a new population and c) with a different prevalence and spectrum of the underlying disease. The current study does not meet the first criterion as it was retrospective but does meet the second criterion fully. It meets the third criterion partially as the validation sample had an overall different case mix and study period than the development sample. Specifically, there were significantly more cases of sero group C, female sex and a shorter time to admission to the PICU from the time of appearance of petechiae.
The new score differs from a generic prediction tool like the PRISM and PRISM II in that it is derived from a more homogenous group of patients ("customized probability model"). Neither the new scoring system nor the comparison models were able to predict a risk group with 100% mortality. Information from the model about the child's average risk of dying, may be useful to surrogate decision makers like parents and to treating clinicians in making informed decisions about the risks/benefits of aggressive/expensive therapies.
Paediatric risk of mortality score (PRISM)
The Paediatric Risk of Mortality18 (PRISM) score was developed from the
Physiologic Stability Index (1986)21 by Pollack et al. (it is named PRISM II score by
non survivors in adjacent mortality risk intervals were accurately predicted. ROC analysis also demonstrated excellent predictor performance (area index = 0.92 +/- 0.02).
PRISM is accurate and widely accepted, but many units do not use it routinely because it is difficult to collect the large amount of information needed to calculate it. PRISM scores should be used in critically ill neonates, infants, children, or adolescents, not in premature infants or in adults The variables used by PRISM that are not used by PIM are diastolic blood pressure, heart rate, respiratory rate, arterial partial pressure of carbon dioxide, the Glasgow Coma Score prothrombin time, serum bilirubin, serum potassium, serum calcium, blood glucose and plasma bicarbonate.
Updated Paediatric Risk of Mortality score(PRISM III)
The relationship between physiologic status and mortality risk was reevaluated as new treatment protocols, therapeutic interventions, and monitoring strategies are introduced, and as patient populations changed necessitated the development of a third-generation pediatric physiology-based score. In addition, since minimizing the time period for assessing mortality risk is advantageous for evaluating pediatric ICU quality, a 12-hr prediction model as well as a 24-hr prediction model was developed. The PRISM III was developed in 32 pediatric intensive care units representing about 10% of all pediatric ICUs in the United States20, between 1993 and 1994.Consecutive admissions at
each site were included until at least 11 deaths per site occurred.
Exclusion criteria included a) admissions for recovery from procedures normally cared for in other hospital locations; b) patients staying in the ICU less than 2 hrs; c) patients transferred from the study pediatric ICU to another ICU because their outcome could not be clearly credited to either ICU; and d) patients admitted in a state of continuous cardiopulmonary resuscitation who never achieved stable vital signs for at least 2 hrs.
Physiologic Stability Index and PRISM that unmeasured variables were assumed to be normal. Therapeutic variables that may be unduly influenced by practice patterns were avoided.
Physiologic data included the most abnormal values from the first 12 and the second 12 hrs of ICU stay. Outcomes and descriptive data were also collected. Physiologic variables in which normal values change with age, were stratified by age (neonate, infant, child, adolescent). The data consisted of the following: systolic and diastolic blood pressures; heart rate; respiratory rate; temperature (oral, axillary, or core); coma status; pupillary reactions; pupillary size and equality; concentrations of sodium, potassium, total CO2, bicarbonate, total and direct bilirubin, total and ionized calcium,
glucose, blood urea nitrogen, creatinine, and albumin; hemoglobin; white blood cell count; platelet count; prothrombin and partial thromboplastin times; pH and PCO2
(arterial, venous, or capillary); and PaO2 with a simultaneous FIO2. Whole blood as well
as serum/plasma measurements of sodium, potassium, and glucose were also collected. For variables where both high and low abnormalities may reflect increased mortality risk, both the high and the low values were collected. Thus, both high and low values of the same physiologic variable could contribute to severity of illness. Physiologic data accumulated during the pre terminal period in patients dying within the first 24 hrs of pediatric ICU care were not included in the study when death was obvious.
When several variables overlapped significantly in the assessment of physiologic dysfunction, they were combined into a composite variable. For example, pH and total CO2 were combined into a variable representing acidosis.
used in the final predictors. Variables in the original PRISM that are not included in PRISM III are diastolic blood pressure, respiratory rate, PaO2 /FIO2, and bilirubin and
calcium concentrations20. Variables which are included in PRISM III but not in PRISM
are temperature, pH, PaO2, creatinine concentration, blood urea nitrogen concentration,
white blood cell count, and platelet count.
The PRISM III score and the additional risk factors were applied to the first 12 hrs of stay (PRISM III-12) and the first 24 hrs of stay (PRISM III-24). There were no significant calibration errors. The area under the receiver operating curve and Flora's z-statistic indicated excellent discrimination and accuracy (area under the receiver operating curve for PRISM III-12 (.947 +/- 0.007); PRISM III-24 (0.958 +/- 0.006).
Generally, the PRISM III-24 performed better than the PRISM III-12 models. Excellent goodness-of-fit was also found for patient groups stratified by age, and by diagnosis. PRISM III-24 was compared with the original PRISM, area under the receiver operating curve improved by 3.9% (PRISM 0.914; PRISM III 0.950, p less than .0001).
PRISM III resulted in several improvements over the original PRISM. Reassessment of physiologic variables and their ranges, better age adjustment for selected variables, and additional risk factors resulted in a mortality risk model that was more accurate and discriminates better. First, the physiologic variables and their ranges were reevaluated thereby eliminating some ranges that did not contribute significantly to mortality risk (e.g., high systolic blood pressure). Although some physiologic variables have been eliminated and others added the variables with the greatest importance in outcome prediction were the same in both scores: low systolic blood pressure, altered mental status, and abnormal pupillary reflexes.
While age was included as an explicit variable in the original PRISM score, it was included in the PRISM III score in a logically and clinically more convincing form by using appropriate age-adjusted physiologic variable ranges.
sample.. These units encompass a wide diversity of organizational structure and patient mixes. This diversity makes the sample sufficiently representative for most units, enabling PRISM III to be used in the comparative assessment of pediatric ICU outcomes in essentially all pediatric ICUs.
PRISM reduced the number of physiologic variables to 14 and their ranges to 34. The total number of ranges in PRISM III was reduced. PRISM III-24 incorporates the most information over the longest time period. The use of the PRISM III-12 model is appealing for quality assessments since, by shortening data acquisition time, it better separates the observation from the treatment period, while the PRISM III-24 model is more accurate for individual patient mortality risk assessments. The large number of diverse ICUs in the database indicates PRISM III was more likely to be representative of United States units. A serious problem with 12 or 24-h scores was that they were affected by treatment given after admission to intensive care, so that they are not valid instruments for comparing the quality of care between different units, or within a single unit over time. Children admitted to a good PICU who recovered were found to have lower PRISM scores than similar Children admitted to a bad PICU who are mismanaged in the first12– 24 h, and the bad unit‘s high mortality rate will be incorrectly attributed to its having sicker patients.
Development of the Paediatric index of mortality scores (PIM and PIM2)
Paediatric index of mortality (PIM)
Towards the end of the 20th century a need was felt for models that predict the risk
of mortality in children in intensive care which would allow evaluation of the effectiveness and efficiency of paediatric intensive care. Models to compare the standard of care between units and within units over time by adjusting for differences in severity of illness and diagnosis were required. Comparing different systems of organising intensive care was another need at that point. Estimating mortality risk was also considered an important component of comparing groups of patients in research trials. One such score was the PIM score.
from consecutive admissions to seven paediatric intensive care units in Australia and one in Britain. The development of PIM began in 1988, when information was collected about 678 consecutive admissions over 6 months to the PICU at the Royal Children‘s Hospital, Melbourne. The variables collected were the 34 PSI (physiological stability index) variables21, along with mean arterial pressure, ventilator peak inspiratory pressure
(PIP), ventilator positive end-expiratory pressure (PEEP), motor response to pain, immature neutrophil count, total neutrophil count, base excess, and rectal temperature. The worst value of each variable in the first 24 hours after admission as recorded for all 678 patients, and the admission values were also recorded for the last 230 patients.
The second stage22 of the study began in 1990, when 814 consecutive admissions
to a PICU at Melbourne were studied. Information was collected at the time of admission and over the first 24 h in PICU about age, gestational age, pupil reaction to light, and motor response to pain, base excess, mean arterial pressure, and respiratory rate, arterial carbon dioxide tension (PaCO2), PIP and PEEP.
In the third stage22 of the study, from February 1994 to March 1995, 1412
admissions to include at least 20 deaths. As a check on the accuracy of data collection, a sample of the data was collected in duplicate. The information from the above was used as a learning sample to determine the regression coefficients of a logistic model. The fit of the model developed on the learning sample was then tested on children admitted to the PICUs at Birmingham, Brisbane, and Adelaide. Calibration of the model, to evaluate how well the model classifies subjects into low, medium and high risk categories, was done. Inspection of the number of observed and expected deaths and survivors in five groups with <1%, 1–4%, 5–14%, 15–29% and 30% or more predicted mortality was also carried out. Discrimination estimates how well the model distinguishes between patients who lived and patients who died. Once the model was found fit in both the development and the validation groups, logistic regression coefficients were re-estimated using the entire sample. The first, second and third parts of the study were used to determine the variables that were included in the fourth part of the study. A total of 5695 children were in the fourth part of the study, and 278 of them died. Six of the 278 deaths occurred within 24 h of discharge from intensive care. No patient was lost to follow-up22.
Physiological variables that were not measured were considered to be normal. Values for systolic blood pressure, base excess were transformed using statistical methods24,25. The predictive power of pupil size, inequality in size, and their reaction to
light was obtained.
Each child was allocated one of 214 different diagnoses; nine diagnoses were associated with an increased risk of mortality, even when information from the other PIM variables was taken into account.
Pupils fixed to light, Specified diagnosis, Elective admission, Mechanical ventilation, absolute (SBP-120) mmHg, absolute (base excess), 100´FiO2/PaO2 (mmHg–1).
Some of the other salient findings of the study to device the PIM score include the fact that neonates had a higher mortality than older children, but inclusion of age did not improve the prediction of the model. Correction for age did not improve the predictive power of systolic or mean blood pressure, pulse rate, or respiratory rate. None of the PICUs had a significant effect when they were included in the model as dummy variables.
The final model was estimated using the entire sample from the fourth part of the study. The deciles of risk goodness-of-fit test gave p=0.37 and the areas under the ROC plot was found to be consistently above 0.8022. The model described their risk of
mortality for babies less than one month well. A training model was developed on one group of intensive care units and was applied to another group of unit so as to provide a more stringent test than just randomizing individual patients to the training or test set26.
Death was chosen as the dependent variable in this model, rather than death in hospital or death within one month of admission into a PICU. Death in PICU is the mortality outcome that is of most practical interest to paediatric intensivists and was the outcome used by PRISM17. Multiple admissions for an individual were included in the
study because the model was used on data that includes children who are admitted several times.
The PIM model was simple enough for it to be widely used in paediatric intensive care – it required the collection of only eight variables at the time of admission to intensive care, while having a good predictive power. The PIM was developed in dedicated PICUs where there are high levels of consultant input, senior resident staff and trained PICU nurses.
Paediatric index of mortality 2 score (PIM2)
Outcome in terms of mortality is influenced by new treatments and new management approaches. Changes in referral practices, systems of providing intensive care, attitudes to the indications for commencing and discontinuing life support lead to changes in thresholds for admission to intensive care and alterations in the relationship between disease and outcome. Further, as experience, and therefore the quantity of data, expands it is possible to use a larger and more diverse patient population to develop mortality prediction models.
The objective behind development of the PIM227 (Table 10) was to revise the
Paediatric Index of Mortality (PIM) to adjust for improvement in the outcome of paediatric intensive care, through an international multi centre observational study carried out in twelve specialist paediatric intensive care units and two combined adult and paediatric units in Australia, New Zealand and the United Kingdom. 20,787 patient admissions of children, less than 16 years, admitted during the study period were included. Again there were no interventions27. A revised model was developed by
forward and backward logistic regression. Variable selection was based on the effect of including or dropping variables on discrimination and fit. The addition of three variables, all derived from the main reason for ICU admission, improved the fit across diagnostic groups. Data from seven units were used to derive a learning model that was tested using data from seven other units. The model fitted the test data well and discriminated between death and survival well (area under the receiver operating characteristic (ROC) plot 0.90 (0.89-0.92)). The final PIM2 model, derived from the entire sample of 19,638 survivors and 1,104 children who died, also fitted and discriminated well [2 11.56,
Ten Australian and New Zealand intensive care units, and 4 British units28
collected uniform paediatric data commencing on January 1, 1997. The data included the PIM variables, demographic variables, the principal ICU diagnosis (defined as the main reason for ICU admission) and ICU outcome (died in ICU, discharged or transferred to another ICU). Data from the above were combined to develop and validate a revised model, PIM2. All patients admitted consecutively during the period of study were included. Patients 16 years or older were excluded, as were patients transferred to other ICUs, because these patients could not be appropriately classified as ICU survivors or deaths.
The first step in revising the model was to examine the ratio of observed deaths to deaths predicted by PIM in the entire population, and when patients were grouped by mortality risk, diagnosis, diagnostic group, intensive care unit, and age27. The aim was to
identify patient groups where PIM either over-predicted or under-predicted mortality. Individual variables were examined for association with mortality using appropriate statistical methods. When appropriate, transformation was used to improve the relationship between a variable and mortality, followed by forward and backward logistic regression to test each of the original variables and potential additional or substitute variables.
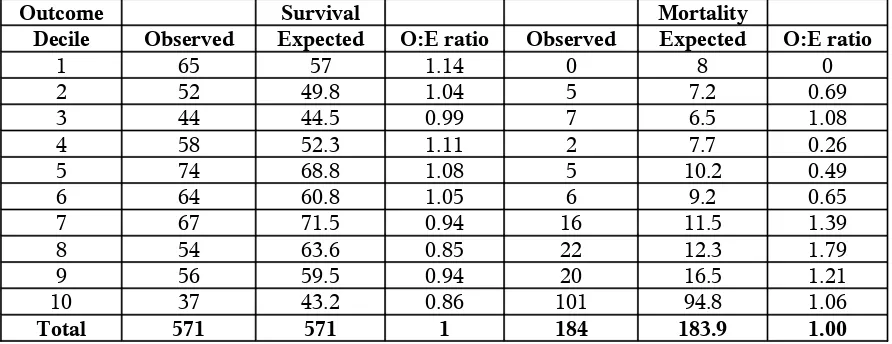
To test the revised model, the population was divided into a learning and test sample by randomly selecting units, stratified by size of unit and country. The logistic regression model developed in the learning sample was evaluated in the test sample by calculating the area under the receiver operating characteristic plot to assess discrimination between death and survival29. Calibration across deciles of risk was
evaluated using the Hosmer-Lemeshow goodness-of-fit test. To examine the fit of the model in more detail, tables were constructed to assess calibration across risk, age, and diagnostic group by visual inspection of the number of observed and expected deaths.
This re-calibrated, first generation model was then tested. Discrimination was adequate (area under the curve in a ROC was 0.88 (CI 0.87-0.89))27, however, calibration across
diagnostic groups was poor in two groups: respiratory illness and non-cardiac post-operative patients (observed: expected deaths, 160:212.8 and 48:82.0, respectively). The PIM variable "Specific Diagnosis" included nine diagnoses associated with increased risk of death. The diagnoses –in hospital cardiac arrest and liver failure were associated with increased risk of death and five common diagnoses (asthma, Bronchiolitis, croup, obstructive sleep apnoea, diabetic keto-acidosis) were associated with reduced risk. The mortality of patients admitted primarily for post-operative recovery was better than predicted by PIM for all surgical groups except for patients admitted following cardiac bypass. "Specific Diagnosis" seen in the PIM was replaced by "High Risk Diagnosis" and "Low Risk Diagnosis" in the PIM 2. Pupillary reactions as defined in PIM remained a significant predictor both in Univariate and multivariate analysis. No change was made to the four physiological variables from the original model.
In the test sample the new model discriminated well between death and survival [Area under the curve (Az) ROC 0.90 (0.89-0.92)] and calibrated across deciles of risk well (goodness of fit 2 8.14, 8df, p=0.42). The final PIM2 model estimated from the entire
sample also discriminated and calibrated well (Az ROC 0.90 (0.890.91); goodness-of-fit test 2 11.56, 8df, p=0.17)27. The performance in respiratory illness and non-cardiac
post-operative patients was improved in the revised model.
PIM2 was derived from a larger, more recent and more diverse data set than the one used for the first version of PIM27. Three variables, all derived from the main reason
for ICU admission, had been added to the model (admitted for recovery from surgery or a procedure, admitted following cardiac bypass and low risk diagnosis). Changes have been made to the variable "High Risk Diagnosis": the criteria for cardiac arrest had changed, liver failure was been included and IQ below 35 omitted.
On application of the original PIM model to the second data set, the overall standardized mortality ratio (SMR) was 0.86 (0.81-0.90) with similar values encountered in all units. However 14% of the children predicted to die using 1994-1995 standards survived in 1997-199927. The explanation for this improvement was not known. It was
therapies. Critically ill children were probably being recognized and referred earlier with good effect. It was not possible to test these or other hypotheses on the current data and the explanation for the apparent improvement in management is unknown. The standard of care set by the original PIM was high22 compared to PRISM and PRISMIII with the
standard set by PIM2 is even higher27.
The same methods were used in the development of both models. Variables were included only if they improved the discrimination or calibration of the model. To test the new model, the data were split into two groups of units. Coefficients derived on the learning sample demonstrated good performance in the test sample. The coefficients derived from the entire sample were used in the final model.
Examination of the model performance in specific diagnoses resulted in other changes to the model. The risk-adjusted outcome for cardiac arrest preceding ICU admission was similar for in-hospital and out-of-hospital cardiac arrest; therefore PIM2 does not restrict cardiac arrest preceding ICU admission to out-of-hospital cardiac arrest. Liver failure (acute or chronic) as the main reason for ICU admission has been added to the list of high risk diagnoses. The specific diagnosis "IQ below 35" was removed, primarily because it proved difficult to code reproducibly, particularly in young children. Omitting this diagnosis from the model altered the area under the ROC plot by less than 0.1%27. A major advantage of using admission data to estimate the mortality risk was
that the model was not biased by the quality of treatment after admission. In this respect PIM is preferred to models that use data collected during the first 12-24 h after admission. A potential criticism of PIM, however, was that one of the variables, mechanical ventilation during the first hour, was also susceptible to bias resulting from different intervention thresholds. In the PIM2 study the percentage of patients intubated during their ICU stay varied between units from 25 to 93%.
Mechanical ventilation during the first hour could be considered a simple way of accounting for variation in admission thresholds and weighting the model for patients that require life support. Ideally, mortality prediction models should not be influenced by treatment. Omission of the ventilation variable from the model, resulted in a drop in the the area under the ROC plot from 0.90 to 0.8827.
When the score did not predict the correct number of deaths in a unit, it was considered that the standard of care respective unit was better or worse than the standard in the units that developed PIM2 in 1997-1999, or that the characteristics or diagnoses of patients in the unit were substantially different from the population in the original study. Changing the coefficients in the model to ensure better outcome prediction defeats one of the main purposes of the model, which is to allow units to compare their performance with that of the Australasian and UK units that developed it. PIM2 was applied only to groups of patients and not allowed to describe or influence the management of individual patients.
Details on instructions for use of the PIM2 score are given in appendix 1.
Results of various studies world wide using the PIM are discussed in the tables 11 and 12.
Differences between the PIM and the PRISM
Shann et al22 developed the PIM score as an alternative to the PRISM III 20 for
comparing observed with predicted mortality among PICUs. Any score should be valid, reliable, accurate, easier to use and cost-effective. Whether mortality prediction scores are a valid measure of the quality-of-care delivered by a PICU, is an important question.
The PIM has a simple job to do: to predict death for patients who die and survival for those who live. The evaluation of the ability of a score to discriminate among these two populations is described by the area under the receiver operator characteristic (ROC) curve. This curve is a plot of true-positive versus false-positive predictions. For the PIM this area was 0.90. PIM discriminates well in a new populations of PICUs not used in the derivation of the initial score, therefore validating the PIM. In comparison, PRISM III [2] also discriminated well (ROC area=0.94) in the separate validation sample comprised of 10% of patients from the 32 PICUs used in its development.
However values reflecting the physiological status present upon admission could reflect a transient state resulting from interventions during transport or in the operating room. To date, there is no consensus has been reached as to which approach is better.
Reliability is the ability of a score to predict mortality accurately in various subgroups of patients. The PIM is well calibrated in each decile of mortality risk. However, when patients are categorized by diagnostic groups (for example in the group comprising postoperative non-cardiac patients) the area under the ROC curve was significant. The PIM discriminates quite well for trauma patients (ROC area=0.94), but not as well in cardiac patients (ROC area=0.83)27.
Another test of reliability is the ability of various raters to derive the same score when assessing a patient at the same point in time. The PIM and the PRISM III perform well on this evaluation criterion.
In a subset of 1182 children from a single Australian PICU, PRISM predicted 118.6 deaths, PIM predicted 71.6 deaths, and there were 78 actual deaths23. Over
prediction of mortality by the PRISM score could be because the centralized care delivered by this large tertiary centre is superior. However poor performance of mortality prediction scores in countries where they were not developed has been shown in other studies36.
The PIM is a score derived in an Australian population made up of large centralized PICUs. Patients cared for in small community hospital ICUs may differ in ways that are not adjusted for by the score. The PRISM III was developed using randomly selected PICUs while ensuring that a variety of ICU characteristics were present in the development sample.