Dissertation work submitted to
The TamilNadu Dr. M.G.R. Medical University, Chennai
in partial fulfillment for the award of degree of
MASTER OF PHARMACY
IN
PHARMACEUTICAL ANALYSIS
Submitted by
NISHA.P.J
Reg No. 26106425
Under the Guidance of
Institutional Guide
Industrial Guide
Mr.P.KUMAR NALLASIVAN, M.Pharm, (Ph.D) Mr. SHAIK MOHAMMED NOOR,
Assistant Professor, Senior Manager,
Department of Pharmaceutical Analysis, Shasun Pharmaceuticals Ltd,
RVS College of Pharmaceutical Sciences, Puducherry. Sulur, Coimbatore.
DEPARTMENT OF PHARMACEUTICAL ANALYSIS
R V S COLLEGE OF PHARMACEUTICAL SCIENCES
SULUR, COIMBATORE – 641402
TAMILNADU.
This is to certify that the dissertation work entitled “
ANALYTICAL METHOD
DEVELOPMENT AND VALIDATION OF ASSAY FOR CARVEDILOL TABLETS BY
RP-HPLC, HPTLC AND UV SPECTROSCOPY
” is a bonafide work of
Ms. NISHA P.J
carried out in SHASUN PHARMACEUTICALS LIMITED, PUDUCHERRY under my
guidance and under the supervision of Mr. SHAIK MOHAMMED NOOR and has completed to
my fullest satisfaction for partial fulfillment of the award of degree of
Master of Pharmacy
in
Pharmaceutical Analysis
, R V S college of Pharmaceutical Sciences, Sulur, Coimbatore, which
is affiliated to The Tamilnadu Dr. M.G.R Medical University, Chennai. It is to certify that the
part or whole of the work has not been submitted either to this university or any other university.
This work is original and confidential.
INSTITUTIONAL GUIDE
Mr. P.KUMAR NALLASIVAN,
M.Pharm.,(Ph.D.)
Assistant Professor,
Department of Pharmaceutical Analysis,
R.V.S College of Pharmaceutical Sciences,
Sulur, Coimbatore-641402.
CERTIFICATE
This is to certify that the dissertation work entitled “
ANALYTICAL METHOD
DEVELOPMENT AND VALIDATION OF ASSAY FOR CARVEDILOL TABLETS BY
RP-HPLC, HPTLC AND UV SPECTROSCOPY
” is a bonafide research work done by Ms.
NISHA.P.J carried out in SHASUN PHARMACEUTICALS LIMITED,PUDUCHERRY under
the guidance of Mr. P.KUMAR NALLASIVAN, M. Pharm.,(Ph.D.),Assistant Professor, RVS
College of pharmaceutical science, Sulur and Mr. SHAIK MOHAMMED NOOR
,
Senior
Manager, Shasun pharmaceuticals, for partial fulfillment of the requirement for the award of
Master of Pharmacy
in Pharmaceutical Analysis
, R V S college of Pharmaceutical Sciences,
Sulur, Coimbatore, which is affiliated to The Tamilnadu Dr. M.G.R Medical University,
Chennai.
Dr. R.VENKATA NARAYANAN, M. Pharm., Ph. D
PRINCIPAL,
R.V.S College of Pharmaceutical Sciences,
Sulur, Coimbatore-641402.
CERTIFICATE
This is to certify that the dissertation work entitled “
ANALYTICAL METHOD
DEVELOPMENT AND VALIDATION OF ASSAY FOR CARVEDILOL TABLETS BY
RP-HPLC, HPTLC AND UV SPECTROSCOPY
” is a bonafide research work done by Ms.
NISHA.P.J carried out in SHASUN PHARMACEUTICALS LIMITED, PUDUCHERRY under
the guidance of Mr. P.KUMAR NALLASIVAN. M. Pharm.,(Ph.D.),Assistant Professor, RVS
College of pharmaceutical science, Sulur and Mr
.
SHAIK MOHAMMED NOOR
,
Senior
Manager, Shasun Pharmaceuticals for partial fulfillment of the requirement for the award of
Master of Pharmacy
in Pharmaceutical Analysis
, R V S college of Pharmaceutical Sciences,
Sulur, Coimbatore, which is affiliated to The Tamilnadu Dr. M.G.R Medical University,
Chennai.
Dr. W.D.SAM SOLOMON, M. Pharm., Ph. D
Professor and Head,
Department of Pharmaceutical Analysis,
R.V.S College of Pharmaceutical Sciences,
Sulur, Coimbatore-641402.
CERTIFICATE
This is to certify that the dissertation work entitled “
ANALYTICAL METHOD
DEVELOPMENT AND VALIDATION OF ASSAY FOR CARVEDILOL TABLETS BY
RP-HPLC, HPTLC AND UV SPECTROSCOPY
” is a bonafide research work done in
ORCHID HEALTHCARE, CHENNAI
by
Ms. NISHA.P.J
in partial fulfillment of the
requirement for the award of
Master of Pharmacy
in Pharmaceutical Analysis
, R V S college
of Pharmaceutical Sciences, Sulur, Coimbatore,. under the supervision and guidance of Mr.
P.KUMARNALLASIVAN. M.Pharm, (Ph.D.), Assistant Professor, Department of
Pharmaceutical Analysis, RVS College of pharmaceutical science Sulur and Mr
.
SHAIK
MOHAMMED NOOR
,
Senior Manager, Quality Control Department, Shasun Pharmaceuticals,
Puducherry.
INTERNAL EXAMINER EXTERNAL EXAMINER
Place: Place:
Date: Date:
First and foremost I thank ALMIGHTY GOD for my successful completion of this work. This
book which has turned into a reality due to the blessings and prayers of a lot of people, whom
I am really grateful to,
It gives me immense pleasure to convey my deep sense of gratitude and heartfelt thanks to my
guide Mr. P. Kumarnallasivan M. Pharm., Assistant Professor, Department of
Pharmaceutical Analysis, RVS college of Pharmaceutical Sciences, Sulur, Coimbatore for his
help, motivation, suggestions, guidance, encouragement and the confidence that he has
shown in me throughout the course of my work.
I sincerely thank Dr. R. Venkatanarayanan, Professor and Principal, RVS college of
Pharmaceutical Sciences, Sulur, Coimbatore, for his inspirations and for being a great
facilitator.
I am extremely grateful to Mr. Shaik Mohammed Noor (Senior Manager-QC),
Mr. Balu (Asst.Manager- QC) Shasun Pharmaceutical limited Puducherry, for his invigorate
guidance, felicitous advice, valuable hints with energizing criticism throughout the course of
this dissertation work.
I would like to acknowledge the help rendered by the team of method development and
validation group under Mr. K. Rajagopal , J.N. Satheesh, and Mr. G. Ratha Krishna Reddy.
Analytical research and Development, shasun pharmaceutical for providing the timely
suggestions.
I express my sincere gratitude to my teachers Mr. Sam Solomon, Mr. Sivakumar,
Mr. Vijayaanand for their meticulous guidance and encouragement provided to me for the
completion of my dissertation work.
I really grateful to Dalmia Research Centre Coimbatore for providing all the facilities for
Mr. Ramakrishnan, Mr. Karthick, Mr. Gunasekaran, Mr. Venkateshan are also and entitled to
my profuse gratitude.
I thank Mr. Sendhurpandi, Librarian, Mr. Kannan, Mrs. Stella Mary and Mr. Mohan, Asst.
Librarian, RVS college of Pharmaceutical Sciences, Sulur, Coimbatore for providing me library
facilities.
My heartfelt thanks to my friends Dibin, Deepika, Muthuvadivel, Parimaleswari, Pulla Reddy,
Rajeswari, Suresh, S.Beetha Rohini Sr. Akshaya. CSS for their support, honest opinions and
diligence kept me lively.
Above all I dedicate myself before the constant love and encouragement given to me by my
Congregation of Sisters of Charity, my Parents, Brother and dear ones, who deserves the credit
of success in whatever work I do.
Date:
NISHA P J
Place: Coimbatore (Reg.No.26106425)
ABBREVIATIONS
ACN
:
Acetonitrile
g : gram
HPLC
:
High performance liquid chromatography
pH
: Hydrogen ion concentration
ICH
:
International
conference on harmonization
mg
:
Milligram
ml
: Milliliter
µg
: Microgram
µg/ml : Microgram per milliliter
µg
: Microgram
nm
:
Nanometer
PA
:
Purity
Angle
PDA
:
Photo
diode
array
TH
:
Purity
threshold
RSD
:
Relative standard deviation
k
: Retention
time
INTRODUCTION
Quality can be defined as the character, which defines the grade of excellence. A good quality drug is something, which will meet the established product specifications, can be
safely bought and confidently used for the purpose for which it is intended.1 To get a good
quality drug ,the manufacturing for making a drug should have quality built into it.
Analytical chemistry is the science that seeks ever improved means of measuring the chemical composition of natural and artificial materials. Analytical chemistry is a sub-discipline of chemistry that has the broad mission of understanding the chemical composition
of all matter and developing the tools to elucidate such compositions.2
TYPES:
Traditionally, analytical chemistry has been split into two main types, qualitative and quantitative.
QUALITATIVE:
Qualitative analysis seeks to establish the presence of a given element, given functional group or inorganic or organic compound in a sample.
QUANTITATIVE:
Quantitative analysis seeks to establish the amount of a given element or compound in a sample.
MODERN ANALYTICAL CHEMISTRY:
Modern analytical chemistry is dominated by instrumental analysis. There are so many different types of instruments today that it can seem like a confusing array of acronyms rather than a unified field of study. Most modern analytical chemistry is categorized by different analytical methods.
Analytical methods:-
• Spectrophotometry and colorimetry.
UV-visible spectroscopy.
Commonly used methods are,
• High Performance Liquid Chromatography (HPLC).
• High Performance Thin Layer Chromatography (HPTLC).
• Gas chromatography (GC).
• Gas chromatography-Mass spectroscopy (GC-MS).
• Liquid chromatography-Mass spectroscopy (LC-MS).
SPECTROPHOTOMETRIC METHODS:
Spectrophotometry is generally preferred by industries as the cost of the equipment is less and the maintenance problems are minimal. The method of analysis based on measuring the absorption of a monochromatic light by colourless compounds in the near ultraviolet path of
spectrum (200-380nm).3The photometric methods of analysis are based on the
Bouger-Lambert Beer,s Law, which establishes that the absorbance of a solution is directly
proportional to the concentration of the analyte .The fundamental principle of operation of spectrophotometer covering UV region consists in that light of definite interval of wavelength passes through a cell with solvent and falls on to photoelectric cell that transforms the radiant energy into electrical energy measured by galvanometer.
The important applications are
• Identification of much type of organic, inorganic molecules and ions.
• Quantitative determination of many biological, organic and inorganic species.
• Quantitative determination of mixtures of analytes.
• Monitoring and identification of chromatographic of effluents.
• Determination of equilibrium constants.
• Determination of stoichiometry and chemical reaction.
• Monitoring of environmental and industrial process.
INTRODUCTION TO ULTRA-VIOLET SPECTROPHOTOMETRY
Molecular absorption in the ultraviolet and visible region of the spectrum is dependent on the electronic structure of the molecule. Absorption of energy is quantized, resulting in the elevation of electrons from orbital in the ground state to higher energy orbital in the excited state.4
The wavelength range of UV radiation starts at the blue end of the visible light and ends at
2000A0.The ultraviolet region is subdivided into two spectral regions.
1. The region between 2000-4000A0 is known as near ultraviolet region.
2. The region below 2000A0 is called the far or vacuum ultraviolet region.
Wavelengths in the ultraviolet region are usually expressed in nanometres (1nm=10-7cm) or
angstroms (A0) ,(1A0=10-8cm) occasionally absorption is reported in wave numbers (v=cm-1).
White light is made up of a large number of individual waves of varying wavelength. This is shown by passing a beam of light through a prism. When a band of colour, is formed in which each colour corresponds to waves of particular wavelength. Complete spectrum of electromagnetic radiation extends from the ultra-short wave region of the cosmic rays at one end to that of radio wave at the other.
Wavelength:
Distance between any two consecutive parts of the wave for example from the crest of one
wave to that of the next. Its symbol is λ (lambda).
Wave number:
This is defined as the reciprocal of the wavelength expressed in cm-1 i.e. the number of waves
per unit cm. Its units are cm-1.
Frequency:
This is number of waves passing a point in one second i.e. the number of cycles per second.
Atomic Absorption:
The excitation of electrons in atomic orbital to higher energy states may be induced by electromagnetic radiation of the energy. If the radiation exactly matches to difference between the upper and lower energy states.
Atomic absorption Spectrophotometry is the technique for quantitative determination of elements which is based on the measurement of absorption of monochromatic light by ground state atoms.
Molecular Absorption5:
The total energy of a molecule is the sum of electronic, vibrational and rotational energies. The relative energies required to induce electronic, vibrational, rotational transitions between the quantized energy levels are approximately 10,000:100:1.
At room temperature the energy of most molecules in the ground electronic (EE) and
vibration (Evib) states .As a result certain electrons within molecules undergo a transition to
an excite energy state and this is normally accompanied by an increase in the vibrational and rotational energies of the molecule.
∆E= (EE +Evib + Erot) upper-(EE + Evib+ Erot) lower
The technique of ultraviolet–visible spectrophotometry is one of the most frequently employed in pharmaceutical analysis. It involves the measurement of the amount of ultraviolet (190-380) or visible (380-800nm) radiation absorbed by a substance in solution. Instruments which measure the ratio or a function of the ratio of the intensity of two beams of light in the ultraviolet visible region are called UV-visible spectrophotometers.
When a beam of light is passed through a transparent cell containing a solution of an absorbing substance, reduction of the intensity of the light may occur. This is due to:
a. Reflection at the inner and outer surfaces of the cell.
b. Scatter by particles in the solution.
The reflections at the cell surface can be compensated by a reference cell containing the solvent only, and scatter may be eliminated by filtration of the solution. The intensity of light absorbed is then given by
I absorbed=I0-IT
Where I0 is the original intensity incident on the cell and IT is the reduced intensity
transmitted from the cell. The transmittance (T) is the ratio IT/I0 and the % transmittance
(%T) is given by
% 100 /
The Beer-Lambert relationship is a relationship of transmittance and absorbance with the concentration of the substance in a solution.
A =abc = logI0I = logI/T
Where ‘a’ is called absorptivity, which is constant. The name and “a” value of a depend on the units of concentration. Where “c” is in moles/litre, the constant is called molar absorptivity and has the symbol E. The equation therefore takes the form.
A = bc
The molar absorptivity at a specified wavelength of a substance in solution is the absorbance
at the wavelength of a1mol/L solution in a 1 cm cell. The unit of therefore are 1 mol-1cm-1.
Another one is the specific absorbance which is the absorbance of a 1g/100ml (1%w/v) solution in a 1 cm cell.
A = A1%1cmbc
Where c is concentration in g/100ml and b is the band length in cm. The units of A1%
1cm
dlg- 1cm-1.
A simple easily derived equation allows interconversation of and A1%1cm values.
QUANTITATIVE SPECTROPHOTOMETRIC ASSAY 6
Assay of single component samples
a) Single standard or Direct Comparison Method:
In this method the absorbance of a standard solution of known concentration and a sample solution is measured .The concentration of unknown can be calculated using the formula.
C2 =C1xA2/A1
A1,A2 = Absorbance of standard and sample
C1 and C2 = Concentration of standard and sample
b) Calibration curve method or multiple standard method:
A calibration curve is plotted using –concentration vs. absorbance value of five or more standard solution. A straight line is drawn either through maximum number of points or in such a way that there is equal magnitude of positive and negative errors that is line of best fit. From the absorbance of the sample solution and using the calibration curve, the concentration of the drug, amount and percentage purity can be calculated.
Assay of substances in multi compound sample:
The basis of all the spectrophotometric techniques for multi compound samples is the property that all samples show the property of ----
1. Absorbance which is the sum of absorbance of the individual components.
2. The measured absorbance is the difference between the total absorbance of the solution in the sample cell and that of the solution in the reference (blank) cell.
Simultaneous equation method:
If a sample contains two drugs (X and Y) each of which absorbs at the λ max of the other, it
may be possible to determine both drugs by the simultaneous equation method (Vierodt’s method).
Let component a have E11 values of a1 at λ1 and a2 at λ2 Let component b have E11 values of b1at λ1 and b2 at λ2
The extinction of a solution of the mixture is determined at λ1 and λ2 and the E11 values are
calculated-s1 and s2 at λ1 and λ2 respectively. Then
100 S1 = a1x + b1y
And 100 S2 = a2x + b2y
Where
X = concentration (as %w/w) of component a
Y = concentration (as %w/w) of component b
Solving the simultaneous equation for x and y.
X = 100 b1S2 - b2S2
b1a2 – b2a1
Y = 100 a1S2 - a2S1
a1b2 – a2b1
It should be confirmed that the extinctions of the two substances are additive and the wavelengths selected.
MEANING OF CHROMATOGRAPHY AND ITS TYPE
Chromatography is a method used for separating organic and inorganic compounds so that they can be analysed and studied. Chromatography is a great physical method for observing mixtures and solvents. The word chromatography means colour separation where chroma means colour and graphy means separation. Chromatography is based on different migration. Solutes with a greater affinity for the mobile phase will spend more time in this phase than solutes that prefer the stationary phase. As the solutes move through the stationary phase the different components are going to be absorbed and are going to stop moving with mobile phase .Thus they are separated. This is called as chromatographic development.
THE DIFFERENT TYPE OF CHROMATOGRAPHY 7
1. Adsorption chromatography:
Adsorption chromatography is probably one of the oldest types of chromatography around. It utilises a mobile liquid or gaseous phase that is absorbed on to the surface of a stationary solid phase. The equilibrium between the mobile and stationary phase accounts for the separation of different solutes.
2. Partition chromatography:
This form of chromatography is based on thin film formed on the surface of a solid support by a liquid stationary phase .Solutes equilibrates between the mobile phase and the stationary liquid.
3. Ion exchange chromatography:
In this type of chromatography, the use of a resin (the stationary solid phase) is used to covalently attach anions or cations to it. Solute ions of the opposite charge in the mobile liquid phase are attracted to the resin by electrostatic forces.
4. Molecular exclusion chromatography:
the gel, causing them to flow through a larger volume. This causes the larger molecules to pass through the column at a faster rate than the smaller ones.
5. Affinity chromatography:
This is the most selective type of chromatography employed. It utilises the specific interaction between one kind of solute molecule and a second molecule that is immobilised on a stationary phase. For example the immobilised molecule may be an antibody to some specific protein. When solute containing a mixture of protein is passed by this molecule, only the specific protein is reacted to this antibody, it to the binding stationary phase. This protein is later extracted by changing the ionic strength or PH.
High performance liquid chromatography:
HPLC is able to separate macromolecules and ionic species labile natural products, polymeric materials, and a wide variety of other high –molecular weight poly functional group. HPLC is the fastest growing analytical technique for the analysis of the drugs. It’s simplicity, high specificity, and wide range of sensitivity makes it ideal for the analysis of many drugs in both dosage forms and biological fluids .In this ,the separation is about 100 times faster than the conventional liquid chromatography due to packing of particles in the range of 3-10µm.Modern LC uses very small particles for packing. The small particle size results in more rapid approach to the distribution equilibrium and consequently smaller plate height, so that a given length of column includes large number of plates which makes the column efficient and the peak narrow. But close packing of these small particles reduces the flow rate of the mobile phase through the packed bed (the packing said to develop high back pressure) and in order to achieve a reasonable flow rate it is necessary to apply pressure to the mobile phase. So the designation, put forth as high pressure liquid chromatography. Thus HPLC is having advantages of improved resolution, faster separation, improved accuracy, precision and sensitivity.
According to the phases involved, HPLC can be classified into several types which is as follows
1. Normal phase chromatography (NPC)
2. Reverse –Phase chromatography (RPC)
4. Liquid-liquid chromatography or partition HPLC
5. Ion exchange chromatography or ion exchange HPLC
6. Size exclusion or gel permeation or steric exclusion HPLC
7. Ion pair HPLC
8. Affinity HPLC
Normal Phase Chromatography (NPC):
In normal phase chromatograph, the stationary phase is more polar than the mobile phase, and the mobile phase is a mixture of organic solvents without added water (eg.Isopropane with hexane) and the column packing is either an inorganic adsorbent( silica) or a polar bonded phase (cyano, diol,amino ) on a silica support. Sample retention in normal phase chromatography increases as the polarity of the mobile phase decreases. They are eluted in the order of increasing polarities.
Reverse phase chromatography:
Basic principle of HPLC 8
Retention is therefore used as an index for qualitative determination and peak surface area as index for quantitative determination. There are two modes of elution process
a) Isocratic elution
b) Gradient elution
Selectivity of HPLC –method development
Most of the drug can be analyzed by HPLC because of several advantages and ease of automation and eliminates tedious extraction and isolation procedures. Some advantages are:-
1. Speed (analysis can be accomplished in 20 minutes or less).
2. Greater sensitivity (various detectors can be employed).
3. Improved resolution.
4. Reliable columns (wide variety of stationary phase).
5. Ideal for substance of low volatility.
6. Easy sample recovery, handling, and maintenance.
7. Easy programming of the numerous functions in each module.
8. Time programmable operation sequence, such as initiating operation of detector lamp and isocratic pump to obtain stable base line and equilibrated column before the work day begins.
9. Excellent reproducibility of retention time.
10. An injection volume variable from 0.1 to100 micro litres without any hardware modification.
11. The flexibility of data analysis.
12. Suitable to avoid any interference from impurity.
Initial conditions for the development 9
If HPLC is chosen for the separation, the next step is to classify the sample as regular or special. We define regular samples as typical mixtures of small molecules (<2000 Da), that can be separated using more or less standardized starting conditions. Regular samples can be further classified as neutral or ionic. If the sample is neutral, buffers or additives are generally not required in the mobile phase. Ionic samples require the addition of a buffer to the mobile phase. For basic or cationic sample , “less acidic” reversed phase columns are recommended and amine addition for the mobile phase is beneficial.
A good method of development strategies should require as many experimental runs as necessary to achieve the desired final result.
Nature of the sample:
Before the development, we need to review what is known about the sample. The goals of the separation should also be defined at this point. The chemical composition of the sample can provide valuable clues for the best choice of initial conditions and HPLC separation.
Important information concerning sample composition and properties.
1. Number of compounds present
2. Chemical structures (functionality) of compounds
3. Molecular weights of compounds
4. pka values of compounds
5. UV spectra of compounds
6. Concentration range of compounds in samples of interest
7. Samples solubility
Sample Pretreatment and Detection:
1. Solutions ready for injection
3. Solid that must first be dissolved or extracted
4. Samples that requires, sample pretreatment to remove interference and/or protect the column or equipment from damage.
Best results are often obtained when the composition of the simple solvent is close to that of the mobile phase, since this minimizes baseline upset and other problems. Some samples require a partial separation ( pretreatment ) prior to HPLC, because of the need to resolve interferences, concentrate sample analytes, or eliminate “column killers”. Before the first sample is injected during HPLC method development, we must be reasonably sure that the detector selected will sense all sample components of interest. For this various types of detectors are used.
The aim of sample preparation is that the sample aliquot should be (1) relatively free of interferences,(2) will not damage the column and (3) is compatible with intended HPLC method, that is sample solvent will dissolve in the mobile phase without affecting sample retention or resolution. A sample pretreatment procedure should provide quantitative recovery of analytes, involve a minimum number of steps and be easily automated. Quantitative recovery of each analyte enhances sensitivity and assay precision, although this does not mean that all the analyte present in the original sample must be included in the final injected sample. If recovery is less than 100% the sample pretreatment must be reproducible.
Derivatization:
Derivatization involves a chemical reaction between analyte and a reagent to change the chemical and physical properties of an analyte.
The four main uses of derivatization in HPLC are to
1. Improve detectability
2. Change the molecular structure or polarity of analyte for better chromatography
3. Change the matrix for better separations
Ideally, a derivatization reaction should be rapid, quantitative and produce minimal by products. Excess reagent should not interfere with the analysis or should be removed easily from the matrix.
HPLC INSTRUMENTATION 10,11
The general instrumentation for HPLC incorporates the following components
• There is a solvent reservoir for the mobile phase
• The mobile phase must be delivered to the column by some type of pump. The
pumping system must be pulse-free or else have pulse damper to avoid generating baseline instability in the detector.
• Sampling valves are used to inject the sample in the flowing mobile phase just at the
head of the separation column. Samples should be dissolved in a portion of the mobile phase to eliminate an unnecessary peak.
• A head of the separation column there may be a guard column or an in-line filter to
prevent contamination of the main column by small particulate.
• To measure column inlet pressure a pressure gauge is inserted in front of the
separation column.
• The separation column contains the packing needed to accomplish the desired HPLC
separation. These may be silica’s for adsorption chromatography, bonded phase for liquid-liquid chromatography, ion exchange functional groups bonded to the stationary support for ion exchange chromatography, gels of specific porosity for exclusion chromatography, or some other unique packing for a particular separation method
• A detector with some type of data handling device completes the basic
instrumentation.
Detectors:
The sensitivity of universal detector for HPLC has not been devised yet. Thus it is necessary to select a detector on the basis of the problem.
Buffers in Reversed-Phase Liquid Chromatography:
on retention of ionic analytes and checking some properties of the buffer options, a logical and reasonable choice can be derived. This selection may need to be revised by consideration of certain factors, such solubility or limitations of compatibility with the means of detection. Practical aspects of buffer preparation should also be observed for reproducible and trouble free operations.
The pH of the mobile phase will dramatically affect the retention of ionic analytes within
1.5 pH units if their PKa Thus, it can be understood why control of mobile phase pH has
great utility in method development and is critical for functional groups reproducible separations of ionic analytes. Obviously, if the analyte is not ionic mobile phase pH wont directly affect its retention.
Chromatographic parameters:
Resolution:
Chromatographers measure the quality of separation by resolution Rs of adjacent bands
Where tw1 and tw2 are obtained from the intersection of the tangents with the baseline. For
a symmetrical Gaussian peak the tangents are drawn at 0.6times the peak height.
Capacity factor:
It is the measure of how well the sample molecule is retained by the column during an isocratic separation. It is affected by solvent composition, separation aging and temperature of separation.
tr = Band separation time
t0 = column dead volume
Column efficiency:
It is called as number of theoretical plates. It measures the band spreading of a peak. When band spread is smaller, the number of theoretical plate is higher. It indicates a good column and system performance.
Column performance can be defined in terms of values of N
Where:
N = Number of theoretical plates
Ve = elution volume, retention time or retention distance (mL, sec, or cm)
h = peak height
wb = width of the peak at the base line (ml, sec, or cm)
Peak Asymmetry and Peak tailing:
Peak Asymmetry:
Peak with poor symmetry can result in
• Inaccurate plate number and resolution measurement
• Imprecise quantitation
• Degraded resolution and undetected minor bands in the peak tail
Where:
As = peak asymmetry factor
b = distance from the point at peak midpoint to the tailing edge (measured at 10% of peak height)
a = distance from the leading edge of peak to the midpoint (measured at 10% of peak height)
Peak tailing:
Where:
T = tailing factor (measured at 5% of peak height)
b = distance the point from at peak midpoint to the tailing edge a = distance from the leading edge of the peak to the midpoint
Increased peak asymmetry value, AS > 1.5 the sign that the column should be changed
Selectivity:
It measures relative retention of two components. Selectivity is the function of chromatographic surface ( column), melting point and temperature.
HPTLC METHOD DEVELOPMENT 12, 13
HPTLC- High Performance Thin Layer Chromatography is a sophisticated and automated form of TLC.
Main difference of HPTLC and TLC- Particle and pore size of sorbents. The other differences are:
Parameters HPTLC TLC
Layer of sorbent 100µm 250µm
Efficiency High due to smaller particle
size generated
Less
Separations 3-5cm 10-15cm
Analysis time Shorter migration distance
and the analysis time is greatly reduced
Slower
Solid support Wide choice of stationary
phases like silica gel for normal phase and C8, C18 for reversed phase modes
Silica gel, Alumina and Kiesulghur
Development chamber New type that require less
amount of mobile phase
More amount
Sample spotting Auto-sampler Manual spotting
Scanning Use Camag TLC scanner of
UV/Visible/Fluorescence scanner scans the entire chromatogram qualitatively and quantitatively and the scanner is an advanced type of densitometer
Features of HPTLC 14-16
1. Simultaneous processing of sample and standard-better analytical precision and accuracy less need for internal standard.
2. Several analysts work simultaneously
3. Lower analysis time and less cost per analysis
4. Low maintenance cost
5. Simple sample preparation- handle samples
6 .No prior treatment for solvents like filtration and degassing
7. Low mobile phase consumption per sample
8. No interference from previous analysis – fresh stationary and mobile phases for each analysis – no contamination
9. Visual detection possible open system
10. Non UV absorbing compounds detected by post- chromatographic derivatisation
Sample and standard preparation
Application of sample and standard
Chromatographic development
Detection of spots
Selection of chromatographic layer:
• Precoated plates – different support materials –different sorbents available
• 80% of analysis –silica gel GF . Basic substances, alkaloids and
steroids-aluminium oxide
• Amino acids, dipeptides, sugars and alkaloids-cellulose
• Non-polar substances, fatty acids, carotenoids, cholesterol-RP2,RP8 and
Preservatives, barbiturates, analgesic and phenothiazines- Hybrid plates-RPWF254s
Activation of pre-coated plates:
• Freshly open box of plates do not require activation
• Plates exposed to high humidity or kept on hand for long time to be activated
• By placing in an oven at 110-1200c for 30’ prior to spotting
• Aluminium sheets should be in between two glass plates and placing in an oven
at110-1200c for 15 minutes.
Application of sample and standard:
• Usual concentration range is 0.1µg/µl
• Above this causes poor separation
• Linomat IV(automatic applicator)-nitrogen gas sprays sample and standard from
syringe on TLC plates as bands
• Band wise application-better separation- high response to densitometer
• Selection of mobile phase
• Trial and error
• One’ own experience and literature
• Normal phase
• Stationary phase is polar
• Mobile phase is non polar
• Non –polar compounds eluted first because of lower affinity with stationary phase
• Polar compounds retained because of higher affinity with the stationary phase
• Reversed phase
• Stationary phase is non polar
• Polar compounds eluted first because of lower affinity with stationary phase
• Non-polar compounds retained because of higher affinity with the stationary phase
• 3-4 component mobile phase should be avoided
• Multi component mobile phase once used not recommended for further use and
solvent composition is expressed by volumes (v/v) and sum of volumes is usually100
• Twin trough chambers are used only 10-15 ml of mobile phase is required
• Components of mobile phase should be mixed introduced into the twin- trough
chamber
Pre conditioning (Chamber saturation ):
• Unsaturated chamber causes high Rf values
• Saturated chamber by lining with filter paper for 30 minutes prior to development –
uniform distribution of solvent vapours-less solvent for the sample to travel-lower Rf values.
Chromatographic development and drying:
After development, remove the plate and mobile is removed from the plate- to avoid contamination of lab atmosphere. Dry vacuum desiccator-avoid hair-drier-essential oil components may evaporate
Detection and visualization:
• Detection under UV light is first choice- non destructive
• Spots of fluorescent compounds can be seen at 254 nm (short wavelength) or at
366nm (long wavelength)
• Spots of non-fluorescent compounds can be seen-fluorescent stationary is used-silica
gel GF
• Non UV absorbing compounds ilike ethambutol, dicyclomine etc –dipping the plates
in 0.1% iodine solution
• When individual compound does not respond to UV –derivetisation required for
Quantification:
• Sample and standard should be chromatographed on same plate- after development
chromatogram is scanned
• Camag TLC scanner III scan the chromatogram in reflectance or in transmittance
mode by absorbance or by fluorescent mode-scanning speed is selectable upto 100mm/s-spectra recording is fast-36 tracks with upto 100 peak windows can be evaluated
• Calibration of single and multiple levels with linear or non linear regressions are
possible. When target values are to be verified such as stability testing and dissolution profile single level calibration is suitable
• Statistics such as RSD or CI report automatically
• Concentration of analyte in the sample is calculated by considering the sample
initially taken and dilution factors
Documentation:
• E-Merck introduced plates with imprinted identification code- supplier name. Item
number, batch number and individual plate number-Avoid manipulation of data at any stage –coding automatically get recorded during photo documentation
METHOD VALIDATION AND ITS TYPE17
Validation is a documented program that provides a high degree of assurance that a facility or operation will consistenly produce product meeting a predetermined specifications.
Why Validate?
Economical reasons:
• Rapid and reliable up
• Robust process
• Reduction in rejections/rework/recalls
• Reduce testing
• Rapid introduction
• To increase the productivity
• To reduce product cost
Method Validation18-20
According to method, validation can be defined as “Establishing documented evidence which provides a high degree of assurance that a specific activity will consistently produce a desired result or product meeting its pre determined specification and quality characteristics.
Method validation is an integral part of the method development; it is the process of demonstrating that analytical procedures are suitable for their intended use and that they support the identity, quality, purity and potency of the drug substances and drug products. Simply, method validation is the process of proving that an analytical method is acceptable for its intended purpose.
Method validation, however, is generally a one –time process performed after the method has been developed to demonstrate that the method is scientifically sound and that it serves the intended analytical purpose.
All the variables of the method should be considered, including sampling procedure, sample preparation, chromatographic separation, and detection and data evaluation. For chromatographic methods used in analytical applications there is more consistency in validation practice with key analytical parameters including
Selectivity:
Ability of the developed analytical method to detect analyte quantitatively in the presence of other components, which are expected to be present in the sample matrix or other related substances. Results are expressed as resolution. If the expected impurities or related substances are available, they should be analyzed along with the analyte or sample to check the system suitability, retention factor, tailing factor and resolution etc.
Linearity:
Range:
It is interval between the upper and lower levels of analyte, which is studied. The range is normally expressed in the same units as the test results obtained by the analytical method. The ICH guidelines specify a minimum of five concentration levels.
Precision:
It is a measure of degree or repeatability of an analytical method under normal operation and it is normally expressed as % of relative standard deviation (% RSD).
% RSD = 100S/X
Where, S= Standard deviation, X = Mean
It is determined at three levels.
Repeatability:
It is obtained when analysis is carried out in one laboratory by one operator using one piece of equipment over relatively short time span at least 5 or 6 determinations of three different matrices at 2 or 3 different concentrations.
Intermediate Precision:
It is determined by comparing the results of a method run within a single laboratory over a number of weeks. A method intermediate precision may reflect discrepancies in results obtained by different operators, from different instruments, with standards and reagents from different suppliers, with column of different batches.
Reproducibility:
Accuracy:
It is the measure of how close the experimental value to the true value. Accuracy studies, for drug substance and drug product are recommended to be performed at 50%, 100%, and 150% levels of label claim. Three replicates of each concentration should be there and the mean is an estimate of accuracy.
Limit of Detection (LOD):
It is defined as the lowest concentration of an analyte in a sample that can be detected but not quantified. LOD is expressed as a concentration at a specified signal to noise ratio. In chromatography detection limit is injected amount that result in a peak with a height atleast twice or thrice as high as baseline noise level. S/N 2/1 or 3/1.
Limit of quantification (LOQ ):
It is defined as lowest concentration of analyte in asample that can be determined with acceptable precision and accuracy under stated operational conditions of the method. LOQ is expressed as a concentration at aspecified signal to noise ratio. In chromatography detection limit is the injected amount that results in a peak with height ten times as high as base line noise level.
S/N = 10/1
Specificity:
Specificity is the ability to measure accurately and specifically the analyte of interest in the presence of other components that may be expected to be present in the sample matrix. It is a measure of a degree of interference from such things as other active ingredients, excipients, impurities, and degradation products, ensuring that a peak responses due to a single component only. i.e. that no co- elutions exist. Specificity is measured and documented in a separation by the resolution, plate count (efficiency), and tailing factor.
Ruggedness:
address ruggedness specifically. However, as ICH chose instead to cover the topic of ruggedness as part of precision, as discussed previously.
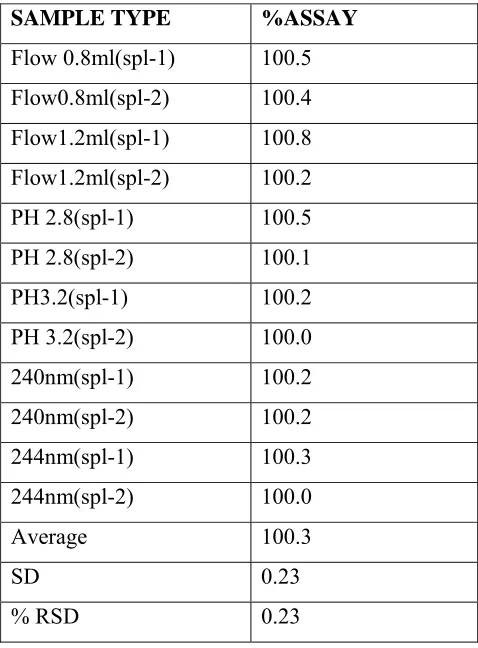
Robustness:
Robustness is the capacity of a method to remain unaffected by small deliberate variation in method parameters. The robustness of a method is evaluated by varying method parameters such as percent organic,pH, ionic strength, temperature etc;and determining the effect (if any) on the results of the method.As documented in the ICH guidelines, robustness should be considered early in the development of a method. In addition, if the results of a method or other measurements are susceptible to variations in method parameters, these parameters should be adequately controlled and a precautionary statement included in the method documentation.
System suitability testing:
System suitability tests are an integral part of chromatographic methods. These tests are used to verify that the resolution and reproducibility of the system are adequate for the analysis to be performed. System suitability tests are based on the concept that the equipment, electronics, analytical operations, and samples constitute an integral system that can be evaluated as a whole. System suitability is the checking of a system to ensure system performance before or during the analysis of unknowns. Parameters such as plate count, tailing factors, resolution and reproducibility (%RSD retention time and area for six repetitions) are determined and compared against the specifications set for the method.
LITERATURE REVIEW
Suddhasattya Dey et al21 develop HPLC method for the estimation of carvedilol in bulk and
pharmaceutical dosage form. The specification of the chromatographic system, column
4.6mm×25cm, 5 micron, with mobile phase containing phosphate buffer: acetonitrile, PH 2,
wavelength 240nm, flow rate 1ml/min and the oven temperature 55⁰C. Retention time was
6.63. A linear response was observed between the concentration rangeof 806-1202µg/ml with a regression co-efficient of 0.99.
Navaneet Verma et al22 reported a procedure for simultaneous estimation of carvedilol in its
dosage form. The UV absorbance maxima of the drug at 285 nm. The drug obeyed Beer’s
law in the concentration range of 4-36µg/ml with molar absorptivity of 12.6 ×10³ l/mol. Cm
in methanol.
Satish A Patel et al23 developed UV spectrophotometric method for the determination of
carvedilol in tablet formulation. Simple UV spectrophotometric method is based on determination of carvedilol in 0.1 N HCL at 241.2 nm. Linearity was obtained in the concentration range of 1- 12µg/ml.
M. Imran et al24 developed a new and rapid stability indicating ultraviolet spectroscopic
methods for the estimation of ezetimibe and carvedilol in pure form and in their respective
formulations. The linearity range for ezetimibe and carvedilol obtained as 50µg/ml and 2-20µg/ml respectively.
Ivan Savic et al25 developed a method to select an appropriate packaging and analysis of its
influence on stability of tablets containing carvedilol. After radiation the content was estimated using a validated hplc – method. Retention time was 4.5 detected at 240 nm.
T.E.G.K Murthy et al26 reported a development of scriminatory method for dissolution of
carvedilol marketed formulations .In the study four dissolution media with different agitation speeds were employed. An agitation speed of 100 rpm showed more drug release profile than 50 and 75 rpm.
Ramesh Gannu et al27 developed a HPLC analytical method for carvedilol in human serum.
eluted through a C8 kromasil KR 100 5C8 column . Retention time of carvedilol was 6.10 min.
L. J Patel et al28 developed reverse phase high performance liquid chromatography and high
performance thin layer chromatography for estimation of carvedilol in bulk drug and
pharmaceutical formulations. For HPLC method Lichrospher 100-c18(200×4.6mm), 5µ
column, isocratic mode, with mobile phase containing 50M potassium di hydrogen phosphate buffer: actonitrile : methanol ( 60:50:10) was used. The retention time was 4.56 .The linearity lies over 1-35µg/ml for HPLC. For HPTLC a CAMAG HPTLC system comprising of Linomat v automatic sample applicator , Hamilton syringe, Camag TLC scanner-3Camag
Win CAT software with stationary phase precoated silica gel 60F254 and mobile phase
consisting of ethyl acetate: toluene: methanol. The detection of spot carried out at 242 nm.
The Rf value was 0.65. The linearity lies over 50 – 300 ng/spot for HPTLC.
CH. Ajay. Babu29 developed a high performance liquid chromatography method for the
determination of the carvedilol in human plasma. The method utilizes the liquid-liquid extraction with n-hexane ethyl acetate (3:1v/v). Samples were analysed by using phenomine
Gemini C18 column with UV detection at 241nm.
Laila Ei Sayed Abdel Fattah et al30 reported a spectrofluorimetric determination of
carvedilol in dosage form and spiked human plasma through derivatization with 1-dimethylamino-naphthalene-5-sulphonyl chloride. The fluorescence concentration plot was rectilinear over the range of 5.0-8.0ng/ml with a lower detection limit of 1.90ng/ml.
Olga Galanopoulou et al31 reported HPLC analysis, isolation and identification of a new
degradation product in carvedilol tablets. The separation was achieved with an X-terra C18
column using acetonitrile - phosphate buffer pH2.5 as mobile phase.
Sarath Chandiran et al32 reported a simultaneous quantification of carvedilol and its
metabolite in human plasma by using High-throughput liquid chromatography - tandem mass spectrometric method .The method was linear over a concentration range of 0.1 to 250 ng/ml with a limit of quantification of 0.1ng/ml.
R. K. Jat et al33 developed a sensitive and rapid extractive spectrophotometer method for the
.
F. Behn et al34 developed high performance liquid chromatography for the
determination of the β receptor blocker .Carvedilol in small volumes of the plasma
from paediatric patients. Analysis of the extracts was performed on a spherisorb C6
column with a mobile phase of 65% acetonitrile and 35% potassium acetate buffer and fluorescence detection. Carvedilol and internal standard showed recoveries of 87.0% and 97.7 % respectively.
J.Stojanovic et al35 developed a reverse phase high performance liquid
DRUG PROFILE: 36, 37
CARVEDIOL
INTRODUCTION:
Carvedilol tablets are indicated for the treatment of mild to severe chronic heart failure of ischemic or cardio myopathic origin .usually in addition to diuretics ACE inhibitors and digitalis . They can be used alone or in combination with other antihypertensive agents especially thiazide type diuretics should not be given to patients with severe hepatic
impairment .It is a non selective β-adrenergic blocking agent with α-1 blocking activity
.Carvedilol has much greater antioxidant activity than other commonly used β blockers
.Tablet containing inactive ingredients as colloidal silicon dioxide, crospovidone, hypromellose, lactose monohydrate, magnesium stearate, polyethylene glycol, polysorbate, povidone, and titanium dioxide.
CHEMICAL STRUCTURE:
CHEMICAL NAME :
( ±)-[3-(9H-carbazol-4-yloxy)-2 hydroxy propyl ] [2-(2-methoxy phenoxy) ethyl] amine.
MOLECULAR FORMULA:
C24H26N2O4
MOLECULAR WEIGHT:
406.5
CHARECTERESTICS:
SOLUBILITY:
Insoluble in water, sparingly soluble in 95% ethanol and isopropanol, slightly soluble in ethyl ether soluble in methanol, methylene chloride, freely soluble in dimethyl sulfoxide.
MECHANISM OF ACTION:
Carvedilol is a racemic mixture in which non-selective β- adreno receptor blocking activity is
present in the S(-) enantiomers and α1 adrenergic blocking activity is present in both R(+) and
S(-) enantiomers at equal potency. Carvedilol has no intrinsic sympathomimetic activity.
PHARMACOKINETICS:
Bioavailability : 25-35 %
Protein binding : 98%
Metabolism : Hepatic.
Half life : 7-10 hrs
Excretion : Renal 16%, Faecal 60%.
THERAPEUTIC USES:
• Antihypertensive agents.
• Adrenergic β- antagonist.
• Adrenergic α-antagonist.
• Vasodilator agents.
DOSAGE:
Patients weighing < 85 kg (187 lb) - 25mg twice daily.
Patient weighing > 85kg (187lb) -50mg twice daily.
HOW TO USE:
of orthostatic effects .Patient should be observed in the office for one hour after initial dose is given.
STORAGE:
Store in a close, cool and light resistant container.
BRAND NAMES:
Cardivas, Coreg, Carvil, Karvileks.
AIM AND OBJECTIVE
The literature review reveals that several works have been carried out for the
quantification of Carvedilol either individually or combination with other drugs and for the
analysis of Carvedilol in biological fluids; including HPLC, Capillary electrophoresis,
flourimetry, chemiluminescence, dissolution test. In these some methods are only for the
estimation of drugs from biological fluids.
The present study describes the development of a new rapid, simple, sensitive and
reproducible RP-HPLC, HPTLC, UV Spectrophotometry method for the analysis of
Carvedilol that offer certain advantages in its simplicity and sensitivity and applicable in
routine analysis. It also describes the development of validation work as per ICH guidelines
PLAN OF WORK
Aimed to develop analytical method and validation for Carvedilol in a tablet dosage form.
The plan of the proposed work includes the following steps.
¾ The extensive survey of literature for Carvedilol regarding their characteristics and
analytical methods. This forms the basis for the development of methods.
¾ To undertake solubility studies for the analyte Carvedilol.
¾ Selection of suitable solvent for quantitative extraction of analyte present in the
formulations.
¾ Selection of suitable stationary phase and mobile phase.
¾ Selection of detection of wavelength.
¾ Develop initial conditions for HPLC, HPTLC,UV, methods.
¾ Optimization of the HPLC, HPTLC, UV, methods.
¾ Analytical method validation of the developed HPLC, HPTLC, and UV methods as
LIST OF INSTRUMENTS USED
S.NO INSTRUMENT
1 SHIMADZU UV-1700
spectrophotometer
2. SHIMADZU HPLC with UV detector
3 YMC pack pro C18 column (100 × 4.6mm, 5µ)
4 CAMAG HPTLC instrument
5 CAMAG TLC SCANNER 3
6 CAMAG LINNOMATE V AUTOMAIC SAMPLE
APPLICATOR
7 Twin-trough chamber (10 × 10 cm)
8 Ultra Sonicator
9. Electronic balance (2mg-200gm) (Sartorius)
LIST OF CHEMICALS AND SOLVENTS
S.NO CHEMICALS AND SOLVENTS MANUFACTURER
1. Carvedilol working standard USP standards
2. Acetonitrile (HPLC grade) Rankem
3. Methanol (HPLC grade) Fischer scientific
4.
Potassium di hydrogen phosphate
Merck
5.
Formic acid
Merck
6.
Milli - Q/HPLC water
Merck
7 Toluene
Merck
METHOD DEVELOPMENT FOR ASSAY OF CARVEDILOL TABLETS BY RP-HPLC METHOD
Selection of chromatographic method:
Proper selection of chromatographic method depends on the nature of the drug, molecular weight, and solubility. Since carvedilol is polar in nature, reverse phase chromatography has been used.
Selection of mobile phase:
Various mobile phases were tried in different ratios for selection of mobile phase. The drug carvedilol was injected with different mobile phase at different ratios with different flow rates till a sharp peak without any interference peak containing spectrum was obtained. The different mobile phase were containing either one or the combinations of two or three of following solvents, acetonitrile, water, methanol, tetrahydrofuran.
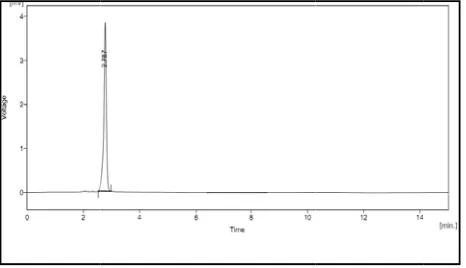
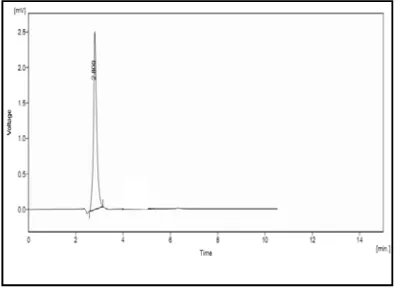
Tried at different ratios no favourable results obtained. But the mobile phase containing potassium di hydrogen phosphate buffer : acetonitrile in the ratio 60:40 gave acceptable peak with retention time 2.97 min.
Separation using acetonitrile and water
A mobile phase consisting acetonitrile and water at different ratios were tried to achieve the separation. But it was found that carvedilol peak was merging.
Separation using methanol and water
Next trial was done by using mobile phase consisting methanol and water. Although different ratios were tried tailing of the peak occurred.
Separation using tetrahydrofuran, acetonitrile and water
Tetrahydrofuran, acetonitrile, water composition as mobile phase were tried at different ratios peak shape was not found to be good.
Separation using potassium di hydrogen phosphate buffer and acetonitrile.
get good symmetrical peaks, this mobile phase system was selected for further study. Fig 2(1) – 2(4).
METHOD OPTIMIZATION
INITIAL CHROMATOGRAPHIC CONDITION
Column - YMC pack pro C18 (100×4.6mm)5µm
Column temperature - Ambient
Flow rate - 1ml/min
Pump mode - Isocratic
Injection volume - 10µl
Run time - 8 min
PH - 3
Mobile phase - Phosphate Buffer : ACN
Effect of ratio of mobile phase
After confirming the mobile phase, change in the ratio of mobile phase was done for the optimization of the peak. The ratio of 50: 50, 70: 30, 65: 35 were tried fig 2(5)- 2(7).
In that case 60:40 v/v shows good retention time and resolution. The peak shown in figure 2(11).
Effect of flow rate
After confirming the ratio of mobile phase, flow rate of the mobile phase was changed, at 0.8ml/min it shows increased retention time the flow rate of 1.2ml/min resulted in fronting of the peak. It shows fig 2(8)- 2(9). The flow rate of 1ml/min has given a good result. It is shown in fig. 2(11).
Selection of column
The literature review showed the usage of C18 column for the determination of carvedilol.
C18 column. The column with different dimensions were tried but that showing shifting of
retention time. It shows fig 2(10). YMC pack pro C18 (100 × 4.6mm, 5µ) column shows
good result. Fig 2(11).
Selection of detector wavelength
The sensitivity of the HPLC method that uses UV detector depends upon the proper selection of wavelength. An ideal wavelength is one that gives maximum absorbance and good response for the drug to be detected.
UV detector as the most popular as they can be detect a broad range of compounds and have a fair degree of selectivity for some analytes and is useful for many HPLC applications. For the detection, the analyte chemical structure should consist suitable chromophore such as aromatic ring and the solvent using should be UV grade or non UV absorbing solvents.
A UV spectrum of carvedilol was recorded. From this spectrum λmax at 242 nm was
selected for the proposed study.
Figure1(1) acetonitrile: water.
Figure 1(2) methanol:water
FFigure 1(3)
Fi
Figure 1(
tetrahydro
igure 1(4) b
(5) buffer: a
ofuran: acet
uffer: aceto
acetonitrile
onitrile: wa
onitrile
at 50:50 rat ater
[image:50.612.191.424.97.231.2]Figure 1(6) buffer: acetonitrile at 70:30 ratio.
Figure 1(7) buffer :acetonitrile at 65:35 ratio.
Figure 1(8) flow rate 0.8ml.
[image:51.612.207.407.97.241.2] [image:51.612.187.424.316.490.2]Figure 1(9) shows flow rate 1.2 ml.
Figure 1(10) shows column C18 (250× 4.6 mm)
[image:52.612.188.423.108.250.2]ASSAY BY HPLC
Reagents Grade
Potassium di hydrogen phosphate AR
Formic acid AR
Acetonitrile HPLC
Water HPLC/MILLI-Q
Chromatographic conditions
Column : YMC pack pro c18(100×4.6mm,5µ)
Column temperature : Ambient
Flow rate : 1.0ml/min
Wavelength : 242nm
Injection volume : 10µl
Run time : 8min
PH : 3
Mobile phase : Phosphate Buffer : ACN (60 : 40 )
SOLUTION PREPARATIONS :
PREPARATION OF BUFFER SOLUTION:
Dissolve about 6.80g of potassium di hydrogen phosphate in1000 ml of HPLC/ Milli – Q
water.
Adjusts the pH to 3.0 ± 0.05 with formic acid.
PREPARATION OF MOBILE PHASE:
Prepare a mixture of buffer and acetonitrile in the ratio of 60:40 Filter through 0.45µ
PREPARATION OF STANDARD SOLUTION:
Weigh accurately about 62.5mg of carvedilol reference /working standard in to a 100ml
Volumetric flask, add 30ml of methanol sonicate to dissolve . Then make up to the volume
With methanol . Pipette out 10ml of this solution into a100ml volumetric flask and
dilute up to the mark with mobile phase. Filter through 0.45µ membrane filter.
Prepare the standard solution in duplicate calculate the similarity factor for standard-I and
Standard -II solutions by using the following formula.
Area of standard solution-1 × weight of STD ( in mg) solution-2
Area of standard solution-2 (1st injection) weight of STD (in mg) solution-1
Note: similarity factor for both the standard solutions should be between 0.98 to 1.02
PREPARATION OF SAMPLE SOLUTIONS:
For 25 mg tablets:
Weigh and transfer 5 tablets into a100ml volumetric flask. Add 50ml of methanol and
sonicate to dissolve then make up to the volume with methanol, pipette out 5ml of this
solution into a 100ml volumetric flask and dilute up to the mark with mobile phase. Filter
through 0.45µ membrane filter.
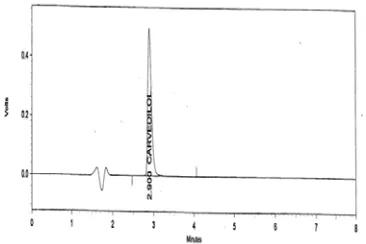
PROCEDURE:
Inject 10µl portions of blank, standard solution and sample solutions into the
chromatograph and record the chromatograms. Record the peak responses for the major
peaks.
TABLE 1.1 INJECTION SEQUENCE:
Name of Drug Retention
Time
Area Theoretical Plate Tailing Factor
Carvedilol 2.96 4121905 5350.4 1.40
S.NO DESCRIPTION NUMBER OF
INJECTION
1 Blank 1
2 Std solution-1 1
3 Std solution-II 1
4 Std solution-II 4
5 Sample solution 2
EVALUATION OF SYSTEM SUITABILITY:
1. The relative standard deviation for five replicate injections should not be more than 2.0%
2. Tailing factor for carvedilol peak should be not more than 2.5
3. Theoretical plate for carvedilol peak should be not less than 1500
VALIDATION PROGRAMME FOR ASSAY
TABLE 1.2 VALIDATION PARAMETERS
S.NO PARAMETERS
1 System suitability
2 Specificity
3 Accuracy/Recovery
4 Linearity/and range
5 Precision
a) Repeatability
b) Intermediate precision
c) System precision
d) Method precision
6 Robustness
7 Solution stability
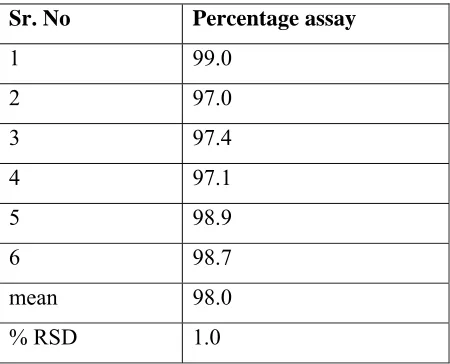
SYSTEM SUITABILITY:
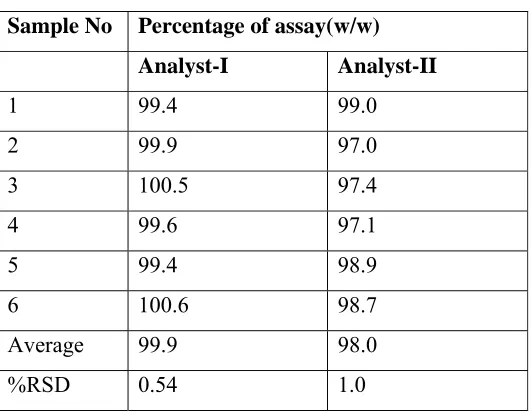
Five replicate injections of the standard solutions were injected the percentage RSD for the peak area and tailing factor for carvedilol were calculated.
ACCEPTANCE CRITERIA:
a) % RSD for standard injections should be not more than 2.0%
b) Tailing factor for carvedilol peak should be not more than 2
TABLE 1.3 SYSTEM SUITABILITY
RESULT:
a) % RSD for standard injections is 0.23%
b) Tailing factor for carvedilol peak is 1.5
SPECIFICITY:
Blank, placebo, standard, sample solution injected into HPLC system. There was no interference from the blank and placebo at the retention time of carvedilol peak. Peak purity reveals that carvedilol peak was homogeneous and there were no co-eluting peaks at the retention time of carvedilol peak.
PLACEBO PREPARATION:
Weighed and transferred 1.812 gm of placebo into 100ml volumetric flask, 50 ml of methanol added and sonicated to dissolve. Then made up to the volume with methanol. Pipette out 5 ml of this solution into a 100 ml volumetric flask and diluted up to the mark with mobile phase. Filtered through 0.45µ membrane filter and injected into the chromatogram.
No of injection Area Tailing factor
1 4121144 1.514
2 4111957 1.521
3 4112953 1.520
4 4135077 1.525
5 4118577 1.516
ACCEPTANCE CRITERIA:
i) All individual peaks should be well separated.
ii) The interference of carvedilol peak from the other peaks should be nil.
iii) The purity of carvedilol peak should be NLT 0.99.
RESULT:
i. All individual peaks are well separated.
ii. The interference of carvedilol peak from the other peaks is nil.
iii. The purity of carvedilol peak is 0.99.
ACCURACY/RECOVERY:
Known amount of carvedilol spiked with placebo at about 80%,100%, and 120%of working concentration in triplicate and analysed as per testing procedure .The percentage recovery was calculated from the amount found and actual amount added.
Figure1(12 ) accuracy at 80%
Figure1( 13 ) accuracy at 100%.
Figure 1 (14 ) shows accuracy at 120%.
TABLE 1.4 ACCURACY.
LEVEL Amount
found in µg
Actual
amount
added in µg
%recovery Mean %RSD
Level-1 80% 19.80 19.80 19.78 19.72 19.72 19.72 100.4 100.4 100.3
100.4 0.07
Level-2 100% 24.71 24.69 24.70 24.64 24.64 24.64 100.3 100.2 100.2
100.2 0.07
Level-3 120% 29.76 29.77 29.81 29.58 29.58 29.58 100.6 100.6 100.8
101.7 0.12
ACCEPTANCE CRITERIA:
a) The % recovery should be in between 95% and 105%.
[image:59.612.91.525.301.604.2]RESULT:
a) The % recovery is in between 98.1% and102.7%.
b) The % RSD for all recovery values is 0.64%.
CONCLUSION:
The analytical method meets the acceptance criteria for accuracy study. Hence the method is accurate for the determination of assay of carvedilol tablets.
LINEARITY AND RANGE
The linearity of an analytical procedure is its ability ( within a given range )to obtain test
results which are directly proportional to the concentration ( amount ) of analyte in the sample.
The range of the analytical procedure is the interval between the upper and lower
concentration ( amount ) of analyte in the sample ( including the concentrations). For which it has been demonstrated that the analytical procedure has a suitable level of precision,
accuracy, and linearity.
PROCEDURE:
PREPARATION OF STANDARD STOCK SOLUTION:
Weigh accurately and transfer about 62.52 mg of carvedilol into a 100 ml volumetric flask. 50 ml methanol added and sonicated to dissolve, then make upto the volume with methanol. Pipette out 10 ml of this solution into a 100 ml volumetric flask and diluted upto the mark with mobile phase. Filtered through 0.45µ membrane filter.
PREPARATION OF SAMPLE SOLUTION:
Inject 10µl of blank solution and each linearity level standard solutions into the chromatographic system and measure the peak area .
The linearity of carvedilol was performed in the range of 15.62µg/ml to 93.75µg/ml (25% - 150 % of working concentration ). A graph was plotted with concentration in µg/ml on x axis and peak area on y axis. Slope, y intercept, correlation coefficient ( r value ), were determined.
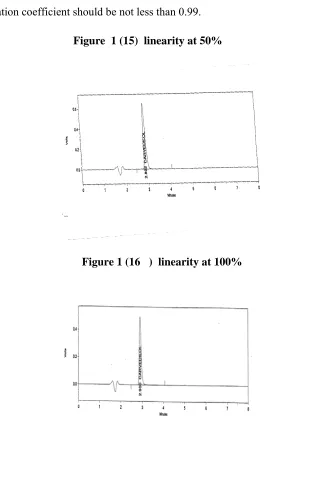
ACCEPTANCE CRITERIA:
The correlation coefficient should be not less than 0.99.
Figure 1 (15) linearity at 50%
Figure 1 (16 ) linearity at 100%
[image:61.612.144.468