AS
UR
EXC
SOCIA
RINAR
CRETI
Di
M
DR. M
ATION
RY SO
ION A
issertat
MD Deg
Gene
AP
THE T
M.G.R.ME
CH
N BETW
ODIUM
AND BL
tion sub
gree (B
eral Me
PRIL – 2
TAMIL
EDICAL
HENNA
WEEN
M & PO
LOOD
bmitted
Branch-edicine
2013
NADU
L UNIVE
AI
N 24 HO
CERTIFICATE
This is to certify that this dissertation titled “ASSOCIATION
BETWEEN 24 HOURS URINARY SODIUM & POTASSIUM
EXCRETION AND BLOOD PRESSURE” submitted by DR.
C.INDUMATHI
to the faculty of General Medicine, The Tamil
Nadu Dr.M.G.R. Medical University, Chennai in partial fulfillment
of the requirement for the award of MD degree Branch I (General
Medicine) is a bonafide research work carried out by her under our
direct supervision and guidance.
Dr.G.Bagialakshmi MD.,
Dr. Moses K Daniel, MD.,
Associate Professor
Professor and HOD
Department of Medicine Department of Medicine
Madurai Medical College Madurai Medical college
DECLARATION
I,
Dr. DR. C.INDUMATHI, solemnly declare that the
dissertation titled ‘ASSOCIATION BETWEEN 24 HOURS
URINARY SODIUM & POTASSIUM EXCRETION AND
BLOOD PRESSURE’ has been prepared by me.
This is submitted to the Tamil Nadu Dr.M.G.R. Medical
University, Chennai in partial fulfillment of the requirement for the
award of MD degree Branch I (General Medicine).
Place:
ACKNOWLEDGEMENT
I am grateful to the Dean, Madurai Medical College and
Govt.Rajaji Hospital, Madurai for permitting me to utilize the clinical
materials of this hospital.
I am extremely grateful to Dr.Moses K Daniel MD., Professor and
Head of the Department of Medicine, Madurai Medical College, Madurai,
for his guidance and help for executing my study.
I am extremely indebted to my beloved guide Dr.G.Bagialakshmi
MD., associate professor of Medicine, Madurai Medical College,
Madurai for her constant encouragement and guidance throughout this
dissertation.
My sincere thanks to the professor and Head, Department of
Nephrology, Dr. K.Shanmugaperumal MD DM., for allowing me
to utilize the clinical material and for his valuable support and
guidance.
I am grateful to Dr.S.Peer Mohamed MD ., Assistant Professor
of Medicine for his valuable guidance, support and encouragement
I am grateful to Dr.K.Premkumar MD., Assistant Professor of
Medicine for his valuable guidance, support and encouragement rendered
to me during the study.
I would grossly fail in my duty if I fail to mention here of my
patients who have ungrudgingly borne the pain and discomfort of
investigations.
I thank my study subjects, who formed the back bone of this study
and without whom this work would not have been possible.
My family and friends have stood by me during my times of
need. Their help and support have been valuable to the study.
Last but not the least, I thank “God the Almighty”, for being my
CONTENTS
PART - I
1.INTRODUCTION...1
2.DEFINITION & CLASSIFICATION...2
3.EPIDEMIOLOGY...3
4.NATURAL HISTORY OF HYPERTENSION...5
5.RISK FACTORS FOR HYPERTENSION...6
6.DETERMINANTS OF BLOOD PRESSURE...16
7.PHYSIOLOGY OF BLOOD PRESSURE HOMEOSTASIS...20
8.PATHOPHYSIOLOGY OF HYPERTENSION...28
PART - II
9.REVIEW OF LITERATURE...4510.AIMS AND OBJECTIVES...49
11.MATERIALS AND METHODS...50
12.RESULTS AND OBSERVATION...55
13.DISCUSSION...73
14.SUMMARY...78
15.CONCLUSION...79
ANNEXURES
1.BIBLIOGRAPHY
2.ABBREVIATIONS
INTRODUCTION
Hypertension is a very common disorder especially past middle
age. It is not a disease in itself, but is an important risk factor for
coronary, cerebral, renal and peripheral vascular disease. (1) Of all
hypertensive patients, majority of cases are of essential hypertension
which accounts for about 90% of total hypertensive population. (2)
Risk factors for hypertension incidence include genetic
predisposition, age, sex, BMI, smoking, alcoholism and lifestyle factors.
Among lifestyle factors, high dietary sodium and low potassium intakes
were found to be associated with blood pressure in many studies. (3) (4)
The large Intersalt study showed that high sodium intake was
directly related to blood pressure while low potassium intake was
inversely and independently related to the same. (3)A positive correlation
was observed between urinary Na+/K+molar ratio and blood pressure. (5)
Guyton states that increased blood pressure is required to maintain
renal sodium excretion and sodium balance in essential hypertension. (6)
Our present study was based on Guyton’s hypothesis and aimed at
studying the association between 24 hour urinary sodium and potassium
DEFINITION &CLASSIFICATION
DEFINITION
Hypertension is arbitrarily defined as sustained systolic blood
pressure of 140 mmHg or greater and a diastolic BP of 90 mmHg or
greater or by virtue of the patient taking antihypertensive medications. (7)
CLASSIFICATION
Classification of Blood pressure (7) for adults aged 18 years or older
Category Systolic BP (mmHg) Diastolic BP(mmHg)
Normal <120 and <80
Prehypertension 120 - 139 or 80 - 89
Stage 1 hypertension 140 - 159 or 90 - 99
Stage 2 hypertension ≥ 160 or ≥100
This classification should be based on the mean of two or more
blood pressure readings at each of two or more visits after the initial
screening.
When systolic BP and diastolic BP fall into different categories,the
EPIDEMIOLOGY
Hypertension is present globally but its prevalence varies among
different countries and sub populations.Worldwide more than one billion
individuals have hypertension.
Data from the National Health and Nutrition Examination Survey
(NHANES 1999 to 2000) showed that approximately 31.3% of adult
population in United States has hypertension.
In the Indian subcontinent, there are no well co-ordinated national
surveys for prevalence of hypertension. Several regional small surveys
have been conducted which showed a higher prevalence in urban
population.
Many hypertensive patients have a positive family history of
hypertension. In most instances, the mode of inheritance is complex and
polygenic. Black men and women have a twofold higher prevalence of
hypertension (30%) than white men and women (15%).
According to the data from NHANES, the prevalence of
hypertension increases sharply with advancing age and high BMI. The
mean levels of systolic BP and diastolic BP were also found to increase
Various epidemiological studies have shown that the dietary intake
of salt correlates with the average BP in a population. An international
epidemiological study, INTERSALT, showed a significant correlation
between dietary sodium intake and median systolic BP and diastolic BP.
Some epidemiological studies have shown that low calcium and
potassium intake may also lead to hypertension. Blood pressure is
strongly related to urinary sodium and potassium molar ratio than either
sodium or potassium alone.
Data derived from the Framingham study have shown that
hypertensive patients have a fourfold increase in cerebrovascular
accidents , as well as a sixfold increase in congestive heart failure when
compared to normotensive subjects.
Higher the levels of systolic BP and diastolic BP, higher the
disease associated morbidity and mortality which includes atherosclerotic
cardiovascular disease, stroke, heart failure and renal insufficiency.
Cardiovascular and cerebrovascular mortality rates have
substantially decreased in the past three decades owing to aggressive
treatment of hypertension. Similar results can be achieved by long term,
population wide, reduction of salt intake which reduces the prevalence of
NATURAL HISTORY OF HYPERTENSION
Perera et al43 in 1950s observed 500 untreated hypertensive
patients, 150 from before the onset of their hypertension until their death
and another 350 from the uncomplicated phase until their death.
The mean survival of these patients after discovery of their
hypertension was 20 years. The severity of the casually obtained BP had
little prognostic value. Some patients with systolic blood pressure above
200mmHg survived for more than 35 years without any treatment.
The disease process included an uncomplicated phase lasting for
about 15 years followed by a complicated phase. In the complicated
phase, organ complications, largely arteriolosclerotic and atherosclerotic
became apparent.
Of these complications,74% were cardiac ,42% were renal and
32% were retinal. More than half the subjects died of heart disease
(principally congestive cardiac failure), 10% to 15% died of cerebral
accidents , and about 10% died of renal failure.
Malignant hypertension occurred in fewer than 5% of these
RISK FACTORS FOR HYPERTENSION
Hypertension is a multisystem disorder with involvement of
cardiovascular, neuroendocrine and renal systems with a strong genetic
component.
Blood pressure is influenced by a number of environmental ,
genetic and lifestyle factors as shown below:
NON-MODIFIABLE RISK FACTORS
1.ROLE OF GENETICS :
“Inherited BP” refers to the variations in BP which are determined
genetically. 20% to 60% of essential hypertension is inherited while the
remaining is acquired or environmental.
Various environmental and lifestyle factors have an influence on
inherited BP.These include excessive salt intake, weight gain and heavy
alcohol intake. These factors increase the blood pressure above the
inherited BP and lead to hypertension.
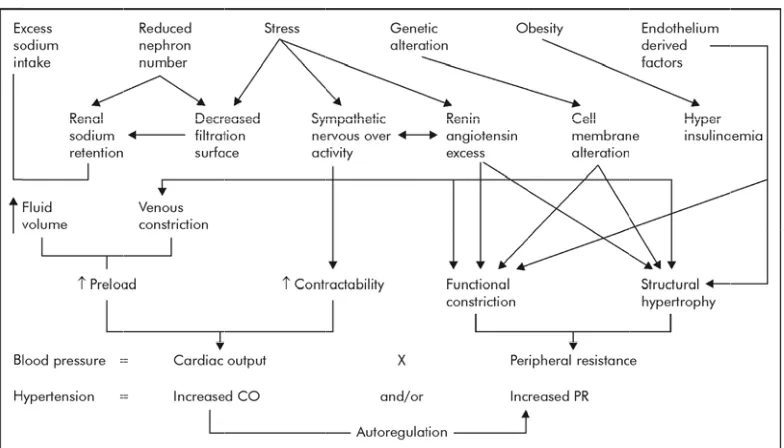
The interactions between genetics and environmental factors
influence sympathetic overactivity, RAAS, RKKS and endothelial factors
contractility. These finally determine cardiac output and peripheral
vascular resistance and consequently blood pressure. Since many
intermediary phenotypes are included in this complex mechanism, many
genes participate in the development of hypertension.
Apart from this, genetic factors also play a role in the behavioural
pattern of individuals which elevates blood pressure. So, it is difficult to
assess the proportion of blood pressure variability due to inheritance and
this varies in different populations.
Mutations in the genes raise or lower blood pressure by altering
salt and water reabsorption by the nephron through common pathways.
The genetic mutations responsible for three rare forms of mendelian
hypertension syndromes – Glucocorticoid remediable aldosteronism
(GRA), Liddle’s syndrome and apparent mineralocorticoid excess (AME)
have been identified.
Polymorphisms and mutations in the genes for angiotensin
converting enzyme, angiotensin, B2 adrenergic receptor, adducin,
angiotensinase C, renin binding proteins, G protein B3 subunit, atrial
natriuretic factor and the insulin receptor are found to be associated with
FIG 2.A sig eff pre vas bar res filt
G 1. FAC
AGE :
Almo
gnificantly
fect on car
essure.
In CV
scular resi
roreceptor
sults in ele
The e
tration rat
CTORS IN
st all the s
y with age
rdiovascul
VS, aging
istance wh
r sensitivit
evation of
ffects of a
e, renal bl
NVOLVED
surveys sh
in both m
lar and ren
leads to in
hich are in
ty and β2a
f BP.
aging on re
lood flow
D IN THE
how that b
men and w
nal functio
ncreased a
n concert w
adrenocept enal funct and plasm E REGULA blood press omen. Ag ons which arterial rig with reduc tor sensiti
tions are re
ma renin ac
ATION O
sure incre
ging has si
h leads to e
gidity and
ced cardia
vity and u
along with increased plasma volume results in significant elevation of
blood pressure.
With aging , reductions may occur in brain metabolism, nerve
conduction velocity, basal metabolic rate, vital capacity and maximum
breathing capacity which contributes to rise in blood pressure.
The compliance of blood vessels is reduced with aging which
leads to elevated blood pressure. False elevation of BP can also occur in
elderly individuals due to thickened peripheral vessels which can be
identified by Osler maneuver.
3.SEX :
In adult women, blood pressure is lower than in men of comparable
age. But, the rise in blood pressure is more steep thereafter and around
middle age, blood pressure is about the same in both men and women.
MODIFIABLE RISK FACTORS
1.OBESITY :
Obesity is one of the modifiable risk factors for the onset of
hypertension. The Framingham Study showed nearly1mmHg rise of
80 be dan wo FIG fou ind Abdom
cm or mo
associate
ngerous ri
omen coul
[image:16.612.117.509.330.580.2]
G 2. MEC
Cardia
und to be h
dividuals w
minal obe
re in wom
d with risk
isk factor.
ld be attrib
CHANISM ac output higher wh when com esity which
men and 90
k of hyper
About 70
buted to ab
MS OF OB
, stroke vo
hile periph
mpared to n
h is eviden
0cm or mo
rtension. A
0% of hyp
bdominal BESITY IN olume and heral resist non-obese
nced by w
ore in men
Abdomina
ertension
obesity.
NDUCED
d total blo
tance is lo
e individua
waist circum
n has also
al obesity i
in men an
D HYPERT
od volume
ower in ob
als. (8)
mference
been foun
is the mos
nd 60% in
TENSION
e has been
Cardiac output is directly proportional to the expansion of
bodymass which is the primary reason for rise in BP. (9)The prevalence of
hypertension increased equally with increasing BMI, degree of upper
body obesity and fasting insulin levels. (10)
Obesity results in insulin resistance and hyperinsulinemia which
are components of the metabolic syndrome. Such higher insulin levels are
found to be associated with more hypertension.
Mechanisms of insulin resistance/hyperinsulinemia induced hypertension
I.Enhanced renal sodium and water absorption :
1. Increased blood pressure sensitivity to dietary salt intake.
2. Augmentation of the pressure and aldosterone responses to AII
(angiotensin II).
3. Changes in transmembrane electrolyte transport
a. Increased intracellular sodium
b. Decreased Na+/K+ - ATPase activity
II.I mu FIG als is z ins Increased 1.Stim uscle. 2. Stim 3. Red 4. Imp 5. Inc
G 3. EFFE
Insuli
so causes v
zero. An i
sulin in co
intracellu mulation o mulation o duced syn paired vas reased sec ECTS OF n increase vasodilatio imbalance onditions s
ular Ca2+ ac
of growth f
of sympath
nthesis of v
sodilation cretion of HYPERIN es sympath on which e between
such as ob
ccumulati factors, es hetic nerv vasodilato endothelin NSULINE hetic outfl decreases these pres besity lead ion : specially in vous activi ory prostag n EMIA ON low which
BP, so th
ssor and d
ds to elevat
n vascular
ity.
glandins.
N BLOOD
h raises the
hat the net
epressor a
ted blood
r smooth
PRESSU
e BP and i
2.EXCESS SODIUM INTAKE :
Excess sodium leads to hypertension by increasing fluid volume
and preload, thereby increasing cardiac output. Sodium excess also
affects vascular reactivity and renal function which inturn leads to
increased blood pressure. (12) (13)
The Intersalt study which was conducted in 32 countries projected
that a 100 mmol/day lower sodium intake over a lifetime would result in
a 9mmHg smaller rise in systolic BP from 25 to 55 years of age. It
demonstrated a clear relationship between the salt intake and the level of
BP among communities.
Sodium sensitivity
Only about half of the patients with high sodium intake develop
hypertension which suggests a variable degree of blood pressure
sensitivity to sodium.
The proposed mechanisms for sodium sensitivity are defect in renal
sodium excretion, increased activity of the sodium hydrogen exchanger,
increased sympathetic nervous system activity, increased calcium entry
into vascular smooth muscle & impaired nitric oxide synthesis. (12) (14) (15)
more in women than men. (18) (19)Blacks have greater frequency of salt
sensitivity.
3.ALCOHOL INTAKE :
Excessive alcohol intake is an important cause for hypertension.
Excess consumption accounts for 5% to 30% of all hypertensive patients.
Several studies including the Intersalt Study have shown a strong and
independent positive relationship between alcohol intake and increase in
blood pressure.
Alcohol intake has been found to have a biphasic effect on blood
pressure. Smaller doses of alcohol has a vasodilatory effect and lowers
blood pressure, but as alcohol consumption increases blood pressure
increases leading to hypertension.
This dose - response characteristics varies from individual to
individual depending upon various factors such as body surface area,
gender and race.
The mechanism for the alcohol induced rise in blood pressure is
associated with the activation of, or increased responsiveness to the
4.P hy the 5.S pre hy 6.R FIG Str RA PHYSICA Seden ypertension
e role of p
SMOKING
Tobac
essure. Bu
ypertension
[image:21.612.114.508.378.607.2]ROLE OF
G 4. MEC
ress direct AAS, high AL ACTIV ntary indiv n. Observa hysical in G : cco smoki ut ,whether
n is not ye
F STRESS
CHANISM
tly stimula
h sodium i
VITY :
viduals hav
ational and
nactivity an
ing has be
r prolonge
et proved.
:
M OF STR
ates sympa
ntake & in
ve 20 to 5
d experim
nd its asso
en found t
ed smokin
RESS IN
athetic out
nsulin resi
50% increa
mental stud
ociation w
to cause a
ng leads to
DUCED
tflow whi
istance lea
ased risk o
dies have d
with hypert
acute rise i
o sustained
HYPERT
ch inturn
ading to ri
of develop demonstra tension. in blood d TENSION interacts w
ise in BP. ping
ated
DETERMINANTS OF BLOOD PRESSURE
There are five important factors which are responsible for
maintaining the arterial blood pressure. Following are the five factors:
1.Cardiac output
2.Peripheral resistance
3.Elasticity of the arterial walls
4.Blood volume
5.Volume of the vascular space
1.CARDIAC OUTPUT :
When the ventricle contracts , more blood enters the already
partially filled arteries, and the pressure on the arterial wall rises.(This is
the pressure during systole). The arterial walls are stretched, the pressure
rises and then falls as blood leaves the arterial system. Cardiac output
influences the systolic blood pressure. Increase in cardiac output
2.PERIPHERAL RESISTANCE :
When resistance to flow is increased,the pressure is high and when
the resistance is reduced , the pressure falls. The frictional resistance to
flow of blood depends upon lumen of blood vessels, viscosity of blood
and velocity of blood flow.
a.Lumen of blood vessels:
The most important factor is the lumen of vessels , especially that
of arterioles which are the resistance vessels. If the lumen is narrowed (by
vasoconstriction) the pressure is increased. If the lumen becomes wider
(by vasodilatation) the pressure is decreased. Peripheral resistance
influences the diastolic pressure more than the systolic , though both may
be affected.
b.Viscosity of blood:
When the viscosity of blood is reduced (e.g. in anaemia) resistance
is low; it is high when the viscosity is increased ( e.g. polycythemia ).
c.Velocity of blood flow:
Increased velocity of blood flow tends to increase the frictional
resistance. Normally, flow in blood vessels is laminar , but becomes
(e.g. atherosclerosis). Turbulent flow sets up eddy currents and the
resistance to flow is much increased.
However, the moment to moment adjustments of resistance is
brought about by alterations in the lumen size by the vasomotor tone.
3. ELASTICITY OF THE ARTERIAL WALLS :
The large arteries are elastic and distensible and it is the elasticity
of the arterial walls that is responsible for the origin and maintenance of
the diastolic pressure.
If the arteries were rigid inelastic tubes, the pressure on the walls
will rise steeply when blood enters the vessel during systole, and during
diastole when no blood enters, the pressure will drop to zero.
Because the arteries are elastic , they stretch when blood enters
during systole and prevent a large rise in systolic pressure. During
diastole, when the entry of blood ceases, the arterial walls recoil, and this
is responsible for the diastolic pressure.The recoil also acts as a secondary
pump to push blood along the vessels during diastole.
The elastic recoiling of the arterial walls and the peripheral
resistance in the arterioles are responsible for converting the intermittent
4.BLOOD VOLUME :
Increase in blood volume causes the arterial system to be overfilled
and raises both systolic and diastolic blood pressures. A reduction in
blood volume reduces the blood pressure.
5.VOLUME OF THE VASCULAR SPACE :
If the volume of the vascular space is increased by dilatation of the
arterioles and capillaries, the blood pressure is reduced. If the vascular
space is decreased , blood pressure is increased.
The blood volume and vascular space do not change much under
normal circumstances. The elasticity also does not change , except very
gradually with age over a long period of time or as a result of disease.
Hence, the day to day regulation of arterial blood pressure is by
changes in the cardiac output and peripheral resistance.
The amount of blood entering the arteries is determined by the
cardiac output. Blood leaving the arteries is determined by the peripheral
resistance. Hence, if cardiac output or peripheral resistance or both are
increased, blood pressure rises. If cardiac output or peripheral resistance
PHYSIOLOGY OF BLOOD PRESSURE
HOMEOSTASIS
The basic equation in the physiology of blood pressure is
Blood pressure = cardiac output × peripheral resistance
Cardiac output = Heart rate × stroke volume
Blood volume varies directly with total body sodium content
because sodium is the predominant extracellular solute that retains water
within the extracellular space.
ROLE OF KIDNEYS
The primary function of the kidneys is to regulate sodium and
water excretion and consequently , they also play a dominant role in the
long term control of BP.
The most important and fundamental mechanism in determining
the long term control of blood pressure is the renal fluid - volume
feedback system. Through this feedback system, the kidneys regulate
arterial pressure by altering renal excretion of sodium and water, thereby
controlling circulatory volume and cardiac output. Changes in BP, in turn
providing a significant feedback system for controlling extracellular fluid
volume, cardiac output, and BP.
Two important renal mechanisms play a significant role in the long
term control of blood pressure.
In the first mechanism, extracellular fluid volume is regulated by
coupling the magnitude of urinary salt and water excretion and the related
changes in blood volume and cardiac output , to changes in renal
perfusion pressure.This phenomenon is called pressure natriuresis which
is explained by Guyton and his co-workers. (20) (21)
In the second mechanism , Renin-Angiotensin-Aldosterone System
(RAAS) is employed. It has a direct control over peripheral vascular
resistance and reabsorption of sodium and water in renal tubules. RAAS
is the long term regulator of blood pressure homeostasis . (22) (23)
I . PRESSURE NATRIURESIS:
Pressure natriuresis is the central component of the negative
feedback system which is responsible for the long term control of blood
pressure. Pressure natriuresis is defined as an increase in sodium and
water excretion by kidneys that occurs when arterial pressure rises.
the sod pre and FIG pre hy pro RI ang The m
e renal arte
dium excr
As the
essure also
d increase
G 5. PROP
Vario essure natr ydrostatic p ostaglandi Increa HP, kinin giotensin magnitude erial perfu
retion by c
e perfusio o increase ed sodium POSED M us biophy riuresis.Th pressure (R ins, nitric ased renal s, prostag II.
of urinar
usion pres
changing t
n pressure
es which re
excretion MECHAN ysical facto hese inclu RIHP), an oxide and perfusion
landin E2,
ry sodium
sure.The l
the peritub
e increases
esults in d
n.
NISMS OF
ors have b
ude medull
nd renal au
d kinins.
n pressure
, and nitric
excretion
level of pe
bular hydr
s , peritub
decreased s
F PRESSU
been found
lary blood
utacoids su
leads to a
c oxide wh
n is a direc
erfusion pr
rostatic pre
bular hydro
sodium re
URE NATR
d to contri
d flow, ren
uch as ang
a significan
hile it dec
1.RIHP:
Elevated renal perfusion pressure significantly increases RIHP,
even in the absence of increased GFR and renal blood flow. (24) Pressure
natriuresis can be attenuated but cannot be abolished by preventing the
rise in RIHP in reponse to perfusion pressure. (25)
The exact mechanism by which RIHP affects tubular reabsorption
is not known. It appears to be associated with changes in permeability of
tight junctions in the proximal tubules to sodium, redistribution of apical
sodium transporters and release of prostaglandin E2.
2.NITRIC OXIDE :
Nitric oxide plays a significant role in renal hemodynamics and
hence influences BP. (26) Renal medullary blood flow has an important
role in maintaining blood pressure homeostasis. Nitric oxide is tonically
active in the medullary circulation and regulates medullary renal vascular
resistance, natriuresis and diuresis. (27)
Reduction in nitric oxide production enhances pressure natriuresis
response followed by reduction in medullary blood flow, RIHP and
sodium excretion without corresponding changes in total or cortical renal
3. KININS :
Kinins produce pressure natriuresis by inhibiting sodium
reabsorption in the distal part of the nephron or by producing changes in
the deep nephron reabsorption.
Kinins affect sodium reabsorption in three ways : i. Direct effect on
the transport of sodium along the nephron, ii. A vasodilator effect, iii.
Changes in the osmotic gradient of renal medulla.
4. METABOLITES OF ARACHIDONIC ACID :
Arachidonic acid is an important component of cell membrane. It is
metabolised into hydroxyeicosatetraenoic acid (20-HETE) and
epoxyeicosatrienoic acids (EETs) by cytochrome P450 enzymes.
Both EETs and 20-HETEs have a significant impact on renal
vascular tone and sodium excretion and hence regulates pressure
natriuresis.
These metabolites inhibit Na+/K+ - ATPase activity and promotes
internalisation of NHE3 proteins at the brush border of proximal tubule
thereby inhibiting proximal tubule renal transport and increasing urinary
II . FIG jux i.d of iii. ang fro
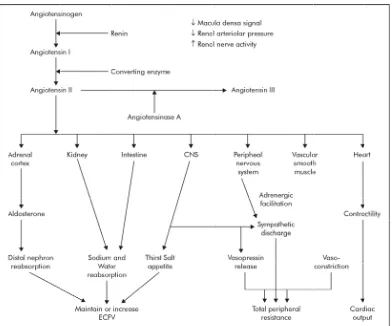
[image:31.612.117.509.101.427.2]. RENIN A
G 6.Schem Renin xtaglomeru decreased s sodium ch .increased Renin giotensino
om the live
ANGIOTE
matic diag
n is a glyco
rular cells
signal from
hloride de
d renal nerv
n is a prote
ogen , whi
er and is c
ENSIN AL
gram of ren
oprotein h of kidney m macula elivered, ii ve activity eolytic enz
ich is a pla
converted
LDOSTER
nin - angio
hormone w
y .The sign
densa wh i.decreased y. zyme whic asma prote to Angiot RONE SY
otensin - a
which is se
nals for ren
hich detect
d renal art
ch acts on
ein. Angio
tensin I wi
YSTEM : aldosteron ecreted by nin release ts changes teriolar pr
n its substr
otensinoge
ith the help
ne system.
y
e include
s in the loa
essure and
rate
en is secre
p of renin ad
d
eted
During the passage of Angiotensin I through lungs , it is converted
into Angiotensin II by a converting enzyme which is present on the
surface endothelial cells of pulmonary vessels. Angiotensin II is rapidly
inactivated by enzymes called angiotensinases.
Angiotensin II is the biologically active product of the
juxtaglomerular Renin – Angiotensin system and is a vasoconstrictor and
stimulates aldosterone.
ACTIONS OF ANGIOTENSIN II
1.Aldosterone cortex :
Angiotensin II stimulates the secretion of aldosterone from adrenal
cortex. When there is a reduction of ECF volume or blood volume or
Nacl concentration, aldosterone secretion is increased through the
Renin-Angiotensin mechanism. Aldosterone promotes sodium reabsorption in
the renal tubules, with chloride and water following sodium , and thus
restores fluid and salt balance.
2. Cardiovascular system :
The most prominent action of Angiotensin II is vasoconstriction
produced directly as well as by enhancing adrenaline or nor-adrenaline
Angiotensin II also increases force of myocardial contraction by
promoting calcium reflux and influences cardiac output.
3.Renal system :
In addition to exerting indirect effect on kidney through
aldosterone, A- II promotes Na+/K+ exchange in proximal tubules which
leads to sodium, chloride and bicarbonate reabsorption. Further, it
reduces renal blood flow and produces intrarenal hemodynamic effects
which normally results in sodium and water retention.
4.CNS :
Angiotensin II induces drinking behaviour and ADH release which
leads to plasma volume expansion. It also increases central sympathetic
outflow contributing to the pressor response.
5.Peripheral nervous system :
It releases adrenaline from adrenal medulla, stimulates autonomic
ganglia, and increases the output of nor- adrenaline from adrenergic nerve
endings.
Thus, Renin- Angiotensin-Aldosterone system plays a major role in
PATHOPHYSIOLOGY OF HYPERTENSION
ALTERED RENAL PHYSIOLOGY
:Essential hypertension is primarily due to an abnormal kidney
which leads to impaired excretion of sodium. (29)Various hypotheses have
been proposed to explain that , abnormal sodium retention by the kidneys
is the main initiating event for hypertension.
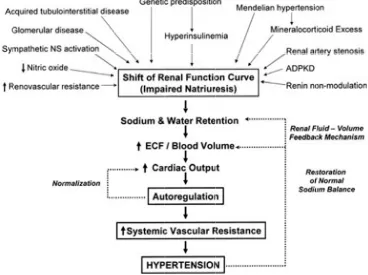
1.GUYTON’S HYPOTHESIS :
Guyton’s hypothesis states that derangements in the renal fluid –
volume pressure control mechanism forms the basis of virtually all
hypertensive states.
In every hypertensive state , there exists an underlying
abnormality in the intrinsic natriuretic capacity of the kidney so that the
daily salt intake cannot be excreted at a normal BP, and the development
of hypertension is necessary to induce a pressure natriuresis that allows
the kidney to excrete the daily salt intake. Normal sodium balance and
ECF volume are maintained but at the expense of systemic hypertension.
Depending upon the etiology of hypertension, the underlying cause
ess avi hy Inc als tub los als FIG HA sential hyp
idity for s
yperinsulin
creased An
so enhance
bular sodiu
ss, resultin
[image:35.612.114.482.398.673.2]so occurs d
G 7. GUY
ANDLING pertension odium. Fo nemia incr ngiotensin es sodium um reabso
ng in a nat
due to def
YTON ‘S H
G LEADIN
n , some un
or example
reases prox
n II levels
m reabsorpt
orption. Re
triuretic in
fect in rena
HYPOTH
NG TO H
nderlying
e, in patie
ximal tubu
and symp
tion. Mine
enal paren
n a natriure
al endothe
ESIS – AB
YPERTEN
abnormal
nts with m
ular sodiu
pathetic ne
eralocortic
nchymal d
etic defect
elin or nitr
BNORMA NSION . lity increa metabolic um reabsor ervous sys coids enha disease cau t. Impaire
ric oxide l
To date , each of the genetic causes of hypertension that have been
elucidated has been found to be related to an abnormality of renal sodium
handling. For example, Liddle’s syndrome occurs due to an abnormality
in sodium channels in the distal nephron which leads to enhanced distal
tubular sodium reabsorption.
Guyton’s hypothesis states that this impaired natriuretic capacity of
the kidney leads to sodium and water retention initially which in turn
leads to ECF volume expansion and increased cardiac output with
hypertension. But, this phase of volume expansion and high cardiac
output is short lived.
In this high cardiac output state, autoregulatory vasoconstriction of
each vascular bed matches the blood flow to the metabolic requirements
of the tissues.This phenomenon of circulatory autoregulation results in an
increase in the systemic vascular resistance (SVR). Therefore,
hypertension that was initially caused by high cardiac output becomes
high SVR hypertension.
The development of hypertension represents a protective
mechanism, because it induces the kidney to undergo a pressure
natriuresis and diuresis , thereby restoring normal salt balance and
2.
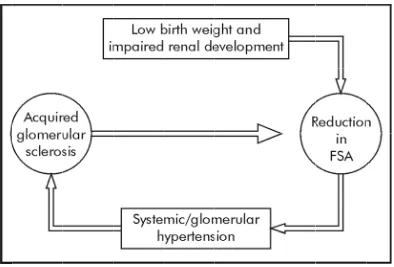
is i filt sod sys sys FIG HTBRENN
Brenn inversely The c tration sur dium, rais stemic hyp stemic hypG 8. SCHE
Impai
T which in
NER’S HY
ner et al(30)
related to
ongenital
rface area
ses the blo
pertension
pertension
EMATIC
ired renal
n turn lead
YPOTHE
) in 1988 s
the risk o
reduction
(FSA) per
ood pressu
n begets gl
n. (31)
DIAGRA
developm
ds to glom
ESIS
:stated that
of developi
n in the num
r glomeru
ure, and set
lomerular
AM OF BR
ment or red
merular HT
t the nephr
ing hypert
mber of n
ulus , limit
ts off an v
r hypertens
RENNER
duction in
T and the v
ron endow
tension lat
nephrons o
ts the abili
vicious cir
sion which
’S HYPOT
FSA leads
vicious cyc
wment at b
ter in life.
or in the
ity to excr
rcle, where
h begets m
THESIS
s to system
3.
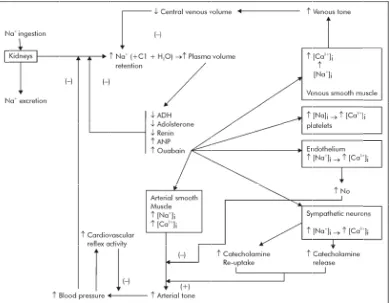
Ou sec int the sod FIG SOBLAUS
Accor uabain, ancreted. It i
tracellular
e developm
[image:38.612.118.508.379.682.2]dium reten
G 9. BLA
ODIUM R
TEIN’S
rding to B
endogeno
increases i
r stores. Ul
ment of es
ntion is th
AUSTEIN’
RETENTIO
HYPOT
Blaustein (3
ous digital
intracellul
ltimately a
ssential hy
he basic me
S HYPOT
ON.
THESIS :
2), when p
lis like inh
lar sodium arterial ton ypertension echanism. THESIS – plasma vol
hibitor of s
m and mob
ne is incre
n. In this h
.
– MECHA
lume is ex
sodium pu bilises calc eased whic hypothesi ANISM OF xpanded, ump is cium from
ch leads to
s also,
F RENAL m
4. RENIN –ANGIOTENSIN – ALDOSTERONE SYSTEM :
Renin plays a significant role in the pathogenesis of hypertension.
(33) In essential hypertension, normally, low levels of renin are expected.
But , majority of the patients with essential hypertension show
inappropriately normal or even elevated plasma renin levels. About 20%
are found to have high renin levels, and about 30% have low renin values,
with the remaining half distributed between these two extremes.
Three mechanisms have been offered for such variations in renin
levels. The mechanisms are described below :
A. Nephron heterogeneity in essential hypertension : (34)
Nephron heterogeneity with unsuppressible renin secretion is
proposed as the cause for essential hypertension.
Within the kidneys, there exists a functional and structural basis for
the abnormal renin secretion and impaired sodium excretion that are
characteristics of hypertensive states.
Hypothesis - there is nephron heterogeneity in essential hypertension :
i. There are ischemic nephrons with impaired sodium excretion
intermingled with adapting hyperfiltering hypernatriuretic
ii. Renin secretion is high from ischemic nephrons and low from
hyperfiltering nephrons.
iii.The inappropriate circulating renin-angiotensin level impairs
sodium excretion because:
a. In the adapting hypernatriuretic nephrons
- It increases tubular sodium reabsorption.
- It enhances tubuloglomerular feedback mediated afferent
constriction.
b. As the circulating renin level is diluted by non- participation of
adapting nephrons, it becomes inadequate to support efferent tone in
hypoperfused nephrons.
iv. A loss of nephron number with age and from ischemia further
impairs sodium excretion.
B. Theory of non – modulation
About half of the hypertensive patients have normal and high renin
levels. Williams and Hollenberg proposed a theory of non–modulation (35)
which states that defective feed – back regulation of the renin –
angiotensin system within the kidneys and the adrenal glands is
In normal individuals , the responsiveness of the target tissues to
angiotensin II is modulated with their level of dietary sodium intake.
Sodium restriction enhances adrenal secretion of aldosterone and reduces
vascular response, leading to sodium loading which inturn suppresses
adrenal response and enhances vascular response , particularly within the
renal circulation.
Sodium restriction reduces renal blood flow facilitating sodium
conservation while sodium loading increases renal blood flow promoting
sodium excretion. All these effects are mediated by angiotensin II levels
which increases with sodium restriction and decreases with sodium
loading.
Non – modulation is characterized by abnormal renal and adrenal
responses to Angiotensin II and dietary salt loads. (36) This is due to an
abnormally regulated and fixed level of angiotensin II , which does not
increase adrenal secretion of aldosterone in response to sodium restriction
and in the renal circulation , does not increase renal blood flow in
response to sodium loading.
This hypothesis is supported by the fact that suppression of
angiotensin II by ACE inhibitors in such non – modulators , corrects both
c. Low renin essential hypertension
Low renin levels are found in about 40% of patients with essential
hypertension . Volume expansion with or without mineralocorticoid
excess has been proposed as the possible mechanism for low renin
hypertension.
Fishar et al focussed on adrenal and pressure responsiveness to
angiotensin II which depends on the dietary salt intake in patients with
normal renin hypertension , low renin hypertension and normal controls.
Comparison of patients with normal renin hypertension and
non-modulating essential hypertension with normal plasma renin activity
showed some similarities which include
i. Salt sensitivity of the blood pressure
ii. Blunted plasma aldosterone responses to angiotensin II and upright
posture after dietary sodium restriction for 5 days.
iii. Relatively low basal plasma aldosterone levels.
When normal controls and modulating hypertensive subjects are
compared , there were significant differences between them which
With high sodium intake , plasma angiotensin II activity is
suppressed which leads to resensitisation of angiotensin II receptors and
improved responsiveness of target tissues to angiotensin II.
With sodium restriction , there is blunted responsiveness to
angiotensin II owing to continuing generation of angiotensin II and
angiotensin receptor downregulation in target tissues.
An impaired hydroxy steroid dehydrogenase type 2 ( HSD II B2 )
activity plays a significant role in the pathogenesis of essential
hypertension in some patients.
Apparent mineralocorticoid excess ( AME ) is a rare monogenic
juvenile hypertensive syndrome which occurs due to mutations in the
HSD II B2 gene. In AME , altered HSD enzyme activity causes excessive
stimulation of the mineralocorticoid receptor by cortisol which leads to
hypokalemia, sodium retention and salt dependent hypertension. (37) (38)
The prevalence of mutations in HSD II B2 in general population of
patients with essential hypertension presently unknown. It is important to
seek the diagnosis of AME by genetic and clinical studies because
specific therapy such as spironolactone is available for this disease which
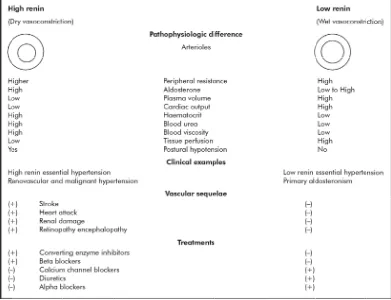
TWO FORMS OF VASOCONSTRICTION IN PRIMARY
HYPERTENSION
Two forms of vasoconstriction , one mediated by sodium – volume
forces and the other mediated by renin – angiotensin system are essential
to maintain normal BP homeostasis. When these mechanisms are
impaired , hypertension occurs. These spectral patterns of
vasoconstriction seen in seen in extreme forms of hypertension also
operate in primary hypertension.
Laragh and his co-workers attached a great significance to various
plasma renin activity levels ( PRA) levels found in patients with essential
hypertension. According to their view , based on the renin levels , the
relative contribution of vasoconstriction and body fluid expansion to the
pathogenesis of hypertension can be identified.
According to the “ bipolar vasoconstriction – volume analysis”,
arteriolar vasoconstriction by angiotensin II is predominantly responsible
for the hypertension in patients with high renin whereas volume
expansion is predominantly responsible in those with low renin. Both
lead to increased peripheral resistance which is the common characteristic
vas com FIG at inf the Apart soconstric mplication
G 1O. HIG
The p
other pole
fluence wh
The sp
eir renin –
t from the
ction are to
ns and trea
GH BP M
redominan
e whereas
hen renin
pectrum o
– sodium r
similarity
otally diff
atment (39)
MECHANI
nce of act
both vaso
levels are
of hyperten
elationshi
y in periph
ferent in th
) as shown
SMS BAS
tivity of ei
oconstricti
in the me
nsive diso
ip as show
heral resist
heir pathop
n in the fig
SED ON R
ither pole
ve forces
edium rang
orders are s
wn in FIG
FIG BP cur aut sec or sec ret to vas to
G 11. SPE
P = Blood
Norm rtailing re tonomic v cretion in blood loss Hyper cretion of tention of fully turn High r soconstric cardiovas ECTRUM pressure ; mal subject nal renin vasoconstr reaction to
s or a neur
rtensive su
too much
too much
off as it d
renin hype
cted with p
cular tissu
OF HYPE
; PRA = P
ts maintain
secretion
riction or b
o either so
rogenic fa
ubjects su
h renin for
Na+ volum
does in nor
ertensive
poor tissue
ue ischemi
ERTENSI
Plasma ren
n and defe
in reaction
by proport
odium dep
all in blood
stain their
their Na+
me for the
rmal subje subjects a e perfusio ic damage IVE DISO nin activity end norma
n to a rise
tionally in
pletion or h
d pressure
r higher bl
volume st
eir renin le
ects.
are proport
n and ther
e.
ORDERS
y .
al blood pr
in sodium
ncreasing r
hypotensi
e.
lood press
tates or by
evel , whic
tionately m
refore mos
ressure by
m intake or
renin
on from fl
sures by re
y renal
ch often fa
5. SHEPHERD’S HYPOTHESIS
:In normal individuals , when there is an increase in the blood
pressure or central venous pressure , the baroreceptors are activated and
they reduce heart rate and lower blood pressure, respectively, by vagal
stimulation and sympathetic inhibition.
When there is sustained hypertension, resetting of the baroreceptor
reflexes occur due to structural and functional changes so that an increase
in blood pressure evokes less reduction in heart rate. (40)
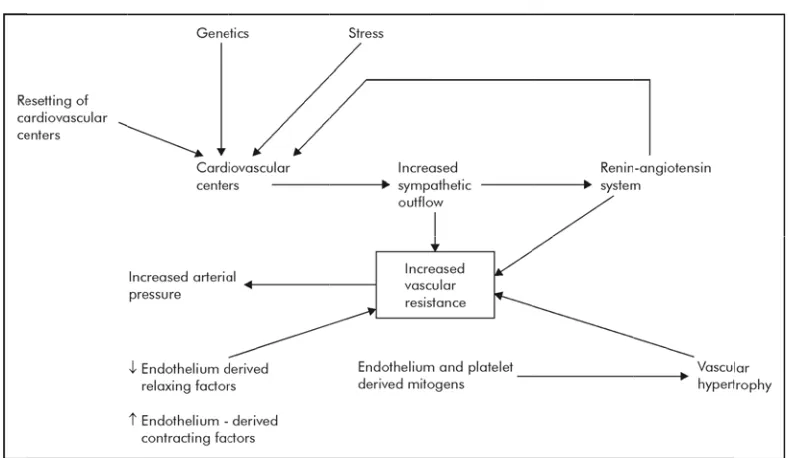
Shepherd’s hypothesis states that the decreased inhibition of the
vasomotor center which results from resetting of the arterial
baroreceptors may be responsible for increased sympathetic outflow and
thereby in the perpetuation of hypertension. (41)
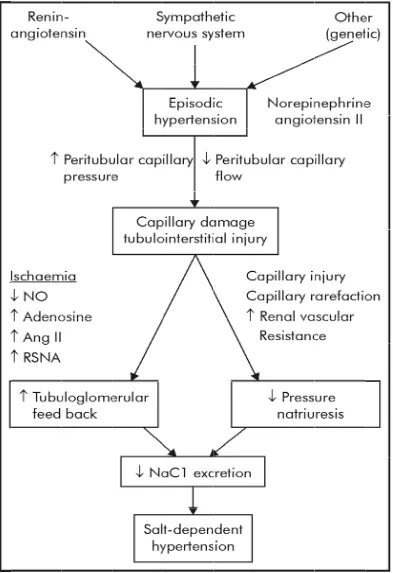
6. SALT DEPENDENT HYPERTENSION
:It has been proposed that hypertension has two phases. An early
phase in which the elevations in blood pressure are mainly episodic and
are mediated by a hyperactive sympathetic nervous system or
renin-angiotensin system. The second phase is characterised by persistently
elevated BP which is primarily mediated by an impaired ability of the
FIG
[image:48.612.116.509.73.646.2]
G 12. PAT
THOGEN
NESIS OF
SALT DE
EPENDEN
NT HYPE
ERTENSIO
ON
The acute norepinehrine or angiotensin II mediated elevation in
blood pressure is transmitted to the peritubular capillaries of the kidney in
association with a reduction in blood flow, secondary to the
vasoconstrictive properties of these substances. Capillary damage and
tubulointerstitial injury with fibrosis results.
The local ischemia stimulates ( adenosine , ang II , renal
sympathetic nerve activity ) or inhibits ( nitric oxide , prostaglandins ,
dopamine ) vasoactive mediators , resulting in NaCl reabsorption due to
enhanced tubuloglomerular feedback.The capillary damage and increase
in renal vascular resistance also blunts pressure natriuresis mechanism.
The consequences of both enhanced tubuloglomerular feedback
and impaired pressure natriuresis is an acquired functional defect in
sodium chloride excretion . This results in the resetting of the pressure –
natriuresis curve to a higher pressure in order to restore sodium balance
back to normal. (42)
This is proposed as the major mechanism for the development of
salt dependent hypertension. Thus , essential hypertension may be a type
In conclusion , this hypothesis links early, episodic, salt
independent hypertension with the later development of a persistent salt
dependent hypertension with a new concept that it is mediated by
acquired tubulointerstitial and peritubular capillary injury.
The strength of this hypothesis is that it unites many prior
hypotheses into one pathway ; including that of Guyton et al on impaired
pressure natriuresis (20), of Brenner on reduced nephron number (39), of
Sealey and Laragh on activation of the renin angiotensin II system (34),
of Cowley et al on the role of medullary ischemia (26), of Kurokawa on
enhanced tubuloglomerular feedback (43), of
Julius on the role of the
sympathetic nervous system in early hypertension (44).
In addition , this hypothesis potentially provides answers to many
REVIEW OF LITERATURE
Many epidemiological studies have shown a strong relationship
between dietary salt intake and hypertension. Few studies regarding the
association of salt intake and blood pressure are mentioned here.
1.Carherine E Huggins et al assessed 24 hour urinary sodium and
potassium excretion and examined the relationship to blood pressure
within a population of middle aged and older Australian adults. In the
five hundred and eighty seven participants with blood pressure
measurements , urinary sodium and the sodium to potassium ratio were
both associated with systolic blood pressure even after adjustment for
age, sex and BMI.The study demonstrated that sodium intake is positively
associated with blood pressure. (45)
2. Rosa M.Ortega et al studied about the sodium intake of a
representative sample in the Spanish young and middle aged population.
Sodium intake was measured by 24 hour urinary sodium excretion. In this
study, urinary sodium excretion significantly correlated with systolic and
diastolic blood pressure .About 88% of the subjects in the study group
had salt intakes above 5g/day. Male subjects and participants with higher
3.B.M.Y CHEUNG et al studied seventy Chinese patients with untreated
hypertension and forty seven normotensive controls. For each subject ,
blood pressure and 24 hour urinary sodium & potassium excretion were
measured. 22 hypertensive patients underwent ambulatory blood pressure
monitoring. In hypertensive patients, the diastolic BP directly correlated
with 24 hour urinary Na excretion while in normotensive controls , it did
not correlate with 24 hour urinary sodium excretion. Even patients who
underwent ambulatory blood pressure monitoring showed a significant
correlation between diastolic BP and sodium excretion. Systolic blood
pressure did not correlate with sodium excretion , although it increased
with advancing age of the patient. (47)
4.RA JAN et al studied the relationship of 24 hour urinary Na+ and K+
excretion, Na+/K+ molar ratio and body mass index with blood pressure in
hypertensive patients and normotensive controls in Kashmir. 24 hour
urinary Na+ excretion, Na+/K+ molar ratio and body mass index were
significantly increased in hypertensive people when compared to normal
individuals. But , 24 hour urinary K+ excretion was low in hypertensive
patients. Thus , Na+ and K+ excretion , Na+/K+ molar ratio and BMI were
found to have a direct role in the etiology or perpetuation of hypertension
in Kashmir, which was attributed to high intake of salt tea in this
5.KUO – LIONG CHIEN et al reported about the role of 24 hour
urinary sodium excretion in the development of hypertension among
ethnic Chinese community. In this prospective cohort study from Chinese
community, a significant J-shaped relationship was observed between 24
hour urinary sodium excretion and the risk of hypertension. Subjects in
the highest quartile of urinary Na+ excretion and higher baseline BP had
twofold increased risk of hypertension when compared to those in the
lowest quartile of urinary Na+ excretion and lower blood pressure. High
urinary Na+ excretion was associated with significant risk of hypertension
in ethnic Chinese population. (48)
6.INTERSALT(3) , an international epidemiological study examined the
relation between dietary sodium intake ( based on 24 hour urinary sodium
excretion ) and BP in more than ten thousand individuals, aged between
twenty and fifty nine years, from fifty two countries around the world.
Sodium excretion correlated strongly and positively with blood pressure
while potassium excretion correlated negatively with blood pressure in
individual subjects, even after controlling for confounding variables.
Na+/K+ molar ratio also correlated positively with blood pressure. Age,
BMI and high alcohol intake had strong influence on blood pressure in
individual subjects . Among 52 countries in the study, four countries
7.SONJA L. CONNOR et al studied the relationship of blood pressure
with age , body weight and multiple dietary factors among the members
of more than two hundred randomly selected families. Age , bodyweight
and heart rate were independently and positively correlated with blood
pressure. A strong familial component was identified for urinary Na+ and
K+ excretion and for systolic BP. In females, urinary sodium and
potassium excretions correlated positively with diastolic BP. But , this
relationship did not persist after controlling for confounding variables
such as age and body weight. In males, intake of dietary factors such as
potassium, calcium and phosphorous correlated positively with systolic
BP even after controlling for confounding variables.This is in contrast to
other studies which showed a negative correlation between potassium
intake and blood pressure. (49)
8.SUSAN HEDAYATTI et al studied the correlation between urinary
sodium & potassium molar ratio and blood pressure in more than 3000
participants. 56% of the participants were women and 52% were African
Americans. Urinary Na+/K+ molar ratio correlated positively with both
systolic and diastolic blood pressure even after adjusting for serum
cholesterol, smoking, diabetes mellitus, BMI and GFR . Both systolic and
diastolic BP were significantly elevated in African Americans when
AIMS AND OBJECTIVES
1.To study the association between 24 hours urinary sodium & potassium
excretion and blood pressure in patients with essential hypertension.
2.Our study was based on GUYTON’s hypothesis which states that
individuals with impaired capacity to excrete sodium require greater
increase in arterial pressure to maintain sodium balance.
3.The anticipated outcome in our study was that individuals with high
urinary sodium excretion and low urinary potassium excretion were more
MATERIALS AND METHODS
SOURCE OF DATA :
The study was conducted in Government RajajiHospital,Madurai
among patients attending outpatient clinic in general medicine.40 patients
as per criteria of JNC VI report and equal number of age and sex matched
controls were taken up for study.
DESIGN OF STUDY:
Our study was a randomised prospective study comparing two
groups – Hypertensives and Normotensives.
PERIOD OF STUDY:
The study was conducted for a period of eight months from April
2012-November 2012.
ETHICAL APPROVAL:
Obtained from institutional ethical committee headed by
CONSENT :An informed written consent was obtained from all the
subjects included in the study.
STUDY GROUP:
INCLUSION CRITERIA:
1.Age between 18 and 75 years.
2.Hypertension as per JNC VI report-BP – 140/90 mmHg least at three
different occasions after refraining from anti-hypertensives and diuretics
for atleast three weeks before the study.
3.Refraining from eating,smoking or indulging in any stressful activity 30
minutes before recordings.
EXCLUSION CRITERIA:
1.Patients with secondary hypertension.
2.Patients on NSAIDs, anti-hypertensives,diuretics.
3.Patients with congestive cardiac failure.
4.Patients with malignant hypertension.
CONTROL GROUP:
1.Same age and sex.
2.BP lower than 140/90 mmHg.
METHODOLOGY:
A detailed medical history was obtained from all the subjects.
Family history of hypertension,Diabetesmellitus,cardiovascular disease
and renal disease were sought. Duration of hypertension ,levels of
elevated blood pressure,results and side effects of anti-hypertensive
therapy were recorded. History of all the prescribed and over the counter
medications,smoking,alcoholuse,weight gain and symptoms suggestive of
secondary hypertension were obtained.
A complete physical examination was conducted for all the
subjects which included pulse and BPmeasurements,examination of
extremities for edema,examination of neck for distended
veins,thyromegaly,examination of cardiovascular,respiratory,abdominal
and central nervous systems,optic fundoscopic examination for any
hypertensive changes. Height and weight were measured and Body mass
Blood pressure was measured on three different occasions with
same standard mercury sphygmomanometer in both supine and standing
positions. The average of three readings was used in data analysis.
The following investigations were done in all the subjects:
1.Completehemogram
2.Urine analysis
3.Serum – sugar,urea,creatinine,calcium,phosphorus,uric acid and
cholesterol
4.Serum – sodium and potassium
5.24 hours urinary sodium and potassium excretion.Na+/K+ molar ratio
was calculated.
6.USG abdomen and pelvis
7.ChestXray
8.Electrocardiogram and Echocardiography
24 hour urine collection was done in our study group to measure
urinary sodium and potassium excretion. All the participants were
instructed to collect urine for 24 hours and not to alter their dietary
pattern during collection so that the urinary sodium and potassium
excretion amount was a direct measure of sodium and potassium intake of
the individuals.
STASTICAL ANALYSIS:
Statistical analysis was performed using statistical software
Medcalc version 12.3 for Windows. P value <0.05 was considered
significant. Baseline characteristics between cases and controls were
compared using student t test for quantitative variables and chi square test
for qualitative variables. Relationship between different variables were
analysed by partial correlation after controlling for potential confounders
(age,sex&BMI). The different trends in sodium and potassium excretion
depending upon age group, BMI and severity of hypertension were
RESULTS AND OBSERVATIONS
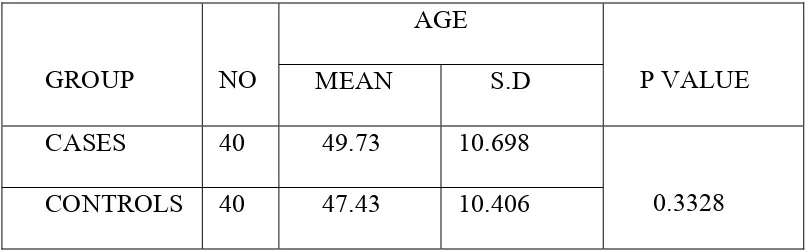
TABLE 1
Distribution of age among study group
GROUP NO
AGE
P VALUE
MEAN S.D
CASES 40 49.73 10.698
0.3328
CONTROLS 40 47.43 10.406
In our study,the age of normotensive group ranged from 20-65
years whereas in the hypertensive group it ranged from 25-68 years.
The mean age in the normotensive group was 47.43 with standard
deviation of 10.406.
The mean age in the hypertensive group was 49.73 with standard
deviation of 10.698.
P value was 0.3328 which was not significant.
So, there was no significant difference in the distribution of age
TABLE 2
Distribution of study population in relation to gender
SEX
HYPERTENSIVES NORMOTENSIVES
NO PERCENTAGE NO PERCENTAGE
MALES 22 55 20 50
FEMALES 18 45 20 50
TOTAL 40 100 40 100
In our study population, 42 were males and 38 were females.52.5%
were males and 47.5% were females.
In hypertensive group, there were 22 males and 18 females.55%
were males and 45% were females.
In the normotensive group, there were 20 males and 20 females.
50% were males and 50% were females.
P value was 0.8228 which was not significant.This suggests that
there was no significant difference in the distribution of gender among
study population.
In the study population 52.38% of males were hypertensives while
GRAPH 1
Distribution of study population in relation
to gender
0
5
10
15
20
25
Hypertensives Normotensives
Count
1
2
Sex
TABLE 3
BMI distributions in the study population
BMI
HYPERTENSIVES NORMOTENSIVES
P value
No Percentage No Percentage
< 25 24 60% 31 77.5%
0.096
≥ 25 16 40% 9 22.5%
Total 40 100 40 100
MEAN 24.3020 23.479
S.D 2.445 1.894
The average BMI in the hypertensive group is 24.3020 ± 2.445
whereas the average BMI in the normotensive group is23.479 ±
1.8937.There was no significant difference in the BMI distributions
among cases and controls as the P value is 0.096 which is not significant.
In our study population, 25 people had high BMI and 55 had
normal BMI.31.2% had high BMI while 68.7% had normal BMI.Of the
40 people in the hypertensive group,16 had high BMI and 24 had normal
BMI whereas in the normotensive group 9 had high BMI and 31 had
GRAPH 2
BMI distributions in the study population
0
5
10
15
20
25
30
35
Hypertensives Normotensives
Count
1
2
40% of hypertensives had high BMI while in normotensives
22.5% had high BMI.
64% of people with high BMI were hypertensives while 43.64% of
[image:66.612.109.509.323.479.2]people with normal BMI were hypertensives.
TABLE 4
Comparison of serum cholesterol between hypertensives and
normotensives
Hypertensives Normotensives P value Remarks
Mean S.D Mean S.D
Serum
cholesterol
193 14.768 183.15 13.275 0.0024 significant
The average cholesterol in the hypertensive group was 193 ±
14.768 whereas the average cholesterol in the normotensive group was
183.15 ± 13.275.
P value was 0.0024 which was statistically significant.This
suggests that there was significant difference in the cholesterol levels
TABLE 5
Comparison of serum electrolytes between hypertensives and
normotensives
Hypertensives Normotensives
p value Remarks
Mean S.D Mean S.D
Serum Na 140.43 4.031 138.28 2.837 0.007 Significant
Serum K 3.90 0.387 3.79 0.287 0.127 Not significant
The average serum sodium in the hypertensive group was 140.43 ±
4.031 whereas the average serum sodium in the normotensive group was
138.28 ± 2.837.P value was 0.007 which was statistically significant.
The average serum potassium in the hypertensive group was 3.90 ±
0.387 while in the normotensive group it was 3.79 ± 0.287.P value was
0.126 which was not significant statistically.
There was significant difference in serum sodium levels among
hypertensives and normotensives. Serum sodium levels were higher in
hypertensives when compared to normotensives.There was no significant
TABLE 6
Comparison of serum calcium and phosphorus betweenhypertensives and
normotensives
Hypertensives Normotensives
P value Remarks
Mean S.D Mean S.D
Serum
calcium 9.590 0.534 9.440 0.605 0.2433 Not significant
Serum
phosphorus 3.755 0.295 3.680 0.272 0.2409 Not significant
The mean serum calcium in the hypertensive group was 9.590 with
a standard deviation of 0.534 while the mean serum calcium in the
normotensive group was 9.440 with a standard deviation of 0.605 .P
value was 0.2433 which was not significant.
The mean serum phosphorus in the hypertensive group was 3.755
with a standard deviation of 0.295 while the mean serum phosphorus in
the normotensive group was 3.680 with a standard deviation of 0.272.
P value was 0.2409 which was not significant.There was no significant
difference in serum Ca2+ and phosphorus levels among hypertensives and
TABLE 7
Comparison of glycemic levels between hypertensives and normotensives
Group No Mean S.D P value Remarks
Blood
Sugar
Cases 40 103.90 9.9403
0.4371 Not significant
Controls 40 102.45 6.2468
The mean blood sugar was 103.90 ± 9.9403 among cases and
102.45 ± 6.2468 in controls.P value was 0.4371 which indicates there was
no significant difference in the glycemic status of both the groups.
TABLE 8
Comparison of serum uric acid between hypertensives and normotensives
Group No