CLINICAL PROFILE AND OUTCOME OF STRESS
HYPERGLYCEMIA
IN CRITICALLY ILL CHILDREN
Dissertation submitted for
M.D DEGREE EXAMINATION
BRANCH VII – PAEDIATRIC MEDICNE
THE TAMILNADU Dr.M.G.R. MEDICAL UNIVERSITY
CHENNAI
APRIL 2015
INSTITUTE OF CHILD HEALTH AND
HOSPITAL FOR CHILDREN
MADRAS MEDICAL COLLEGE
CERTIFICATE
This is to certify that dissertation entitled “ clinical profile and outcome of stress hyperglycemia in critically ill children” submitted by Dr .R. Diana Grace to the faculty of paediatrics , The Tamilnadu Dr. M.G.R. Medical University , Chennai in partial fulfilment of the
requirement for the award of M.D. Degree (Paediatrics) is a bonafide research work carried out by her under direct supervision and guidance .
Unit chief / Guide
Department of Paediatrics Institute of child Health & Hospital for children
Professor and Head The Dean
Department of Paediatrics Madras Medical College Institute of child Health & Chennai
DECLARATION
I Dr. R. Diana Grace solemnly declare that the dissertation titled
“clinical profile and outcome of stress hyperglycemia in critically ill
children” has been prepared by me. This is submitted to the Tamilnadu Dr .M. G. R. Medical university , Chennai in partial fulfilment of the rules and regulations for the M. D. degree examination in Paediatrics.
Place:
ACKNOWLEDGEMENT
It is my immense pleasure that I express My heartful gratitude, admiration and sincere thanks to Prof. Dr. S. Sundari, Director,
Professor and Head of the department of Paediatrics for her guidance and support during the study.
I would like to thank my former unit chief
Prof . Dr.D.Guna Singh for his support and guidance during the study. I am greatly indebted to my teacher Dr. V. Poovazhagi, Associate Professor of paediatrics for her supervision , encouragement and guidance while doing the study.
I express my sincere thanks and gratitude to my chief
Prof. Dr. S. Sundari, for her support, guidance and constant encouragement throughout the study.
I also express my gratitude to Dr. S. Srinivasan , the medical registrar for his guidance.
I would like to thank my Assistant professors Dr. Luke Ravi Chelliah for his valuable suggestions and support. I would like to thank
Dr.A.Somasundaram , Dr. P. Sudhakar who guided me to a great extent. I also thank all the members of the dissertation committee for their
the critical analysis .
I thank the Dean Prof . Dr. R. Vimala, Madras Medical college, Chennai for permitting me to perform this Study.
CONTENTS
Sl.No TOPIC PAGE NO
1. INTRODUCTION 1
2. REVIEW OF LITERATURE 24
3. AIM OF THE STUDY 32
4. OBJECTIVES OF THE STUDY 33
5. STUDY JUSTIFICATION 34
6. MATERIALS & METHODS 35
7. ANALYSIS & RESULTS 44
8. DISCUSSION 107
9. CONCLUSION 112
10. LIMITATIONS 114
11. RECOMMENDATIONS 115
12. BIBLIOGRAPHY
13. ABBREVIATIONS
1
INTRODUCTION
“Hatred stirs up strife , But love covers all sins” Proverbs 10 : 12
“If hatred is deep within one’s own body as stress compounds like cortisol pour in to the system. These compounds will erode the natural, God given immune system that was created to help us fight off diseases”.
HYPERGLYCEMIA:
Origin of the term is greek . Hyper - meaning excessive, glyc –
sweet and emia – of the blood. SH (Stress hyperglycemia) otherwise called as stress diabetes or diabetes of injury is a term medically referring to elevation of blood glucose transiently due to the occurrence of stress in illness.
It generally resolves spontaneously , but must be distinguished from other forms of diabetes mellitus.
It is often discovered incidentally when routine blood sugar measurements revealed an elevated blood glucose. BG(Blood glucose) can be diagnosed either by a bedside glucometer or plasma glucose in the laboratory.
2
It is estimated that 49 – 70 % of children experiencing SH have BG concentration > 150 mg /dl, 20 – 35 % of children have BG > 200mg/dl.(1-7 ). Peak BG concentration can range as high as 172± 78 mg/dl to 283 ±115 mg /dl.( 1 ,2,6,15)
SH can remain prolonged for days in ICU admission. It is the peak and duration of SH to be linked with mortality. When compared with
survivors, non survivors have high BG concentration and they tend to have exposed to longer duration of SH.
Most common causes are septic shock, burns, traumatic brain injury, post
cardiac surgery and trauma (8 -14) . While all these studies revealed common association between SH and poor clinical outcome , they need not necessarily demonstrate a cause and effect relationship.
Elevation of BG level in the scenario of critical illness or injury was first described more than a century ago. The incidence of SH is difficult to establish because there is no strict definition exist of what BG level defining hyperglycemia.
3
HPA axis leading to increased glucocorticoid levels .TNF α also induces insulin resistance directly.
SH in children need to be studied to determine whether it has developing risk of type 1 DM. Bhisitkul et al follow 30 patients in PED at the time of evaluation who had hyperglycemia. One patient had insulin auto antibodies. None of the 30 patients had diabetes over the next three
years. Overall the occurrence of SH in critical illness does not put a child at high risk for duration of type 1 DM.
In 1990,vardi et al observed 12 patients who referred for SH. Out
of them 4 had type 1 Diabetes markers and all those 4 developed diabetes.(32)
A unique feature of critical illness is disturbed homeostasis. Thus
in intensive care unit , a dictim is the notion that normalising of physiological disturbance will hasten recovery. (33)
Alterations in BG levels are the frequently encountered disturbances in critically ill children. SH is nothing but a fight or flight
4
EFFECTS OF STRESS
GLUCOSE TOXICITY
IMMUNE DYSFUNCTION THROMBOSIS
ISCHEMIA ACIDOSIS INFECTION
TISSUE INFLAMMATION
HYPERGLYCEMIA
RISE IN FFA KETOSIS INCREASED
LACTATE REDUCED PANCREATIC
Β CELL INSULIN OUTPUT INCREASED CATECHOLAMINES
5
SH is associated with increased mortality, prolonged ICU stay and many other complications. The thing important is whether SH is related only to disease severity or an independent risk factor leading to morbidity
and mortality. If SH is considered to be an independent risk factor ,then TGC( Tight Glucose control) may modify effects on morbidity and mortality. Conversely if hyperglycemia is not to be a risk factor per se, then the risks of glucose control may outweigh the beneficial effects.(34)
IIT(Intensive Insulin Therapy) appeared to be the magic wand that has promoted a good outcome in critically ill children. However the
magic was short lived and benefits in case of TGC can not be produced in large multicentric trials.(34)
6
The classification of DM is modified to reflect categories in childhood such as type 2 DM , cystic fibrosis related diabetes and drug induced diabetes . Among the insulin dependent forms in genetically
predisposed hosts, lack of insulin secretion results from auto immune destruction of islets, formally called as juvenile onset diabetes .(37,38,39 )
Type 1 diabetes is particularly distinct by the association with
HLAs and genetic markers by the presence of circulating antibodies to components of islet cells , antibodies to glutamic acid decarboxylase etc.
Type 1 diabetes has no apparent correlation with socioeconomic
status. There is no sex predilection. It has presentation in two extremes of age, at 5 – 7 yrs of age and at the time of puberty.
The incidence of type 1 diabetes is increasing worldwide especially
in certain population and certain age groups . In younger patients onset of disease tends to be more abrupt and detection of immune markers is less apparent than in older children. (40)
Seasonal and long term cyclical variations have been detected in
7
Sometimes episodes of mumps , rubella , coxsackie virus have increased incidence of type 1 DM . These viruses directly attacking β
cells or by triggering immune response to other endocrine tissues .
Early introduction of cow’s milk may be another factor in triggering diabetes . Antecedent stress and if exposed to chemical toxins have been documented in development of type 1 diabetes.
As improvement in technology continuing , the population based screening for antibody markers will be available to detect children at risk for type 1 diabetes . Such screening would be justified ethically if preventive measures could be proven effective .
A study conducted involves 3000 families who avoided cow’s milk for the first nine months of life to evaluate the hypothesis that ingestion
of breast milk and avoidance of cow’s milk will protect the children in that study from development of diabetes.(42,43 )
Children in whom we consider that they have diabetes mellitus be divided in to three general classes :
1. Those who have history of diabetes with symptoms such as polyuria , polydypsia and failure to thrive.
8
3. Those who have clinical features suggestive of metabolic acidosis with or without stupor or coma.
The idenfication of glycosuria with or without mild elevation of hyperglycemia at time of hospital admission in case of infection , trauma may herald the presence of diabetes. In most of the circumstances the glycosuria will remit during recovery.
These circumstances may be unmasked by increased plasma levels of stress hormones . Those children should be rechecked for the possibility of hyperglycemia at a later date.
If those children have a positive family history of DM in two
preceding generations , then it indicates the possibility if MODY syndrome. At those times Glucose tolerance test will be useful to make a
diagnosis. But it should be performed several weeks after recovery from the acute illness.
Transient hyperglycemia is common in children with asthma treated with epinephrine and steroids . Among those children who
9
MONITORING OF BLOOD GLUCOSE
There are certain brands of glucose meters available commercially, most of them are accurate within 5 – 10 % of laboratory values. Usually we utilise glucose oxidase based electro chemical methods.
Those glucometers are fast which we get results in 5 seconds and they require minimum amount of blood ( 0.1 ml ).
The requirement of minimal volume of blood has made to test in
alternate sites and minimise discomfort and improve compliance to self monitoring regimen. Information obtained from frequent testing is used to titrate insulin doses .
Finger stick capillary BG measurement is typical when using a meter, although meters may introduce error and bias in the BG value.
Samples taken from arterial site are very much similar to laboratory plasma or blood gas analyser BG values . Finger stick capillary
10
Pathophysiology of SH:
Acute stress
response
Exogenous
contributors
Medications Glucocorticoids
Vasopressors
Nutrition Total parentral nutrition
Enteral nutrition Glucose administration
Endogenous contributors
Increased Counter regulatory hormones
Glucagon, epinephrine, cortisol, growth hormone,
norepinephrine
Increased cytokines, oxidative metabolism Nonoxidative metabolism
11
Certain factors like hypoxia, oxidative stress, systemic inflammation, reduced blood flow cause injury to the cellular environment in critical illness.
In critical illness ,SH is due to 2 factors
1.Increased gluconeogenesis
2.Developement of insulin resistance (16)
Mediated by increase in counter regulatory hormones ( as shown in
the box) and pro inflammatory cytokines like IL-1 , IL- 6 ,TNF –α (17,18).
Also pro inflammatory cytokines directly inhibit insulin secretion by pancreatic β cells through stimulation of α adrenergic receptors (19).
12
Stress of Critical Illness
Cortisol, Epinephrine Inflammatory cytokines Norepinephrine, Glucagon ( IL -1, IL- 6, TNF – α) Growth Hormone
LIVER MUSCLE ADIPOSE TISSUE
Type equation here. INCREASE IN GLUCONEOGENESIS
PROTEOLYSIS
LIPOLYSIS
INSULIN RESISTANCE ALANINE
GLYCOGENOLYSIS ( EARLY )
13
Alterations in Glucose Metabolism:
Normally, a balanced combination of glycogenolysis and
gluconeogenesis maintains BG concentration . During stress , increased concentration of counterregulatory hormones and proinflammatory cytokines mediate glycogenolysis and gluconeogenesis , leading on to elevated BG concentration.
The surge in catecholamine results in increased levels of glucagon to maintain gluconeogenesis even in the presence of higher insulin levels(20) . kidney remains as important source of gluconeogenesis in
critical illness and account for 40 % hyperglycemia in response to catecholamines.(21)
Also increase in GH , decrease in IGF – 1 facilitate the breakdown
14
Alterations in Insulin Sensitivity and Secretion:
Critical illness have both central and peripheral insulin resistance. Central insulin resistance mediated by glucagon , epinephrine and cortisol taking place at liver results in sustaining of hepatic gluconeogenesis even at increased levels of insulin(20). It is also associated with increase in GH and reduction in IGF – I(22).
Peripheral insulin resistance takes place in adipose tissue and muscle mediated by counterregulatory hormones and inflammatory cytokines due to alteration in insulin signalling pathway . The Hormones
in critical illness impair the translocation of the insulin dependent glucose transporter (GLUT – 4) from internal membrane stores and reduce insulin binding (23,24).
Inflammatory cytokines affect serine phosphorylation of insulin receptor substrate and inhibit insulin receptor tyrosine kinase, decreasing glucose utilisation via GLUT 4(25,26). After recovery from critical illness
in children , peripheral insulin resistance may get prolonged for a period of time(2). Besides insulin resistance, studies have also show abnormalities in pancreatic β cell function and decreased insulin secretion
15
Stress and Hormones
In modern environment stress tends to alter the equilibrium between a living organism and its environment . In our day to day life there are certain stressful environment such as stress of work pressure, examination, psycho social stress and physical stresses due to trauma , surgery and various medical disorders.
Stress can involve changes in blood level of many hormones like glucocorticoids ,catecholamines , growth hormones and prolactin . Some
of these response to stress can lead to development of endocrine disorders like grave’s disease , gonadal dysfunction and psychosexual dwarfism and obesity.
The growth hormone level is increased during acute conditions of stress. The levels can increase the hormones up to 2 – 10 fold. As the insulin has antagonistic effect , growth hormone may increase metabolic activity . (44)
During stress insulin may get decreased . This along with effect of antagonistic hormone can lead to SH . (45) Severe stress may also be a risk factor for diabetes . Children with age group 5 – 9 yrs with stress were
16
Stress may also be associated with behavioural abnormalities and in the form of failure to thrive . The organic incapability of confronting stress on a genetic basis and upon repeated stresses , make some group of children liable to suffer from depressive symptoms .
Mental stress activates neuroendocrine system. Cortisol accentuates central fat deposition , decreases the signal of leptin and
increases the ghrelin signal activating appetite and food intake .Stress genes selected under pressure have not adapted to the present environmental changes. (47)
SH and Harm:
Normally increased BG concentration down regulate insulin dependent GLUT 1, GLUT 2,GLUT3 to prevent cellular glucose overload. In contrast, overexpression of these transporters in critical illness causing glucose overload and toxicity in organs system like central and peripheral nervous system, endothelial, hepatic and immune cells, renal tubules and gastrointestinal mucosa .(30)
Increased glucose overload leads to excessive glycolysis and oxidative phosphorylation with increased products of reactive oxygen
17
Recent studies revealed a role of immune system in development of insulin resistance in critical illness children. A comprehensive review was conducted on the literatures published on the effects of
hyperglycemia and insulin on innate immunity. If any alteration in glucose and insulin regulation occurs , it affects the immune function of cellular components.
Innate immune system dysfunction offers higher morbidity and mortality in critical illness. In case of SH children receiving insulin, reduction in morbidity and mortality observed due to its effects on the
accentuation of immune response. But there is controversy regarding moderate versus intensive insulin treatment.
Future studies will determine the effects of hyperglycemia and insulin on the regulation of innate immunity to prove more effective
insulin treatment regime for this children. There are someother treatment regime like use of metformin , glucagon like peptide 1 , analogue of exenatide for SH (48). Fenofibrate decreases the insulin resistance and if used in combination with insulin improves insulin signalling, oxidation of
glucose and mitochondrial function .(49 )
18
Stress Hyperglycemia and Intensive Care Unit:
During critical illness certain specific interventions in ICU such as Mechanical ventilation, vasoactive infusions, renal replacement therapies, cardiopulmonary bypass, prolonged immobility, medications can mediate development of SH.
Stress Hyperglycemia and Mechanical Ventilation:
SH commonly associated with mechanical ventilation in paediatric
critical illness is around 60 - 89 % of patients ( 1,4,6,15). Mechanical ventilation is inducing both pulmonary and systemic cytokine responses in addition with shear stress and barotraumas .These changes in turn result in development of SH , especially in multiorgan dysfunction . SH
19
Stress Hyperglycemia and Vasoactive Infusions:
Use of vasoactive infusions in paediatric ICU care settings can result in SH (51) .There is one study conducted in 2009 revealing 90 % of children with critical ill pattern requiring vaso active infusions such as epinephrine , norepinephrine and dopamine have BG > 140 mg /dl (6) .
Epinephrine administration causes SH in ICU via changes in glucose metabolism and development of insulin resistance .Norepinephrine and dopamine have lower potential at β 2 receptors to cause SH(51 ).
Stress Hyperglycemia and Prolonged Immobility:
SH may influence occurrence of critical illness related
neuromuscular dysfunction via apoptosis and mitochondrial oxidative damage to cause immobility (52). Critical illness causing neuromuscular dysfunction is not significant in children due to underdiagnosis(53 ).
Stress Hyperglycemia and Nutritional Support :
Children in SH are often given parenteral nutrition for many reasons such as inability to tolerate enteral nutrition etc .Excess carbohydrate calories in PN can mediate the development of SH. While infants and children have glucose turn over rate higher than adults (54),
20
Moreover BG concentration may not reflecting accurately glucose turnover and utilisation (55). Regardless of whether PN or EN is considered as the mode of nutrition, overfeeding is practised in critically
illchildren during times of acute stress that may contribute to SH (56).In contrast supplementing PN with glutamine and prescribing low calorie PN, may decrease the occurrence of SH during critical illness (57).
SH can also cause delayed gastric emptying and slows down gut motility even if there is no DM (58). SH can decrease the prokinetic action of erythromycin on gastric emptying (59).SH also causes nutrient
utilisation alterations at times of critical illness. SH exacerbates catabolism of proteins in skeletal muscles in case of burns . SH also decreases the action of lipoprotein lipase causing hypertriglyceridimia through decreased clearance of circulating triglycerides (60 ).
Stress Hyperglycemia and Medications:
Certain medications like glucocorticoids increase the risk of SH
especially if administered in pulse doses in critically ill children. Glucocorticoids increases gluconeogenesis , insulin resistance and
21
Newer atypical antipsychotics like clozapine and olanzipine also causes SH , DM and DKA. Other drugs like antibiotics and antifungals mixed in large volume of solutions containing dextrose are associated with SH.
Tight Glucose Control in Critical Illness:
In critically ill children especially recovering from cardiac surgeries , the study of TGC has observed reductions in length of stay in ICU and mortality but increase in hypoglycaemia . In paediatric ICU even though there are greater risks of iatrogenic hypoglycaemia, most
practitioners agree that SH is likely harmful and better avoided in critically ill children (63 ).
One study conducted in united kingdom in PICU in 1500 critically ill children about the impact of TGC on number of days alive and freed of support by ventilator at 30 days who are ventilated mechanically and also on vasoactive infusions (64 )
22
One more study conducted in PICU at Emory children’s centre about the impact of TGC on improvement of organ function by measuring paediatric logistic organ dysfunction course in 1004 critically ill children with hyperglycemia (65).
These studies hopefully enlighten the timing of initiation of TGC , target population of interest, optimum target BG range for TGC, optimum
protocol for BG range without causing hypoglycaemia in critically ill children .
Stress Hyperglycemia and IGFBP – 1 :
Usually high serum cortisol and low T 3 indicate poor prognosis in acutely ill children .But these markers lack sensitivity in case of
prolonged critically ill children. Whether high serum concentrations of IGFBP –1 indicate the outcome of critical illness in chronic state better is controversial.
IGFBP -1 , produced by liver is regulated acutely by metabolic stimuli. Insulin ,the inhibitory influence on IGFBP -1 and hepatic substrate deprivation , stimulatory influence acting through a cyclic AMP dependent mechanism .
23
insulin concentration compared with survivors , for that same level of BG, considering those patients are thought to be insulin resistant .
The trigger for these factors are decreased hepatocyte substrate availability due to hepatic hypoperfusion, hypoxia, hypoglycaemia, relative insulin deficiency or insulin resistance all leading to increased cyclic AMP production , which would suppress IGF 1 and stimulate IGFBP-1.
It is not understood that why some children failed to recover and die even though optimum intensive care being given. High serum
IGFBP-1 level , low circulating insulin levels and adverse outcome of critical illness denotes that certain effects of insulin in the liver may be essential for recovery and survival. This generated the hypothesis that treatment with insulin may give therapeutic potential to improve the outcome of critical illness.
By controlling hyperglycemia with insulin restores the already impaired immunity by preventing the disturbed phagocytic capacity of monocytes. SH in critically ill children is also associated with altered
24
REVIEW OF LITERATURE
ANALYSIS OF PUBLISHED REPORTS :
Deepak et al observed children with traumatic brain injury had
prevalence of 28 % transient hyperglycemia and 17 % of persistent hyperglycemia.
In Kenya , osier et al observed children outside the neonatal period with 2.9 % prevalence of SH (66,67).
Bhisikul et al found children with temperature > 39.5 degree Celsius had SH in 9.3 % ,24.1% in critical care unit and 6 % children receiving intravenous fluids (68 ) .
In Kenya hyperglycemia is prevalent in certain disease conditions.49.4 % children presented with SH in malaria , 12.9 % cases of gastroenteritis , 7.5 % of burns and 11.8 % of lower respiratory infections.
Klein et al compared survivors and non survivors of SH and report
25
Edward Vincent et al study on persistent hyperglycemia in critically ill children revealed prevalence of SH was 16.7 % to 75 %and length of stay was increased for maximum glucose within 10 days .
Patki and chocyle et al study on hyperglycemia in critically ill children, analysed 101 nondiabetes children in age group of 1 month – 16 yrs revealed 70 had hyperglycemia. They found incidences of
hyperglycemia in respiratory disease was 64 %, diarrhoea – 62.5 %, Neurological cases – 71.4 %, infection – 81.8 % and miscellaneous -64 %. Requirement of ventilator, inotropic support and length of stay
increased with SH in their study and P value was 0.05 and increased mortality – 28.6 % versus 3.2 %among hyperglycemia. 67.2 % has hyperglycemia at admission and remaining 23 developed during the stay and median duration of SH was 72 hrs.
MD Donna , Bhisitkul et al study on prevalence of stress hyperglycemia among patient attending PED , found that SH associated with severity of illness as measured by elevated temperature > 39.5
c(9.3%) vs (2.8 %)- normal temperature, children on admission 24.1 % vs 2.6 % not on admission and children who received intravenous fluids 6.0 %vs 2.7 % not on Intravenous fluids.(68)
26
Srinivasan vijay et al conducted a study on 152 critically ill children receiving ventilator and inotropic support in university affiliated tertiary care, children’s hospital measured the association of timing, duration and intensity of hyperglycemia in critically ill children.(70)
They found that non survivors had more hyperglycemia in the initial 48 hours (126±38 mg/dl) vs survivors (116±34mg/dl),P <0.05.
Their study showed that peak BG and duration and intensity of hyperglycemia were each associated with mortality with univariate logistic regression (P<0.05).
Valerio franzese et al study on 833 children about prevelance of SH in cases of febrile seizures and traumatic injuries. Stress exposed patients had significantly more glycemic levels than controls (p<0.0001). SH was more in children with febrile seizures (12.9%) or traumatic
injuries (11.7%) P<0.008 and P<0.02 respectively Vs other diagnosis. They found that significant correlation between glycemia and systolic pressure (r =0.1 ; p <0.01) , white cell count (r =0.12;p <0.0003) and body temperature ( r =0.16; p <0.0001) was made.
Arthur et al studies the relationship of BG and outcome of patients suffering from head injury in department of neurosurgery and
27
concluded that elevated BG may aggravate ischemic insult and neurological outcome has been worsened in such patients.
Branco et al study on glucose level and risk of mortality in paediatric septic shock conducted in a twelve bed PICU at brazil revealed that peak BG level in sepsis children was 178 mg/dl( sensitivity 0.714;specificity 0.724) and relative risk was 2.59 in children with peak BG level >178 mg/dl.
Weiss , scott et al analysed 72 cases of ESH and observed that respiratory illness 49 %,trauma 15%, seizures 8% associated with ESH.
The overall mortality rate was 22%. They found that ESH > 300 mg /dl is a marker of second illness and high mortality. But they found that no association was found with subsequent diagnosis of DM.
Raymonde joseph Richard et al studied 63 children to determine the risk of acquiring IDDM in case of transient hyperglycemia. IDDM developed in 32 % of children with transient hyperglycemia in absence of seizure illness, compared with 2.3 % of children with serious illness ( rr 13.9 ; (C.I 7) so they concluded in case of serious intercurrent illness , the
28
Vardi et al observed 12 patients referred for SH. Out of them , 4 had markers of type 1 DM and all the 4 developed diabetes.
Bhisitkul et al followed 30 patients with hyperglycemia at the time of evaluation. Out of these , 1 patient had insulin auto antibodies. None of
the 30 patients had developed diabetes over the next 30 years . Most recent studies do not have support for increased risk.
Gerigofordhil et al ,assement centre of Mulago hospital enrolled 382 children in 2011 with a median age of 19.5 months and 1:1 sex ratio .
The prevalence of SH was 28.8 % and the factors associated with hyperglycemia were : History of convulsions ( p = 0.008) and
temperature > 37.5 degree Celsius( p < 0.001).The study recommended paediatricians to have high index of suspicion with history of convulsions and with temperature > 37.5 degree Celsius.
Guillermo et al observed in2002 that 29 % of children had
prevalence of hyper glycemia admitted to ICU ,had a longer stay in hospital when compared with 9 % in normoglycemic patients .
In PICU Rakesh et al in India observed prevalence of SH was 27.7% in critically ill children . Children admitted in ICU with severe
29
Osier et al and Guillermo et al both concluded that SH is associated with increased mortality rate of 14 % and 16 % when compared to 38.7 % and 3 % in children with normal BG respectively. Wiegand et al observed 7.5 % with SH had prevalence of impaired glucose tolerance and 1.2 % of DM.
Keu et al and drobac et al both noted 3 % prevalence of impaired glucose tolerance in paediatric clinic. A multicentre Italian study done by
Renata and Alibrandi et al in department of paediatrics in Genoa to determine incidental hyperglycenia are at increased risk of developing type 1 diabetes . 748 subjects from 1 -18 yrs of age with no family history of diabetes without obesity were included.
Incidental high BG more than 5.6 millimoles / litre were confirmed and were tested for metabolic , immunogenic markers of diabetes. The HLA – DR 3 and HLA – DR 4 were more frequent in
hyperglycaemic children than in normal controls ( P = 0.012 & P = 0.005) respectively . All had one or more islet autoantibody and majority had impaired insulin response and genetic susceptibility to type 1 diabetes.
Raymonde Herskowitz – Dumonte et al conducted a study
30
acquiring IDDM . He concluded that transient hyperglycemia occurs during serious intercurrent illness and risk of development of IDDM is low. In contrast one third of children with transient hyperglycemia without serious illness can have IDDM within 1 yr.
A case report by Tall oron et al on SH : A sign of familial diabetes in children . He studied two unrelated boys , one aged 2 yrs 7 months and
the other aged 5 days were evaluated in emergency department for febrile infections and found to have elevated BG of 238 and 150 mgm/dl respectively. Both have family history of diabetes . With persistent
elevated BG levels in these children and positive history of DM leads us to perform further work up and found to have monogenic diabetes. Therefore we assume that the elevated glucose levels detected in our
children were attributable to the combination of genetic defects and the stress response.
31
COMPARISON OF STUDIES
AUTHOR & YEAR
HYPERGLYCEMIA ( mg/dl)
INCIDENCE
Srinivasan et al – 2004
>126 86 %
Faustino et al - 2005 > 120 75%
>200 16.7% Wintergerst et al –
2006
>110 86.5%
>150 61%
>200 35.2%
Allen et al - 2008 >110 95%
32
AIM OF THE STUDY
1. To study the incidence of stress hyperglycemia in critically ill children
2. To find out the risk factors of stress hyperglycemia
3. To determine the risk factors associated with mortality
33
OBJECTIVES OF THE STUDY
I want to study the incidence of SH as it varies from outpatient
clinic to emergency settings.
To identify the etiology , clinical features and risk factors associated with SH
34
STUDY JUSTIFICATION
The outcome of SH depends upon the etiology and risk factors.
Identification of those risk factors will help us to reduce the mortality and severity of morbidity .
Literature from south Indian data about risk factors and severity of SH are few.
Outcome of this study will help us to identify the common causes , risk factors associated with SH.
By knowing the incidence of SH in critically ill children and the mortality burden , we can able to plan the management according to the protocol in ICH and plan whether TGC is helpful in reducing mortality.
My study will bring out the results so that reasonable steps would have been taken to minimise multiorgan dysfunction.
35
MATERIALS & METHODS
STUDY DESIGN:
Descriptive study
STUDY CENTRE:
This study was conducted in the Institute of child Health and Hospital for children , Madras Medical College, Chennai
STUDY PERIOD:
The study was carried out prospectively from February 2013 to
August 2014.
STUDY POPULATION:
All children admitted with SH in Institute of Child Health
INCLUSION CRITERIA:
36
EXCLUSION CRITERIA:
All neonates / known or new diabetes mellitus / long term steroid therapy.
CONFLICT OF INTEREST : Nil FINANCIAL SUPPORT : Nil
ETHICAL COMMITTEE CLEARENCE : Obtained
METHODOLOGY :
Children were enrolled on the basis of inclusion criteria after obtaining written informed consent from the parents .
The inclusion criteria is 2 months to 12 years children presented with SH admitted either in PICU or in general medical ward , ICH & HC.
PROCEDURE :
All critically ill children entering into emergency room were
37
Those children with initial high BG were included in the study and after obtaining consent from the parents , obtained history regarding risk factors and physical examination done and other investigations pertaining to diagnosis were entered in the proforma.
Parent counselling was done daily throughout the hospital stay of the child. According to the diagnosis , investigations like complete blood
count , renal function test, liver function test , blood culture, urine culture, chest X ray and electrolytes were done. Also CSF – counts , protein, sugar, culture and CT brain were included in those investigations.
Investigations were done in ICH , Egmore and diagnosis was made by standard definitions . Treatment was given according to protocol followed in ICH and expected outcome was documented as death or discharge .
38
STATISTICAL METHODS
The information collected from the children were recorded in data collection form who fulfils the inclusion criteria. Those were plotted in the properly prepared excel sheet .With the help of computer data, analysis was done using Epidemiological Information Package.
Using SPSS software frequencies, means, percentage, standard deviations, chi-square,co-efficient of correlation values and p value were calculated. Chi-square test was used to estimate the significance of difference between quantitative variables and p value less than 0.05 is
being taken as significant.
ANALYSIS
39
CASE DEFINITIONS
STRESS HYPERGLYCEMIA
Stress hyperglycemia is defined as any blood glucose value above
the normal range in conditions of stress. No guidelines specifically define SH. In my study SH was considered if blood glucose value more than 200 mg /dl.
CRITICALLY ILL CHILDREN
Critically ill children are defined as those children who are triaged to be treated in emergency room
ETIOLOGY SEPSIS
Sepsis is considered when high fever , hot flushed skin,
tachycardia, altered mental status accompanied with abnormal perfusion. Septic shock is severe sepsis ( sepsis induced organ dysfunction) with persistently low blood pressure.
ACUTE CNS INFECTION
40
HYPOXIC ENCEPHALOPATHY
Encephalopathy following ischemia or hypoxia like near drowning, acute haemorrhage and accidental airway obstruction.
FEBRILE ENCEPHALOPATHY
Febrile encephalopathy is defined as having fever, seizures and/or altered level of consciousness in children.
FEBRILE SEIZURES
Febrile seizures are seizures between the age of 6-60 months
associated with fever of > 38 degree Celsius, not due to CNS infection, metabolic disturbance in absence of prior history of afebrile seizures with normal CT brain and Lumbar puncture.
BRONCHOPNEUMONIA
Bronchopneumonia is defined as type of pneumonia characterised
by multiple foci of consolidation affecting one or more pulmonary lobules confirmed by fever, tachypnea, tachycardia, bronchial breathing and abnormal CXR.
INTRACRANIAL BLEED
41
SEIZURE DISORDER
Seizure disorder is considered to be present when more than 2 unprovoked seizures occur in a time frame of > 24 hrs.
ASTHMA
Asthma is defined as episodic airflow obstruction with airway hyper responsiveness to provocative exposure with intermittent, recurrent wheezing and/or coughing, worse at night relieved with bronchodilators.
BRONCHIOLITIS
Bronchiolitis is predominantly a viral disease, characterised by bronchiolar wall thickening affecting airflow with a minor respiratory syndrome within the previous week with respiratory distress, paroxysmal wheezy cough, fever, dyspnea and irritability.
CLINICAL PARAMETERS:
HEART RATE:
Heart rate as defined for the child’s appropriate age ( defined from PALS)
2 months to 2 yrs : 100 – 190
2 yrs to 10 yrs : 60 – 140
42
RESPIRATORY RATE :
Respiratory rate as defined for the child’s age
<1 yr : 30 – 60 1 -3 yrs : 24 – 40 4 -5 yrs : 22 – 34 6 – 12 yrs : 18 – 30
BLOOD PRESSURE :
Blood pressure as defined in PALS from 5th to 95th percentile for systolic and diastolic BP according to age and gender .
AVPU PAEDIATRIC RESPONSE SCALE :
AVPU scale is a system for rating child’s level of consciousness , an indicator of cerebral cortex function.
Alert – awake , active ,responsive to parents and external stimuli Voice - child responds only to voice
43
CRT :
Capillary refill time is evaluated by lifting the extremity slightly above the level of heart , press on the skin and rapidly release the pressure. Note how many seconds it takes for the area to return to its baseline colour.
<2 seconds – normal >2 seconds – abnormal
LABORATORY PARAMETERS:
Total count – 4000 – 12000 Platelet count – 1.5 – 4 lakhs
NEC – as defined by the culture positivity Urine C/S - as defined by the culture positivity
CXR –as defined by abnormal X ray findings by radiologist Urea : 7 – 18 mg /dl
Creatinine : 0.03 – 0.59 mg /dl Sodium : 135 – 145 mmol /dl Potassium : 3.5 -4.5 mmol/l Bicarbonate : 22 – 29 meq/l
LFT – Total bilirubin : < 1 mg /dl SGOT: 15 – 50U/L
44
ANALYSIS & RESULTS
DESCRIPTIVE DATA OF STUDY GROUP
Sl.no Variable Classification Counts
( 102 )
1. Age
< 1 yr 55
1 – 5 yr 37
>5 yr 10
2. Sex Males 60
Females 42
3. Socioeconomic status <5000 12
5000 – 10000 90
4. Anthropometry Normal 91
Low 11
5. Fever Present 70
Absent 32
6. Breathlessness Present 51
Absent 51
7. Seizures Present 35
Absent 67
8. ALOC Present 78
Absent 24
9. Vomiting Present 17
Absent 85
10. Loose stools Present 8
45
Sl.no Variable Classification Counts
( 102 )
11. Family history of diabetes
Present 10
Absent 92
12. Heart rate
Abnormal 87
Normal 15
13. Respiratory rate Abnormal 91
Normal 11
14. Blood pressure
Abnormal 38
Normal 64
15. Temperature Abnormal 47
Normal 55
16. CRT
<2 second 52
>2 second 50
17. AVPU
Alert 2
Verbal 27
Pain responsive 33
unresponsive 40
18. Total count
Normal 71
Abnormal 31
19. Platelet count
Normal 94
Abnormal 8
20. NEC
No growth 99
Growth 3
21. Urine C /S No growth 97
46
Sl.no Variable Classification Counts
( 102 )
22. CXR
Normal 74
Abnormal 28
23. Urea
Normal 83
High 19
24. Creatinine Normal 86
High 16
25. LFT Normal 96
Abnormal 6
26. Sodium Normal 86
Abnormal 26
27. Potassium Normal 77
Abnormal 25
28. Bicarbonate Normal 90
Low 12
29. Blood sugar
<6 hrs 60
6 – 24 hrs 25
24 – 48 hrs 6
>48 hrs 11
30. Treated in
Ward 47
PICU 55
31. Etiology
Sepsis 30
Seizure disorder 14 Acute CNS infections 11
47
[image:55.595.103.530.171.404.2]RESULTS
TABLE – 1 AGE GROUP AND OUTCOME
Chi -square value = 17.465 P = 0.001 significant In my study 54 % of children were infants , in which 60 % ( 33 out of 55) were expired . In 1 – 5 yrs age group , around 81 % ( 30 out of
37 ) were recovered and discharged , only 19 % were expired . In > 5 yrs of age 80 % were recovered and 20 % ( 2 / 10 ) were expired. So , higher age group have better outcome. Age group has statistical significance with outcome.
Outcome
Total
Discharge Death
Age group
< 1 yr 22 33 55
40% 60 % 100%
1 – 5 yr 30 7 37
81.08% 18.92% 100%
> 5 yr 8 2 10
80 % 20 % 100 %
Total
60 42 102
48
AGE GROUP AND OUTCOME
22
30
8
33
7
2
0 5 10 15 20 25 30 35
<1 yr 1 - 5 yr >5 yr
Discharge
49
TABLE – 2 SEX AND OUTCOME
Chi – square value = 0.280 P = 0.597 NS
Of the 102 children 60 were males and 42 were females but sex
was not statistically significant .
Outcome
Total
Discharge Death
Sex Male
34 26 60
56.6 % 43.4 % 100%
Female 26 16 42
61.9 % 38.1% 100%
Total
60 42 102
50
SEX AND OUTCOME
34
26
26
16
0
5
10
15
20
25
30
35
40
MALE
FEMALE
51
TABLE – 3
SOCIOECONOMIC STATUS AND OUTCOME
Chi – square = 1.653 P = 0.199 NS
88.23% (90 /102) of the children were come under income of Rs . 5,000 to 10,000. But it is not statistically significant.
Outcome
Total
Discharge Death
Socio economic
status
< 5000 5 7 12
41.7% 58.3% 100%
5000 - 10000
55 35 90
61.1% 38.9% 100%
>10000 0 0 0
0% 0 % 0%
Total
60 42 102
52
TABLE – 4
ANTHROPOMETRY AND OUTCOME
Chi – square = 2.568 P = 0.109 NS
89.2 % ( 91 out of 102 ) had normal anthropometric measurements.
Outcome
Total
Discharge Death
Anthro pometry
Normal 56 35 91
61.5% 38.5% 100%
Low 4 7 11
36.3% 63.7% 100%
Total
60 42 102
53
TABLE – 5
FEVER AND OUTCOME
Chi – square = 3.279 P = 0.070 NS
In my study 68.6 % (70 /102) of children had fever . Out of which 47.1 % (33/37) were expired. So most of the children presented with SH
had fever.Out of which half of children had mortality. But it is not statistically significant.
Outcome
Total
Discharge Death
Fever
Absent 23 9 32
71.9% 28.1 % 100%
Present 37 33 70
52.9% 47.1% 100%
Total
60 42 102
54
TABLE – 6
FEVER DURATION AND OUTCOME
Chi – square = 1.131 P = 0.568 NS
47.1 % of children presented with SH had fever of 24 – 72 hrs duration and out of which 48.5 % were expired . Fever duration is not statistically significant.
Outcome
Total
Discharge Death
Fever duration
<24 hrs
16 11 27
59.3% 40.7% 100%
24 – 72 hrs
17 16 33
51.5% 48.5% 100%
>72 hrs 4 6 10
40% 60 % 100 %
Total
37 33 70
55
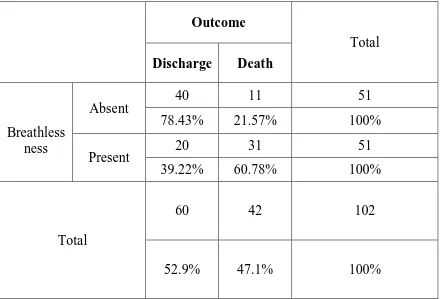
TABLE – 7
BREATHLESSNESS AND OUTCOME
Chi – square = 16.190 P =0.001 significant
Half of children (50%) with SH presented with breathlessness. Out of which 60.78 % were expired and it is statistically significant.
Outcome
Total
Discharge Death
Breathless ness
Absent
40 11 51
78.43% 21.57% 100%
Present 20 31 51
39.22% 60.78% 100%
Total
60 42 102
56
BREATHLESSNESS AND OUTCOME
0 5 10 15 20 25 30 35 40
ABSENT PRESENT
40
20
11
31
57
TABLE – 8
BREATHLESSNESS DURATION AND OUTCOME
Chi square value = 2.847 P = 0.241 NS
60.7 % (31/51) of children presented with breathlessness of < 24 hrs duration. Out of which 51.61% were expired and 48.39 % were recovered. But it was not statistically significant.
Outcome
Total
Discharge Death
Breathless ness duration
<24 hrs 15 16 31
48.39% 51.61% 100% 24 – 72
hrs
3 10 13
23.08% 76.92% 100%
>72 hrs 2 5 7
28.57% 71.43% 100 %
Total
20 31 51
58
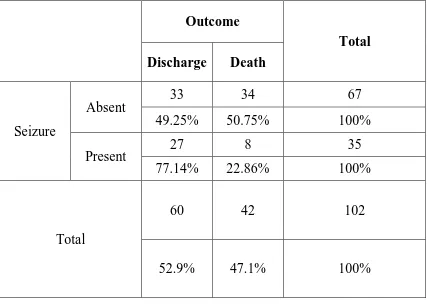
TABLE – 9
SEIZURE AND OUTCOME
Chi square value = 7.383 P = 0.007 significant
65. 6% children ( 67/102) had no seizures . Only 34.3 % of children had
seizures , out of which 77.14% were discharged and 22.86% were expired. But study is statistically significant.
Outcome
Total
Discharge Death
Seizure
Absent 33 34 67
49.25% 50.75% 100%
Present 27 8 35
77.14% 22.86% 100%
Total
60 42 102
59
SEIZURE AND OUTCOME
0% 10% 20% 30% 40% 50% 60% 70% 80% 90% 100%
ABSENT PRESENT
33
27
34
8
60
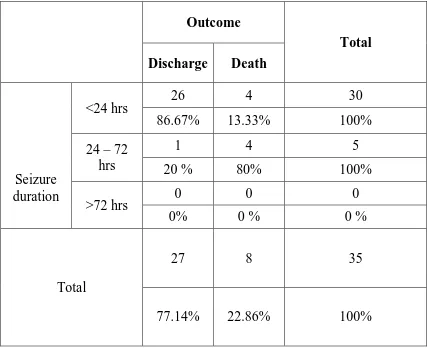
TABLE – 10
SEIZURE DURATION AND OUTCOME
Chi square = 10.802 P = 0.001 significant
85.7% of children presented with seizures had < 24 hrs duration, out of which 86.67 % were recovered . Duration of seizures has statistical significance with outcome.
Outcome
Total
Discharge Death
Seizure duration
<24 hrs 26 4 30
86.67% 13.33% 100% 24 – 72
hrs
1 4 5
20 % 80% 100%
>72 hrs 0 0 0
0% 0 % 0 %
Total
27 8 35
61
SEIZURE DURATION AND OUTCOME
0 5 10 15 20 25 30
<24 HRS 24 - 72 HRS >72 HRS
26 1
0
4 4
0
DISCHARGE
62
TABLE – 11
ALOC AND OUTCOME
Chi square = 13.977 P = 0.001 Significant
76.4 % children presented with ALOC. Out of which 51.28 % were expired and 48.72 % survived . It is statistically significant.
Outcome
Total
Discharge Death
ALOC
Absent 22 2 24
91.67% 8.33% 100%
Present 38 40 78
48.72% 51.28% 100%
Total
60 42 100
63
ALOC AND OUTCOME
0% 10% 20% 30% 40% 50% 60% 70% 80% 90% 100%
ABSENT PRESENT
22
38
2
40
DEATH
64
TABLE – 12
VOMITING AND OUTCOME
Chi square = 1.166 P =0.280NS
Vomiting has no statistical significance with outcome.
Outcome
Total
Discharge Death
Vomiting
Absent
48 37 85
56.47% 43.53% 100%
Present 12 5 17
70.59% 29.41% 100%
Total
60 42 102
65
TABLE – 13
LOOSE STOOLS AND OUTCOME
Chi square = 0.938 P = 0.333 NS
Loose stools has no statistical significance .
Outcome
Total
Discharge Death
Loose stools
Absent 54 40 94
57.45% 42.55% 100%
Present 6 2 8
75% 25% 100%
Total
60 42 102
66
TABLE – 14
FAMILY HISTORY OF DIABETES AND OUTCOME
Chi square = 0.006 P = 0.937 NS
Family history of diabetes is not statistically significant.
Outcome
Total
Discharge Death
Family history of
diabetes
Absent 54 38 92
58.7% 41.3% 100%
Present
6 4 10
60% 40% 100%
Total 60 42 102
67
TABLE – 15
HEART RATE AND OUTCOME
Chi square = 4.527 P = 0.104 NS
84.3% (86/102) of children with SH had tachycardia , out of which 44 .19 % were expired . 1 % presented with bradycardia , all were expired. But impact of heart rate with outcome could not be established.
Outcome
Total
Discharge Death
Heart rate
Normal
12 3 15
80% 20% 100%
Tachy cardia
48 38 86
55.81% 44.19% 100%
Brady cardia
0 1 1
0% 100 % 100 %
Total
60 42 102
68
TABLE – 16
RESPIRATORY RATE AND OUTCOME
Chisquare = 3.457 P = 0.178 NS
55.88 % (57/102) presented with SH had tachypnea in which 49.12 %
were expired. 33.33 % were apneic at presentation but 67.64 % recovered . It is not statistically significant.
Outcome
Total Discharge Death
Respi ratory rate
Normal 8 3 11
72.73% 27.27% 100%
Tachypneic 29 28 57
50.88% 49.12% 100%
Apneic 23 11 34
67.64% 32.35% 100 %
Total
60 42 102
69
TABLE – 17
BLOOD PRESSURE AND OUTCOME
Chi square = 10.092 P = 0.006 significant
62.75 % of children presented with normal BP only, in which 70.31 % were recovered. 20.59 % were hypotensive in which 66.67 % were expired . Low BP is having association with mortality.
Outcome
Total
Discharge Death
Blood pressure
Normal 45 19 64
70.31% 29.69% 100% Hyper
tension
8 9 17
47.06% 52.94% 100% Hypo
tension
7 14 21
33.33% 66.67% 100 %
Total
60 42 102
70
BLOOD PRESSURE AND OUTCOME
0% 20% 40% 60% 80% 100%
NORMAL HYPERTENSION HYPOTENSION
45 8 7
19 9 14
DISCHARGE
71
TABLE – 18
TEMPERATURE AND OUTCOME
Chi square = 11.429 P = 0.003 Significant
53.92 % (55/102) were normothermic at admission ,in which 72.73 % were recovered . 5.9 % were hypothermic in which 83.33% were expired. so hypothermia is significantly associated with mortality and it is statistically significant with outcome.
Outcome
Total Discharge Death
Temperature
Normal
40 15 55
72.73% 27.27
% 100%
Hypothermic 1 5 6
16.67% 83.33% 100%
hyperthermic
19 22 41
46.34% 53.66
% 100 %
Total
60 42 102
72
TEMPERATURE AND OUTCOME
0% 10% 20% 30% 40% 50% 60% 70% 80% 90% 100%
40
1
19 15
5
22
73
TABLE – 19
CRT AND OUTCOME
Chi square = 21.093 P= 0.001 significant
49 % children had CRT > 2 seconds in which 64 % were expired . Prolonged CRT has statistical significance with outcome.
Outcome
Total
Discharge Death
CRT
< 2 seconds
42 10 52
80.77% 19.23% 100%
>2 seconds
18 32 50
36% 64% 100%
Total
60 42 102
74
CRT AND OUTCOME
0 10 20 30 40 50 60
<2 SECONDS >2 SECONDS
42 18
10 32
75
TABLE – 20
AVPU AND OUTCOME
Chi square = 7.680 P = 0.053 NS
39.22 % of children presented with unresponsiveness , out of which 60 % were recovered and 40 % were expired. It is not statistically significant.
Outcome
Total
Discharge Death
AVPU
Alert 2 0 2
100% 0% 100%
Verbal 20 7 27
74.07% 25.93% 100% Pain
responsive 14 19 33
42.42% 57.58% 100%
Unresponsive 24 16 40
60% 40 % 100 %
Total 60 42 102
76
TABLE – 21
TOTAL WBC COUNT AND OUTCOME
Chi square = 20.127 P = 0.001significant
4.9% of children were leucopenic,but out of which 80% were expired. So low leucocyte count has significant association with mortality.
Outcome
Total
Discharge Death
Total WBC count
Normal 52 19 71
73.24% 26.76% 100%
High 7 19 26
26.92% 73.08% 100%
Low 1 4 5
20% 80 % 100 %
Total
60 42 102
77
TOTAL WBC COUNT AND OUTCOME
0% 10% 20% 30% 40% 50% 60% 70% 80% 90% 100%
NORMAL HIGH LOW
52
7
1 19
19
4
78
TABLE – 22
PLATELET COUNT AND OUTCOME
Chi square = 12.401 p = 0.001 significant
92.16 % (94 /102) had normal platelet count. 7.8 % presented with
thrombocytopenia out of which all of them were expired. So it had a statistical correlation.
Outcome
Total
Discharge Death
Platelet count
Normal 60 34 94
63.83% 36.17% 100%
Low 0 8 8
0% 100% 100%
Total
60 42 102
79
PLATELET COUNT AND OUTCOME
0% 20% 40% 60% 80% 100%
NORMAL LOW
60 0
34 8
80
TABLE – 23
NEC AND OUTCOME
Chi square = 4.416 p = 0.036 significant
97 % presented with SH had no growth on NEC . 3% had growth on NEC , out of which all were expired . so it is statistically significant.
Outcome
Total
Discharge Death
NEC
No growth 60 39 99
60.61% 39.39% 100%
Growth 0 3 3
0% 100% 100%
Total
60 42 102
81
NEC AND OUTCOME
0% 10% 20% 30% 40% 50% 60% 70% 80% 90% 100%
NO GROWTH
GROWTH
60
0
39
3 DEATH
82
TABLE – 24
URINE CULTURE AND OUTCOME
Chi square = 3.272 P = 0.070 NS
4.9 % had growth in urine culture , out of which 80 % were expired. This variable is not statistically significant.
Outcome
Total
Discharge Death
Urine culture
No growth
59 38 97
60.82% 39.18% 100%
Growth 1 4 5
20% 80% 100%
Total
60 42 102
83
TABLE – 25
CXR AND OUTCOME
Chi square = 6.082 P = 0.014 significant
72.55% of children have no abnormal findings in chest X ray, in which 66.22 % were recovered. 27.45 % have abnormal findings in chest X ray. Abnormal chest X ray has significant association with mortality.
Outcome
Total
Discharge Death
C X R
Normal 49 25 74
66.22% 33.78% 100%
Abnormal 11 17 28
39.29% 60.71% 100%
Total
60 42 102
84
CHEST X RAY AND OUTCOME
0% 20% 40% 60% 80% 100%
NORMAL ABNORMAL
49
11
25 17
DISCHARGE
85
TABLE 26
UREA AND OUTCOME
Chi square = 22.486 P = 0.001 significant
81.37 % of children have normal urea level . 18.63 % have high urea out
of which 89.47 % were expired. So high urea value has statistical significance with outcome.
Outcome
Total
Discharge Death
Urea
Normal 58 25 83
69.88% 30.12% 100%
High 2 17 19
10.53% 89.47% 100%
Total
60 42 102
86
UREA AND OUTCOME
58
2
25
17
0 10 20 30 40 50 60 70 80 90
NORMAL HIGH
87
TABLE – 27
CREATININE AND OUTCOME
Chi square = 27.110 P = 0.001 significant
84.31% of children presented with normal creatinine levels in which 30.23 % were expired.15.69% have abnormal high creatinine. Among them all were expired. So high creatinine value is significantly associated with mortality
Outcome
Total
Discharge Death
Creatitine
Normal 60 26 86
69.77% 30.23% 100%
High 0 16 16
0% 100% 100%
Total
60 42 102
88
CREATININE AND OUTCOME
0% 10% 20% 30% 40% 50% 60% 70% 80% 90% 100%
NORMAL HIGH
60
0 26
16 DEATH
89
TABLE 28
LFT AND OUTCOME
Chi square = 9.107 P =0.003 significant
94.12 % of children have normal LFT . 5.9 % have abnormal LFT out of
which all were expired . so abnormal LFT has statistical significance with outcome.
Outcome
Total
Discharge Death
LFT
Normal
60 36 96
62.5% 37.5% 100%
High 0 6 6
0% 100% 100%
Total
60 42 102
90
LFT AND OUTCOME
0% 10% 20% 30% 40% 50% 60% 70% 80% 90% 100%
60
36
6
91
TABLE – 29
SODIUM AND OUTCOME
Chi square = 17.431 P = 0.001 significant
Among the children presented with SH 84.31 % have normal sodium level. 9.8 % have high sodium out of which 80 % were expired .5.9 %
have low sodium in which all were expired. So abnormal sodium (high / low ) has statistical significance.
Outcome
Total
Discharge Death
Sodium
Normal 58 28 86
67.44% 32.56% 100%
High 2 8 10
20% 80% 100%
Low 0 6 6
0 % 100 % 100 %
Total
60 42 102
92
SODIUM AND OUTCOME
0% 20% 40% 60% 80% 100%
NORMAL HIGH LOW
58 2
0
28 8
6
DISCHARGE
93
TABLE – 30
POTASSIUM AND OUTCOME
Chi square = 20.608 P = 0.001 significant
75.49 % of children have normal potassium ,out of which 28.57% were expired. Abnormal potassium ( high /low) have 80 % mortality and it has statistical significance.
Outcome
Total
Discharge Death
Potassium
Normal 55 22 77
71.43% 28.57% 100%
High 2 8 10
20% 80% 100%
Low 3 12 15
20% 80 % 100 %
Total
60 42 102