University of Southern Queensland
Faculty of Engineering and Surveying
Hydraulic properties of Toowoomba soils for
laundry water reuse
A dissertation submitted by
Amphone SIVONGXAY
in fulfilment of the requirement of
Courses ENG4111 and 4112 Research Project
towards the degree of
Bachelor of Engineering (Environmental)
Abstract
The main purpose of this project was to evaluate the potential effects of laundry
water irrigation of residential lawns and gardens on the soil hydraulic properties. The
project aimed to experimentally determine the soil properties such as pH, EC, soil
water retention and saturated hydraulic conductivity using a typical soil in the
Toowoomba city.
A set of three treatments were used for various experiments. Undisturbed soil cores
(referred to as field cores) were used as a treatment to simulate the application of
laundry water on well established gardens of suburban backyards. Furthermore,
disturbed soil cores referred to as loose and compacted treatments were used to
simulate the application of laundry water on recently prepared garden beds and
somewhat older garden beds (with some settlement), respectively. Experiments
involved two leaching scenarios in which laundry water was applied to initially moist
(unsaturated) soils and to wet (saturated) soils.
Results show that compacted soils retained significantly more water at high suction
and field capacity than loose or field soils. Values of saturated hydraulic conductivity
(Ksat) for most treatments were fond to decrease by an average of 90% when laundry
water was used to infiltrate the moist soil. When laundry water was used to infiltrate
into the saturated soils, the values of Ksat were reduced by 80 ± 6%. In addition, a
further reduction of 61 ± 8% was resulted when laundry water irrigation was
followed with tap water. In contrast, the drainage from laundry water had similar
properties to the drainage using tap water.
Due to apparent purification of the laundry water during drainage, the risk of ground
water contamination from salts is reduced, but the potential for soil to accumulate
University of Southern Queensland
Faculty of Engineering and Surveying
ENG4111 & ENG4112
Research Project
Limitations of Use
The Council of the University of Southern Queensland, its Faculty of Engineering
and Surveying, and the staff of the University of Southern Queensland, do not accept
any responsibility for the truth, accuracy or completeness of material contained
within or associated with this dissertation.
Persons using all or any part of this material do so at their own risk, and not at the
risk of the Council of the University of Southern Queensland, its Faculty of
Engineering and Surveying or the staff of the University of Southern Queensland.
This dissertation reports an educational exercise and has no purpose or validity
beyond this exercise. The sole purpose of the course pair entitled "Research Project"
is to contribute to the overall education within the student’s chosen degree program.
This document, the associated hardware, software, drawings, and other material set
out in the associated appendices should not be used for any other purpose: if they are
so used, it is entirely at the risk of the user.
Prof G Baker Dean
Certification
I certify that the ideas, designs and experimental work, results and analyses and
conclusions set out in this dissertation are entirely my own effort, except where
otherwise indicated and acknowledged.
I further certify that the work is original and has not been previously submitted for
assessment in any other course or institution, except where specifically stated.
Amphone SIVONGXAY
Student Number: d12304894
_____________________
Signature
Acknowledgements
Special thanks to my project supervisor. This project was possible through the
endless and enthusiastic guidelines, help and support from Dr Rabi Misra. His
comprehensive knowledge and understanding have guided me through both
academic and practical aspects of this project.
Special thanks to all technical staffs of the Engineering Laboratory of the USQ
Faculty of Engineering and Surveying, especially to Mr. Glen Bartkowski and Mr.
Bernhard Black for their dedication and assistance.
A very special thanks to my fellow research project student, Lee Mihn Nhat for the
sharing of the collected laundry water, and other information and tips on conducting
a research.
Table of contents
Abstract i
Limitations of Use ii
Certification iii
Acknowledgements iv
List of Figures ix
List of Tables xi
List of Abbreviations xii
Glossary of Terms xiii
Chapter 1: Introduction 1
1.1 Background 1
1.2 Reuse of Reclaimed Water 2
1.3 The Potential of Laundry Water for Reuse 3
1.4 Study Objectives 4
1.5 Dissertation Overview 5
Chapter 2: Soil Water Interaction 7
2.1 Laundry Water Characteristics 7
2.1.1 Quantity of Laundry Water 7
2.1.2 Quality of Laundry Water 8
2.2 Interaction of Water with Soil 10
2.2.1 Storage and Retention of Water and Laundry Water 10
2.2.2. Flow of Water and Laundry Water in Soil 10
2.3 Properties of Clay Soils 11
2.3.1 Nature of clay soils 11
2.3.2. Infiltration and Permeability of Clay Soils 12
2.3.3 Soil Moisture Storage and Soil Water Content 13
2.3.4 Cation Exchange Capacity 13
2.4.2 The Effect of Ion Valency and Concentration on the DDL 15
2.4.3 Effects of Ions on Soil Hydraulic Conductivity (K) 18
2.5 Effects of Irrigation Water Quality on Soils 19
2.5.1Effects of Saline Water 19
2.5.2 Water With High SAR 21
2.5.3 Water With High ESP 23
2.5.4 Consequences of Wastewater Irrigation 24
Chapter 3: Principles of Measuring Soil and Water Properties 26
3.1 Principles of Soil Sampling 26
3.1.1 Size and Accuracy of Sampling 26
3.1.2 Mechanics of Sampling 27
3.1.3 Preparation of soil cores 28
3.2 The Solid Phase 29
3.2.1 Bulk Density 29
3.2.2 Pore Spaces 30
3.3 Soil pH Measurement 31
3.3.1 Principles and Definition 31
3.3.2 Factors Affecting pH Measurement 32
3.3.3 Methods for pH Measurement 33
3.3.4 Soil pH Affecting Plant Growth 33
3.4 Electrical Conductivity (EC) 34
3.4.1 Principal and Definition 34
3.4.2 Factors Affecting EC Measurement 34
3.5 Water Retention and Moisture Characteristic 35
3.5.1 Water Retention 35
3.5.2 Soil Moisture Characteristic 35
3.5.3 Factors Affecting Soil Moisture Characteristic 36
3.5.4 Methods for Measuring Soil Water Content 38
3.5.5 Methods for Measuring Soil Water Characteristic 39
3.6 Hydraulic Conductivity 40
3.6.1 Principal and Definition 40
Chapter 4: Materials and Methods 43
4.1 Soils 43
4.1.1 Soils of Toowoomba 43
4.1.2 Soil Used in Experiments 44
4.2 Preparation of Soil Cores 45
4.2.1 Field soil cores 46
4.2.2 Field Bulk density and Water Content 48
4.2.3 Paired T-test 49
4.2.4 Disturbed soil cores 50
4.3 Soil pH and EC 51
4.4 Soil Water Characteristic 52
4.4.1 Soil Samples 52
4.4.2 Sample Wetting 52
4.4.3 Use of Suction Plate Apparatus 53
4.5 Saturated Hydraulic Conductivity of soil 55
4.5.1 Soil Samples and Irrigation Scenarios 55
4.5.2 Leaching of soil cores with a Constant Head Device 56
4.6 Chemical Properties 60
Chapter 5: Results and Discussions 62
5.1 Properties of the Experimental Soil 62
5.1.1 Physical and Chemical Properties 62
5.1.2 Exchangeable Sodium Percentage and Aggregate Stability 63
5.2 Soil Water Storage 64
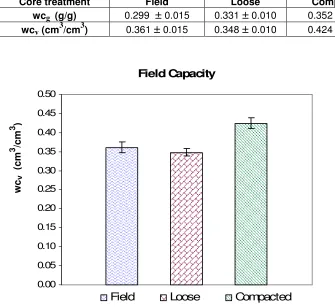
5.2.1 Field Capacity 64
5.2.2 Soil Water Characteristic 65
5.3 Saturated Hydraulic Conductivity (Ksat) 69
5.3.1 Ksat of Initially Moist or Unsaturated Soil 69
5.3.2 Ksat of Initially Saturated Soils 72
5.4 pH, EC and SAR of the Irrigation water and Leachate 77
5.4.1 Leachate from Initially Unsaturated Soils 77
Chapter 6: Conclusions and Recommendations 87
6.1 Achievement of Objectives 87
6.2 Summary and Conclusions 88
6.3 Recommendation for Further Studies 90
References: 92
Appendix A: Project Specification 101
Appendix B: Field Bulk Density, Moisture Contents and Plastic Limit 103
Appendix C: T-test for Field BD and WC of Soil Cores From Two Depths 105
Appendix D: Calculation of Moist Soil Needed for Disturbed Cores 107
Appendix E: Data for the Calculation of WC at Different Matric Suctions 109
Appendix F: Flux, Ksat, pH and EC of the Leachate from four batches of soil cores
113
Appendix F1: Flux, Ksat, pH and EC of the leachate from the first batch of soil
cores 114
Appendix F2: Flux, Ksat, pH and EC of the leachate for the second batch of soil
cores. 119
Appendix F3: Flux, Ksat, pH and EC of the leachate for the third batch of soil
cores. 124
Appendix F4: Flux, Ksat, pH and EC of the leachate for the fourth batch of soil
cores. 125
Appendix G: BD and Pore Volume of all Soil Cores Used in the Experiment 126
Appendix H: Vertical Swelling of the Soil Cores During the Draining and Wetting
Process 129
Appendix I: Properites of Tap Water and Laundry Water, and Their Leachate 131
List of Figures
Figure 2.1: Water usage within the household 7
Figure 2.2: Distribution of cations (positive) and anions (negative) in the DDL 15
Figure 2.3: Effects of cation valency and concentration on DDL 17
Figure 2.4: The effect of exchangeable sodium percentage and electrolyte
concentration on hydraulic conductivity (K) of soil 18
Figure 3.1: Soil water retention curves 36
Figure 3.2: The effect of texture on soil water retention 37
Figure 3.3: The effect of structure on soil water retention curves 38
Figure 3.4: The effect of water potential on K of sand and clay soil 41
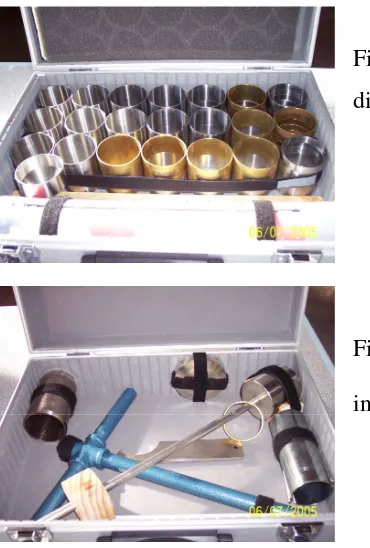
Figure 4.1: Core sampler rings of inner diameter 5.3 cm and 1, 3 and 6 cm in height
46
Figure 4.2: Core sampler accessories for insertion and removal of the sampling tube
46
Figure 4.3: Core sampler being driven into the ground using a drop hammer 47
Figure 4.4: Removal of soil core with the retained soil sample from the ground 47
Figure 4.5: One field soil core with 5.3 cm diameter 47
Figure 4.6: Field soil cores with 3 cm height used for the determination of field bulk
density. 49
Figure 4.7: Soil samples placed in a try to allow wetting of soil cores to saturation
from the bottom of the sample. 52
Figure 4.8: Initially saturated soil cores placed on the porous ceramic plate at zero
suction 53
Figure 4.9: Soil cores equilibrated to 1 kPa suction (left figure), and 10 kPa suctions
(figure on right). 55
Figure 4.10: Soil core preparation for determining Ksat. 56
Figure 5.1: Volumetric water content (WCv) at field capcity for three soil core
treatments. Vertical lines over mean values indicate ± SE. 64
Figure 5.2: Soil water characteristic curves (relationship between volumetric
moisture content, WCv and matric suction) for the three soil treatments 67
Figure 5.3: Ksat of the initially unsaturated cores after infiltration with tap water (TW)
or laundry water (LW) using a constant head. 70
Figure 5.4: Variation in water flux over time for the initially unsaturated soils 71
Figure 5.6: Water flux for the first batch of soil cores 75
Figure 5.7: Water flux for the second batch of soil cores 76
Figure 5.8: Changes in pH of the tap water leachate over serval pore volumes of
leachate collection 78
Figure 5.9: Changes in EC of the tap water leachate over serval pore volumes of
leachate collection 78
Figure 5.10: Changes in pH of the laundry water leachate over serval pore volumes
of leachate collection. 79
Figure 5.11: Changes in EC of the laundry water leachate over serval pore volumes
of leachate collection. 80
Figure 5.12: Changes of pH over pore volumes 82
List of Tables
Table 2.1: CEC and specific surface area of the principal clay minerals 14
Table 2.2: Classification of water 20
Table 2.3: Guidelines for interpretations of water quality for irrigation 20
Table 3.1: Preferred sampling of soil 27
Table 3.2: pH and Soil Reaction 32
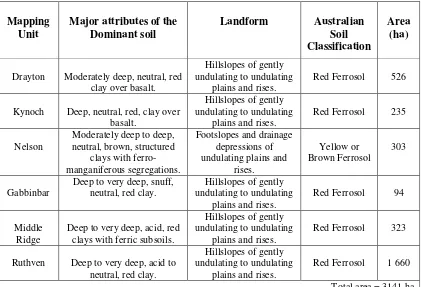
Table 4.1: Soils of the Toowoomba Plateau 44
Table 4.2: Soil Profile Description of the Soil at the Agriculture Plot 45
Table 4.3: The soil pH and EC 51
Table 4.4 : Chemical properties of the soil samples 61
Table 5.1: Moisture retained at field capacity 64
Table 5.2: Volumetric moisture contents at various suctions 66
Table 5.3: Pore volume (porosity) and water content at saturation 68
Table 5.4: Saturated hydraulic conductivity (Ksat) of the initially unsaturated soils 69
Table 5.5: Ksat of initially saturated soils. 73
Table 5.6: pH, EC and SAR of tap water, before and after leaching 84
List of Abbreviations
ANZECC Australian & New Zealand Environmental & Conservation Council
AWRC Australian Water Resource Council
BD Bulk density in g/cm3
CEC Cation exchange capacity in meq./100g of soil
cfu/100 ml Colony forming units per 100 ml
CSIRO Commonwealth Scientific and Industrial Research
DDL Diffused Double Layer
EPA Environmental Protection Agency
EC Electrical conductivity in µS/cm (1000µS/cm = 1dS/m)
ESP Exchangeable sodium percentage
K Hydraulic conductivity in mm/h
Ksat Saturated hydraulic conductivity in mm/h
LW Laundry water
pH logarithm of hydrogen ion activity in water or soil solution
PL Plastic limit
SAR Sodium adsorption ratio
TW Tap water
WADH Western Australia Department of Health
WCg Gravimetric moisture content
Glossary of Terms
Absorption (chemistry) The process by which one substance is taken up by another substance.
Buffering The process that constrain the shift in pH when acids or bases are added. More generally, processes that constrain shifts in the dissolved concentration of any
ion when it is added to or removed from the system.
Capillarity Forces between water and soil surfaces in the small (capillary) pores
Electrical Conductivity (EC) The reciprocal of electrical resistivity, the conductivity of electricity through water or an extract of soil; expressed in
decisiemens or siemens per meter (dS/m) at 25ºC. It is a measure of soluble salt
content in solution.
Exchangeable Sodium Percentage (ESP) (of sol) Amount of exchangeable Na expressed as a percentage of total exchangeable cations.
Hydraulic Conductivity (K) The rate at which water passes through a soil material under unit gradient
Pore size distribution The volume fraction of the various sizes of pores in a soil.
Porosity The volume percentage of the total bulk density of soil not occupied by solid particles. The volume of pores in a sample divided by the sample volume.
Potential gradient. The rate of change of potential with distance. The driving force of water through a medium.
Sodium adsorption ratio(SAR) The relationship of soluble sodium to soluble calcium plus magnesium in water or the soil solution, expressed by the equation:
SAR = [sodium]/[calcium + magnesium]1/2, where the concentration of ions,
denoted by square brackets, are in millimoles per litre.
Soil core A volume of soil obtained by forcing a cylindrical device into the ground (eg soil, sediment), usually perpendicular to the horizontal.
Soil order In sol classification, the most general level of classification where all soils fit into 12 orders.
Soil solution The liquid phase of the soil and its solutes.
Soil structure (pedology) The combination or arrangement of primary soil particles into secondary units or peds. The units are characterized and classified on the basis
of size, shape, and degree of distinctness.
Soil texture The relative proportion of the various soil separates-sand, silt and clay-that make up the soil texture classes as described by the textural triangle.
Soil bulk density The dry mass (weight) of soil per unit bulk volume.
Water potential The tendency of sol water to move; the sum of gravity, pressure, matric, and solute components.
Water retention curve or soil-water characteristic curve The graphical relationship between soil water content and the soil-water matric potential (the
Chapter 1 Introduction
Chapter 1
Introduction
1.1 Background
Average rainfall over the Australian continent is low in comparison with other
continents. Australia receives an average rainfall of 420 mm per year, where its
effect is compounded by its variability and the high rate of evaporation. Australia has
an average evaporation of 1,800 mm/year, making it the one of the world driest
continents (Smith et al. 1983). Therefore, Australia has experienced a series of
droughts those affect the livelihoods of its population. On the other hand, Australia is
the world second largest user of domestic water per capita after the United State of
America (Hutcheon 2005).
Water resource and water use related issues have been recognised as one of the
important social, economical and environmental issues challenging Australia. Rapid
growth in the demand for high quality water coupled with natural shortage and
continuous restrictions in supply have accelerated the search for alternative sources.
Many communities and city councils in Australia have adopted water conservation
and reuse practices. The Toowoomba City Council (TCC) has enforced water
restriction policy due to the current and future potential shortage of water supply.
Increasing population and drought have contributed to the city’s dwindling water
supplies. The city reservoirs need at least 500 mm of rain in a short time over the
dam catchment areas to overcome recent water shortage. The water level in the city’s
main reservoir is at about 30% of its capacity, pressuring the TCC to work on a water
demand management strategy. TCC is aware of the reuse options for treated
wastewater on public recreation areas such as golf-courses and lawns. In general,
greywater can be reused through three options. The first option is the centralised
treatment of wastewater that is piped back to the individual households for reuse.
Chapter 1 Introduction
(SECITARC 2002). The potential reuse of domestic greywater, particularly the direct
reuse of domestic laundry water has been investigated through the TCC
environmental sections. This direct reuse option may be feasible if practiced under
regulations to reduce human and environmental health risks (Brennan and Patterson
2004).
1.2 Reuse of Reclaimed Water
Wastewater has been applied to crops, rangelands, forests, parks and golf courses in
many parts of the world (Steward et al. 1986; Angelakis et al. 1999; Al-Jamal et al.
2002). Furthermore, Harruvy (1996) and Frieddler (2001) indicated that Israel uses
more than 65% of the country’s wastewater for irrigation.
Irrigation of lawns and gardens has great potential for small scale reuse of reclaimed
greywater. Using laundry water and other greywater for on-site irrigation of
ornamental plants not only reduces the volume of wastewater that must be disposed
of through septic systems, but also saves potable water currently used for irrigation
(Amoozegar et al. 2004). The average household potable water usage could be
reduced by between 30-50 % if the domestic greywater could be reused (Jeppesen,
1996). However, potential health risks are associated with the direct contact and
accidental exposure to the reclaimed water such as exposure to aerosols generated by
spray irrigation. The major health risk is infection from micro-organisms which is
indicated by the presence of thermotolerant coliforms or E. coli (EPA and DOH
1999).
According to Capra and Scicolone (2004), drip irrigation is particularly suitable for
wastewater reuse because it minimises the health risks to farmers and product
consumers due to reduced exposure and contact with the wastewater. The
performance of drip irrigation for wastewater reuse is mainly limited by the clogging
of emitters. Drip irrigation system prevents the formation of aerosols while runoff
and deep percolation are negligible. Due to the health risk associated with the use of
greywater, the current recommendation is to irrigate soils with greywater by the
Chapter 1 Introduction
is arguably the safest, most efficient and effective method of lawn and garden
watering when applied in a zone of 200 mm to 300 mm below the surface. Most
pathogens are less likely to survive if greywater is applied in this zone because this
zone is the most aerobic and dominated by high natural microbial activity. Greywater
has some nutrients that may be valuable as fertilisers for lawns and gardens. The
nutrients contained in greywater namely nitrogen, phosphorous, potassium and
sulphur would benefit plants providing that they are in moderate concentrations
(Sharman 1993). However, other chemicals presenting in greywater may be harmful
to soils and vegetation. Sodium, total salts, chloride and boron present in greywater
could negatively impact the environmental health of soils and plants (Fisher 1988).
Therefore, the human and environmental health risks associated with the reuse of
grey water are of major concerns. This type of reuse has been an issue that requires
further scientific evaluation and technological development to support such schemes.
Guidelines and regulations for the reuse of greywater are published to advise and raise the public awareness on potential health risks. Even though, the benefits of grey
water reuse are well documented and published, little has been done on examining its
effects on the soils’ physical and chemical properties.
1.3 The Potential of Laundry Water for Reuse
Laundry water is a component of greywater and contributes to about one third of the
total grey water volume. Therefore, it has a good irrigation potential due to its
quantity and better quality (less contamination) compared to those of the greywater
generated from kitchen and bath room (EPA and DOH 1999).
On the other hand, some chemicals present in laundry water, especially sodium could
adversely affect the stability and hydraulic properties of soils that continually receive
laundry water. Soil affects plant growth by providing plant support, nutrients, water
requirement and aeration (Brady and Weil 1999). Changes in soils properties that
Chapter 1 Introduction
thorough examination. According to Beltran (1999), knowledge of the chemical
composition of reclaimed water is necessary but may not be sufficient to evaluate its
suitability for reuse. Other factors such as climate, soil characteristics, drainage
conditions and the irrigation method should be considered in order to define the
appropriate land use and water management. The water retention capacity and the
hydraulic conductivity are the important soil properties that need closer examination
for long term use of laundry water. These hydraulic properties of soil depend on soil
texture and structure. Furthermore, good drainage conditions are essential to
maintain a favourable salt balance in the root zone.
Hence, this research project was dedicated to evaluate the retention and hydraulic
properties of the red soils in Toowoomba (a dominant soil type covering more than
95% of the total city area) for reclaimed water reuse, with the project scope limited
to the application of laundry water.
1.4 Study Objectives
This research project aims to experimentally determine the retention capacity and
hydraulic conductivity of typical soils from Toowoomba. Furthermore, the potential
capacity of these soils to store laundry water is examined, accompanying with the
analysis of changes in pH and Electrical Conductivity (EC) of the soil, irrigation and
drainage water. The main objectives of this research include:
1. Collection of background information on storage and hydraulic properties of soils in relation to water, salt and nutrient loading;
2. Development of experimental protocols to measure soil water characteristic, hydraulic conductivity, pH and Electrical Conductivity (EC) of soils and water using the clay soil from the Agricultural Field Station of USQ;
Chapter 1 Introduction
4. Analysis of the changes in pH and EC of soil and leachate using typical laundry water for infiltration to determine the quality of drainage water.
Additional but limited information on sodium adsorption ratio (SAR) of soil and
leachate was also collected to aid data interpretation and develop recommendations
for laundry water reuse.
The detailed project specification is given in Appendix A.
1.5 Dissertation Overview
This dissertation is structured as below to present the project activities and report
experimental outcomes in a systematic and concise manner.
Chapter 1: Introduction
This chapter is intended to introduce the topic with a brief outline of the importance
and background information on potential reuse capability and options for domestic
laundry water. It also includes the statement of the objectives of this project.
Chapter 2: Soil Water Interaction
Chapter 2 provides background information on the properties of laundry water and
their potential effects on soils. This chapter also introduces varying properties of
irrigation water and their effects on soil hydraulic properties. Previous studies on
irrigation and greywater are also reviewed in this chapter.
Chapter 3: Principles of Measuring Soil and Water Properties
Chapter 3 briefly outlines the principles of soil and water sampling and analysis. It
provides a basic understanding to the concepts and principles applied to measurements of pH, EC, water retention, water characteristic and hydraulic
conductivity of the soil. Furthermore, the chapter explores some of the common
Chapter 1 Introduction
Chapter 4: Materials and methods
This chapter outlines the experimental materials and various testing procedures used
for the project.
Chapter 5: Results and Discussion
This chapter includes all experimental results and analysis and interpretation of these
results examining the effects of laundry water reuse on soil hydraulic properties. This
chapter features soil water retention, water characteristic and possible changes in the
chemical properties of the studied soil with laundry water application.
Chapter 6: Conclusions and Recommendation
This last chapter of the dissertation summarises main project findings to develop
major conclusions arising from the project. Furthermore, this chapter provides
possible recommendations for laundry water reuse in residential areas of
Chapter 2 Soil and Water Interaction
Chapter 2
Soil and Water Interaction
2.1 Laundry Water Characteristics
2.1.1 Quantity of Laundry Water
Laundry greywater contributes about 34% to the total greywater volume (23% of
household wastewater). Toowoomba water used by sectors is characterised by high
proportion of water being supplied to dwelling demand. This sector accounts for
63.1% of water use. Figure 2.1 shows the proportion of household water usage in
Toowoomba city. About 20% of water demand is used for laundry trough and
washing machine. This amount of laundry water generated within household has a
high potential for reuse under regulations. The typical Australian household may
[image:22.595.156.480.501.731.2]Chapter 2 Soil and Water Interaction
2.1.2 Quality of Laundry Water
Physical:
Total dissolved solids (TDS) represents all inorganic salts dissolved in the liquid or
the soil solution in milligram per litre. Typical laundry water has an average total
dissolved solids value of 664 ± 50 mg/l (Patterson 1999). The value of TDS of a
liquid is related to its electrical conductivity as follows:
TDS (mg/l) = 640× EC (dS/m)
Sub-surface drip irrigation is considered the safest option for applying laundry water
on lawns and gardens. However, the presence of TDS in laundry water could limit
the performance of the drip irrigation system by clogging of emitters. TDS presented
in laundry water has the potential to cause clogging of fine pores when laundry water
is applied to the soil.
Biological:
Laundry greywater arising from domestic washing machines varies in quality from
wash cycle to rinse cycle (WADH 2002). Greywater effluent can pose considerable
health risk due to faecal contamination and viruses. It also contains lint, oils, greases,
chemicals, soaps, nutrients and other components (WADH 2002). Brandes (1978)
reported greywater to contain considerable amounts of both total coliforms and
faecal coliforms of which E. coli. being one of the most dominant pathogen.
According to Jepperson and Solley (1994), typical laundry wash water contains
faecal coliforms of 126 colony forming units (cfu) per 100 ml, while the rinse water
contains 25 cfu. They reported combined greywater (bath, laundry, kitchen)
containing 1.8 × 10⁵ to 8 × 10⁶ cfu/100 ml. This was substantially higher than that of the laundry water. Faecal coliform counts is an indicator of risk causing human
illness through infections, contact with this water is usually avoided.
Biological contamination in laundry greywater is not usually high, except when
Chapter 2 Soil and Water Interaction
environment. Therefore, grey water from laundry, particularly rinse water is suitable
for reuse (WADH 2002).
Chemical:
Sodium concentration in laundry water is an important chemical property of laundry
water for irrigation. Thus, it is the main discussion in this section. Domestic laundry
water effluent may contain high amount of sodium increasing sodium adsorption
ratio (SAR). Patterson (1999) indicated that large proportion of sodium salts (up to
40% sodium sulphate) in laundry detergents contributes little to the cleaning process,
but rather used as ‘filler’ material for bulking. Furthermore, only a few laundry
products (detergents, fabric softeners) manufacturers inform the consumers about the
chemical composition of their products. Patterson (1999) showed that laundry
detergents with low Na (20 g/wash) produced effluent of preferable quality. From
this study with 20 liquid and 40 powder laundry products, only 37 products
contributed less than 20 g of Na per wash. Interestingly, all the liquid products tested
were within the range of acceptable values. Therefore, if the laundry water was
generated using liquid detergents, any adverse effects of Na on soil conditions such
as aggregate stability and hydraulic properties would be minimum.
Consumer choice on laundry product could significantly contribute to the proportion
of sodium added to the soil environment. If a brand of laundry powder with high
sodium (55g per wash) is used by a household, in one year, the application of
household’s laundry water by irrigating over 500 m2 of lawn will contribute an
equivalent of 1.1 tonnes of sodium chloride per hectare to the soil. The amount is
equivalent to adding 1.1 1000 432.5 )
5 . 35 23 (
23
= ×
×
+ kg of Na per hectare. On the
other hand, about 193 kg of sodium chloride (75.9 kg of Na) per hectare is added to
the soil if a low sodium detergent is used. Therefore, the use of a low sodium
detergent results in a 84 % reduction in sodium addition with possibly no loss in
washing efficiency. It is also possible to further reduce sodium load in laundry water
Chapter 2 Soil and Water Interaction
2.2 Interaction of Water with Soil
2.2.1 Storage and Retention of Water and Laundry Water
A difference in water potential in soil causes water to flow. The potential difference
over distance is referred to as potential gradient. The direction of water flow is in the
direction of decreasing potential difference and magnitude proportional to gradient.
According to Singer and Munns (2002), liquid water in soil pores and in water films
appear as coating the particle surface. Furthermore, the actual movement of water is
the process of sliding and slipping of water molecules over other molecules. The
flow rates of water in soil depend on a number of factors such as differences in
height (gravitational potential gradient), pressure, temperature, dissolved solute
concentration (osmotic gradient), soil moisture content (matric potential gradient);
and pore sizes and distribution matrix (Hillel 2004).
McLaren and Cameron (1996b) suggested that water movement occurs in soil as
tendency of water to attain equilibrium, which makes water to move in soil from
regions of high total water potential to those of low total water potential. Therefore,
the rate of movement of water over a unit area and time (flux) is a function of the
geometric properties of the soil pore space and the potential energy gradient. The
movement of water within soils occurs as ‘saturated’, ‘unsaturated’ and ‘vapour’
flow. However, the vapour flow is generally considered to be negligible.
2.2.2. Flow of Water and Laundry Water in Soil
Unsaturated Flow:
Unsaturated flow in soils is more common than the saturated flow. The rate of
unsaturated flow is much larger than saturated flow. Unsaturated movement of water
occurs within soils that are not completely saturated and where some of the large soil
pores are empty. Thus, they do not contribute to the bulk water movement. This
Chapter 2 Soil and Water Interaction
only smaller pores are contributing to the flow. In other words, with progressive
drying, the remaining water is more tightly held and subjected to more friction and
interruptions (decreased pore connectivity) of flow (Singer and Munns 2002). Flow
rate is largely due to matric and gravitational gradients. Furthermore, water content
and water potential in unsaturated soils can be highly variable spatially and
temporally. These factors influence the rate and direction of the flow making it more
difficult to measure.
Saturated Flow:
Saturated flow in soil is the movement of soil water where all the pores in the soil are
filled with water. Saturated flow in soil is a function of the potential energy gradient
that is largely comprised of pressure and gravitational potential. However, in many
cases, the presence of entrapped air in the very small pores can prevent soil to reach
full saturation and reduce water flow, particularly in swelling clay soils. Examples of
saturated zones in soil are the capillary fringe over water table, lower horizons of
poorly drained soils, portions of well-drained soils above stratified layers of clay
(perched water table), and pores in the upper soil zones during and immediately
following a heavy rain or irrigation (Brady and Weil 1999).
2.3 Properties of Clay Soils
2.3.1 Nature of clay soils
Clays are originated from the weathering of the primary minerals contained within
rocks. The most common groups of clay minerals (silicate clays) are the kaolinites,
montmorillonites and illites. Firstly, kaolinite is the non-swelling clay mineral that is
typically developed when the parent rock is subjected to intensive leaching. The
weathering process may occur in well drained humid tropical locations where the
mineral is produced by the destruction of alkali-feldspars under acidic conditions.
Secondly, montmorillonite is the swelling clay mineral that is formed by the alteration of basic rocks or other silicates with low potassium, under alkaline
Chapter 2 Soil and Water Interaction
alkaline conditions. Kaolinite clay has a far less shrinking and swelling capacity than
the other two types (FAO 1995).
Clay particles are characterised by their small size and large surface area. This large
surface area has significant effects on the soil properties regarding the retention of
water, nutrients, gas and cohesion between particles (Brady and Weil 1999).
Furthermore, clay soils tend to be plastic and sticky when wet. These soils are able to
retain large quantities of water in their fine porous matrix. This water retention
capacity makes these soils attractive for irrigated agriculture. However, these soils
usually have a low to very low saturated hydraulic conductivity because of their fine
porous matrix that is very poorly permeable.
2.3.2. Infiltration and Permeability of Clay Soils
Factors affecting the infiltration rates include pore sizes, pore size distribution,
continuity of the pores and soil structure. It has been observed that most of the
infiltration takes place at the beginning when the water is applied to the clay soil.
The infiltration then decreases with time and depth. Therefore, most of the water
infiltrated is associated with bypass flow, which is the vertical movement of free
water along macropores through unsaturated soil horizons. The infiltration would
significantly decrease as the macropores become saturated (FAO 1995).
Rainfall intensities and surface mulching conditions are important factors
contributing to the infiltration of rain into wet soils. Rainfall with high intensity could cause crusting and sealing of the soil surface. On the other hand, surface
mulching and organic matter content would help to absorb the raindrop impact. The
infiltration of water into soil is strongly affected by clay content, the structure and
stability of the surface soil. Clay soils with high sodium contents are susceptible to
swelling and dispersion that would further reduce the soil permeability. As a result,
Chapter 2 Soil and Water Interaction
2.3.3 Soil Moisture Storage and Soil Water Content
Soils moisture storage and soil water content are determined by the pore size and
continuity pattern. However, these characteristics could be difficult to identify for
clay soils due to their shrinking and swelling properties. The shrink-swell processes
induce changes in the size and the continuity pattern of soil pores.
Soil water contents at air dryness subjected to 15 bars or 1500 kPa matric suction
represent water contents at wilting point. Field capacity is approximated by the soil
water contents at air dryness subjected to 0.1 bar or 10 kPa matric suction. However,
clay soils are dominated by micropores and their field capacity are usually taken at
33 kPa matric suction. Soil water contents at air dryness and wilting point are
increased with the amount and surface area of the clay fraction. Field capacity is
influenced by soil structure. Therefore, the available water capacity which is the
difference between water contents at field capacity and at wilting point could vary
significantly from soil to soil. Clay soils have high clay contents resulting in high
amounts of water being retained at wilting point. Thus, the plant available water capacity of clay soils is small even though the soils can hold high moisture at field
capacity (Hubble 1984).
2.3.4 Cation Exchange Capacity
Cation exchange capacity (CEC) is a measure of the quantity of readily exchangeable
cations neutralising negative charges on soil colloids. CEC is usually expressed in
milliequivalents per 100g of soil. CEC depends largely on clay mineral type and is
directly related to the surface area. Table 2.1 shows the CEC of the principal clay
minerals. Montmorillonite clay has the highest CEC compared to the other two clay
Chapter 2 Soil and Water Interaction
Table 2.1: CEC and specific surface area of the principal clay minerals (Brady and Weil 1999)
Clay mineral Surface area (mg2/g)
Internal surface area
External surface
CEC (meq/100g) 1:1-type lattice
clays, Kaolinite 5 -20 none low 3 -15
1:2-type lattice clays,
Illite Montmorillonite
100 -200 700-800
Medium Very high
Medium High
10-40 80-150
Exchangeable Cations are cations absorbed on the soil surface. These cations can be exchanged for other cations presented in the soil solutions. The exchangeable bases
include calcium (Ca2+), magnesium (Mg2+), potassium (K+) and sodium (Na+). In
most agricultural soils, these exchangeable bases occur in the order listed with the
large quantities being occupied by Ca2+. On the other hand, sodium is very low in
most soils (Grant 1982).
The main salts found in soils solution are:
- Cations: calcium (Ca2+), magnesium (Mg2+), potassium (K+) and sodium
(Na+)
-Anions: chloride (Cl-), sulphate (SO42-), bicarbonate (HCO3-) and nitrate
(NO32-).
2.4 Effects of Ion Concentration of Irrigation Water on
Soil Properties
2.4.1 The Diffused Double Layer (DDL)
The effect of sodium in greywater on the dispersive properties of soil is well
documented (Patterson 1996), and it can be examined through the concept of the
Diffused Double Layer. (DDL is sometimes referred to as the ‘Electric Double
Chapter 2 Soil and Water Interaction
In terms of the quality of water applied, increase in sodium percentage and
electrolyte concentration could have significant effects on the infiltration capacity of
a clay soil through the function of the DDL and the hydraulic conductivity (K).The
diffuse double layer is a model that describes the relative ion distribution in the
proximity of a charged surface such as clay colloids. The distribution of cations and
anions surrounding negatively charged soil colloids vary with distance from charged
surface. For example, the cation concentration gradually decreases from a high
concentration near the colloid surface to a lower state in the bulk solution. On the
other hand, the deficiency of anions occurs near the colloid surface, and hence, the
concentration of anions gradually increases with distance until it reaches the
equilibrium state in the bulk solution as shown in Figure 2.2. These distributions are
the result of the attraction of the negative charges to the colloid surfaces (clay and
organic matter).
_
_ + + _ _ +
_ + + + _ _ _ + _
_ + + _ _
_ + + + +
Figure 2.2: Distribution of cations (positive) and anions (negative) in the DDL (adapted from Marshall and Holmes1988).
2.4.2 The Effect of Ion Valency and Concentration on the DDL
DDL plays a significant role in affecting soil physical and chemical properties.
Firstly, soil water would try to flow towards the colloid surface in attempt to dilute
the high concentration. As a result, an osmotic pressure arises between the clay colloid sheets. This pressure creates expansion and swelling of the clay colloidal
Bulk Solution Clay
Chapter 2 Soil and Water Interaction
properties of the soil. The stability of the soil aggregates and structure increases as
the width decreases, and vice versa. On the other hand, the width of DDL is also a
function of the cations’ valency and the concentration of the bulk solution (Figure
2.3). The width of DDL could be minimised by introducing higher valency ions (e.g.
Ca2+ with gypsum application) and increasing its bulk solution concentration.
The distance that the DDL extends from the colloid surface ( dDDL) is determined by:
o DDL
M KZ
d = 1
Where:
K is a constant dependent of the system temperature
Z is the valency of the dominant ion
Mo is the concentration of the ions in the bulk solution in charge unit
Chapter 2 Soil and Water Interaction
(a) The effect of Ion valency on the DDL
(b) The effect of bulk solution concentration on DDL
Figure 2.3: Effects of cation valency and concentration on DDL (adapted from Hillel 2004)
In (a), the width of DDL is shown as vertical dashed lines for various ions of varying
valency. In (b), the effect of increasing the concentration of an introduced ion (M1)
on the width of DDL is shown. Aggregate stability and the presence of swelling clays
can have a significant impact on infiltration via DDL. Increase in sodium
concentration in infiltrating water could negatively affect the stability of the soil as it
increases the width of DDL causing dispersive of colloids. Sodium ion has low
cation valency (one positive charge) that could increase the width of DDL. The Mo
Ion Concentration
dDDL(M1) dDDL(Mo)
Distance from Colloid Surface
M1
M1>M0
Ion Concentration
Mo [+ ion]
[- ion]
[+ ion] = [- ion] dDDL(Z2+)
dDDL(Z3+) dDDL(Z+)
Z+ Z2+ Z3+
Chapter 2 Soil and Water Interaction
hand, an increase in electrolyte concentration (Ca 2+ from gypsum) could narrow the
width of the DDL increasing the structural stability of soil and facilitating
infiltration.
2.4.3 Effects of Ions on Soil Hydraulic Conductivity (K)
With respect to the effect of ions on soil hydraulic properties, a relationship similar
to DDL is expected when the concentration of Na+ is increased in the soil solution
together with the electrolyte concentration in soil. Infiltration of water is dependent
on the hydraulic conductivity (K). A stable value of K is preferable in maximising
infiltration capacity, while decreasing K lowers infiltration capacity. The effects of
irrigation water quality (in terms of electrolyte concentration and the exchangeable
sodium percentage) on the hydraulic conductivity of the soils are shown graphically
in Figure 2.4.
[image:33.595.132.433.433.668.2]
Figure 2.4: The effect of exchangeable sodium percentage and electrolyte
concentration on hydraulic conductivity (K) of soil (adapted from Turner et al, 1984) 20
40
20 40
0
decreasing K (dispersion) stable K
(flocculation) Electrolyte
concentration mg/l
Chapter 2 Soil and Water Interaction
If the water has high electrolyte concentration and low exchangeable Na %, stable
values of K can be achieved and resulting in the flocculation of the colloids (stable
aggregates). A stable value of K for soils is preferable as it enhances the flow of
water. However, soil dispersion would occur if the infiltration water has a high
concentration of Na and low electrolyte concentration resulting in unstable K,
decreased infiltration capacity and wetting depth. Even slightly saline water with low
electrolyte (salt) concentration will not disperse soil if the salts do not contain
sodium. Therefore, some saline water containing high concentration of Na will
disperse soil and reduce hydraulic conductivity due to dispersion and consequent
blockage of pores.
2.5 Effects of Irrigation Water Quality on Soils
2.5.1Effects of Saline Water
The quality of irrigation water is an important factor for the management of soil.
Irrigation water with high amount of dissolved salts such as saline water has the
potential to adversely effect the environment. Secondary soil salinization and poor drainage quality are the typical impacts of saline water irrigation.
Table 2.2 shows a classification of waters from different sources which allows a
comparison among the salinity of drainage water, groundwater and surface water.
This classification was based on the electrical conductivity (EC) and total dissolved
solids (TDS) of the water. On the other hand, Table 2.3 provides guidelines for
interpretation of water quality and the corresponding potential problems in terms of
Chapter 2 Soil and Water Interaction
Table 2.2: Classification of water (Rhoades et al. 1992)
Type of water EC (dS/m) TDS (g/l) Water Class
Drinking water < 0.7 < 0.5 Non-saline
Tap water 0.03 0.02 Non-saline
Irrigation water 0.7 – 2.0 0.5 – 1.5 Slightly saline
Laundry Water 0.39 0.25 Slightly saline
Primary drainage water and groundwater
2.0 – 10.0 1.5 – 7.0 Moderately saline
Secondary drainage water and groundwater
10.0 -20.5 7.0 -15.00 High saline
Very saline water 20.0 – 45.0 15.0 – 35 Very highly saline
[image:35.595.109.531.90.251.2]Seawater > 45.0 > 35 Brine
Table 2.3: Guidelines for interpretations of water quality for irrigation (Ayers and Westcot, 1985)
Potential irrigation problem Units Degree of restriction on use
None Slight o moderate Severe
Salinity (affects crop water availability)
EC dS/m < 0.7 0.7-3.0 >3.0
TDS mg/l < 450 450-2000 >2000
Infiltration (affects infiltration rate of water into the soil)
SAR = 0-3 and EC = > 0.7 0.7-0.2 <0.2
SAR = 3-6 and EC = > 1.2 1.2-0.3 <0.3
SAR = 6-12 and EC = > 1.9 1.9-0.5 <0.5
SAR = 12-20 and EC = > 2.9 2.9-1.3 <1.3
SAR = 20-40 and EC = > 5.0 5.0-2.9 <2.9
Salinity in the form of sodium can directly affect soil properties through the
phenomena of swelling and dispersion. Sodium is a positively charged cation that
interacts with the negatively charged layers of clay particles. The clay negatively
charged layers are known as platelets. The electrophoretic mobility of the clay
platelets increases as the concentration of sodium increases. This process results in
swelling and dispersion of clay particles thus impacting on soil permeability
(Halliwell et al. 2001). With respect to the concept of the diffuse double layer, the
increased concentration of sodium would result in widen width of the DDL (as
Chapter 2 Soil and Water Interaction
2.5.2 Water With High SAR
The effects of water quality on soil properties are normally examined using the
concepts of Sodium Adsorption Ratio (SAR), and Electrical Conductivity (EC). SAR
is useful because it considers the relative distribution of monovalent and divalent
cations in irrigation water. SAR is the relationship of soluble sodium in water or as
the exchangeable ions in the solution, expressed by the following equation:
] [
5 . 0
] [
2
2+ +
+
+ ×
=
Mg Ca
Na SAR
where the concentration of ions, denoted by square brackets, are in milliequivalent
per litre (meq/L) in water or soil.
EC is an indicator of the total ion concentration in the water or in the soil solution,
(dS m-1 ) at 25 ºC. It is the reciprocal of electrical resistivity and a measure of soluble
salt content in solution.
Previous studies on greywater reuse have shown SAR to be a good indicator water
quality altering physical and plant biological processes (Patterson 1991). His study
showed that SAR values as low as 5 reduced saturated hydraulic conductivity (Ksat)
by over 2 orders of magnitude. In addition, ANZECC (1992) reported that SAR value of 5.5 can negatively affect plant growth and soil structure if the soil has an
exchangeable sodium percentage (ESP) of 10-15%.
Patterson (1996) examined the impacts of irrigation water quality on (Ksat) of soils by
varying SAR (1, 3, 8 and 15) and EC values; and infiltrating the effluent through
undisturbed samples of soils in replicated trials. Six soils types including a red-brown
earth were examined in his study. For A horizon, the overall Ksat decreased by 50%
from SAR0 to SAR3 and by 79% from SAR0 to SAR15. On the other hand, the
overall loss in Ksat of the subsoil was in the order of 30% from SAR0 to SAR3, but
Chapter 2 Soil and Water Interaction
irrigation water decreases Ksat of the exposed soil, especially that of the surface soil.
Thus, long term potential of soil to maintain its natural hydraulic conductivity could
be reduced when SAR of irrigation water is high. In addition, the reduction in Ksat
would reduce the expected lifetime of the areas used for disposal of wastewater due
to discharge at surface with the scope of contaminating surface water.
Where drainfields fail due to a reduction in Ksat, the effluent enters the surface
drainage system via run-off and is expected to carry nutrients (phosphates and
nitrogen) and other organisms such as faecal coliform that would likely contaminate
waterways (Patterson,1996). Therefore, to maintain desirable soil conditions, soluble
calcium and magnesium salts (gypsum) need to be applied to reduce SAR while
increasing EC to reduce adverse environmental impacts of wastewater irrigation.
Speirs and Cattle (2004) studied the effects of irrigation water of varying SAR in
several Vertosols. They pointed out that the structure of Vertosol surface horizons
were significantly affected by the sodium concentration of the irrigating solution.
Irrigation water of high SAR decreased the connectivity of macrospores. Reduced
connectivity of macropores could result in lower infiltration rate and reduced
hydraulic conductivity of the soils.
Emdad et al. (2004) studied the effects of water quality on soil structure and
infiltration under furrow irrigation. Water with three different levels of sodium
concentration (SAR = 0.9, 10 and 30) was applied as an alternative treatments to a
clay loam soil. They found an increase in bulk density and decline in infiltration with
irrigation water of moderate and high EC-SAR due to reduced size and connectivity
of micropores. In this study, application of water with high SAR reduced aggregate stability, increased the bulk density of both the surface and underlying soil, and
reduced the total depth of infiltration and final (steady-state) values of infiltration
rate. The total depth of infiltration was reduced by 15% for the high EC-SAR
treatment. This infiltration reduction was associated with the formation of the 5 cm
thick disturbed surface layer. Furthermore, the decrease in final infiltration rate with
successive applications of moderate and high EC-SAR water implied that the change
Chapter 2 Soil and Water Interaction
2.5.3 Water With High ESP
The effects of exchangeable sodium percentage on hydraulic conductivity and
swelling of clay soils were examined by McIntyre (1979). In this study, the soil
hydraulic conductivity and swelling were examined in relation to the exchangeable
sodium percentage (ESP), clay content and type, and the degree of subplasticity. The property of subplasticity referred to the stability of soil materials in their reaction
with water. Thus, soils with high subplasticity behave more like sands or gravels than
heavy clays. The study indicated that there was a continuos and initially very rapid
decrease in soil hydraulic conductivity when water with increasing ESP was applied.
Furthermore, ESP had significant effects on the hydraulic conductivity of the normal
plastic soils regardless their clay contents and types. On the other hand, ESP did not
have any effect on the hydraulic conductivity of the subplastic soils, and swelling
was small compared to their clay contents. The author argued that an ESP value
much less than 15 should be accepted as the value at which the soil physical
properties can be adversely affected. The article suggested an ESP value of 5 for
Australian soils.
Alperovitch et al. (1985) suggested that the reduction of hydraulic conductivity in
soils with high exchangeable sodium and electrolyte concentration was primarily
associated with an increase in tactoid swelling. This swelling resulted in reduced
diameter of soil pores, and therefore, increased the resistance to flow.
Ten years later, Crescimanno et al. (1995) conducted an experiment to investigate the
effects of ESP on soil structure and hydraulic characteristics. The study was carried
out to analyse the response of two soils to ESP values of up to 15. Both saturated and unsaturated hydraulic conductivities were examined using the constant-head method
and one-step outflow experiments respectively. The results showed that ESP from 2
to 5 caused the reduction in aggregate stability, and 25% decrease in hydraulic
conductivity. Therefore, they suggested the ESP values of 2 to 5 as indicating values
Chapter 2 Soil and Water Interaction
2.5.4 Consequences of Wastewater Irrigation
The concept of recycled water and reuse has been recognised as an alternative to
urban water management. There have been a number of studies and researches to
investigate the effects of irrigation water quality on the environment. Between the
years from 1955 until the present, many researches have been carried out at different
methodologies and scales to analyse the possible impacts of the reuse on the
properties of soils that receive the water. However, even some studies were
conducted as early as 1955, there were not many published literatures regarding the
effects of greywater reuse on soils until the 1990s. The investigation has been
intensified over the past five years due to the droughts and possible shortage in water
supply. There are a number of laboratory and field studies which have reported the
effects of altering the water quality on various soil properties.
AWRC (1992) expressed some concerns that irrigation with reclaimed wastewater
without proper control of salinity has the potential to create serious environmental
problems. This concern was supported by a banana irrigation trial of Battye-Smith (1992). The banana irrigation trial used effluent with the SAR value of 4.6 that
resulted in accelerated leaching of salts and an increased salinity of the ground water.
Coppola et al. (2004) conducted a multidisciplinary research to verify the
consequences of urban wastewater irrigation on both the hydraulic and dispersive
properties of soils in South Sardinia, Italy. In this research, ten undisturbed soil
monoliths with 120 cm in height and 40 cm in diameter were collected. Time domain
reflectrometry (TDR) probes were inserted horizontally at 15 cm intervals (starting
from a depth of 5 cm from the soil surface) to measure initial water content
distribution in the soil columns. They measured soil hydraulic and solute transport
properties before and after the application of wastewater. With wastewater
application, the sol surface developed a disturbed layer with reduced porosity and
dominated by narrow pores that decreased both water retention and hydraulic
conductivity. This process could be induced by the compaction, dispersion and
Chapter 2 Soil and Water Interaction
concluded that the changes occurring in the disturbed soil layer affected the mean
hydrological behaviour of the whole soil profile.
Amoozegar et al. (2004) studied the effect of grey water on hydraulic properties of
soils in North Carolina. The main objective of this study was to assess the impact
water generated from laundry and dishwashing machines of single-family home on
soil hydraulic properties. Ksat of each of the studied soils were measured using tap
water, water generated from laundry, and water generated from dishwashing
machine. They reported that the application of grey water from laundry and washing
machine resulted in substantial reduction in Ksat within a few days. Furthermore,
Toze (2005) suggested that the reduction of hydraulic conductivity is one of the
major impacts of laundry water reused on soils. Other laundry water characteristics
that have been identified to reduce hydraulic conductivity include nutrients which
cause excess growth of microorganisms in the soil, the present of suspended solids,
and the interaction of dissolved organic matter within the soil profile (Magesan et al.
2000).
From the literature reviewed above, there is considerable evidence that both physical
and chemical properties of soils are affected when soils are irrigated with
wastewater.
Chapter 3 Principles of measuring soil and water properties
Chapter 3
Principles of Measuring Soil and Water Properties
3.1 Principles of Soil Sampling
It is necessary to produce test samples that would represent the soil under
investigation. According to Reed and Rigney (1947), sampling errors are commonly
much grater than analytical errors. Therefore, it is necessary to minimise the
sampling errors. Rayment and Higginson (1992) suggested that sampling errors
could be minimised by using sampling equipment and containers known to be free
from relevant contamination.
Misra (1996), pointed out that if materials such as rocks or tree roots which have
significantly different compression characteristics form soil are presented,
ambiguous results may be obtained with physical measurements of soil in the field.
Furthermore, results of soil chemical analysis would not yield a value that describes
the property of the soil as a whole, if the sample analysed is not representative (Tan
1996). This view is supported by Clinne (1945) that the analytical value can serve as
an accurate description of the soil property only if the gross sample accurately
represents the whole soil from which it was taken. Therefore, producing the
representative samples is critical to the validity of the analytical results. However,
the size and accuracy of sampling are determined by many factors including the cost
of sampling.
3.1.1 Size and Accuracy of Sampling
The size of sampling is referred to (1) size which is the quantity of samples and (2)
the number of sample to be taken. There are a number of factors influencing the size
Chapter 3 Principles of measuring soil and water properties
literature (Tan 1996). Furthermore, the size of the sampling is significantly
determined by the cost. Although frequently the number of samples is decided
arbitrarily, both quantity and the number of samples taken are often restricted by the
economic considerations.
Rayment (1985) provided a method of calculating the preferred number of
sub-samples using a statistical analysis. In practice, a suitable number of sub-samples would
usually involve making a composite from around 15 to 30 sub-samples (Rayment
and Higginson 1992).
3.1.2 Mechanics of Sampling
Soil sampling tubes, augers spades and/or shovels are tools that can be used to collect
soil. Shallow sampling includes collection of undisturbed and disturbed cores near
surface of soil. For some measurements, the best result will be obtained by
maintaining the natural structure of the soil (undisturbed). However, loose material
that has been broken or sieved would be more appropriate for others measurements
such as pH and EC (Tan 1996). Table 3.1 shows the preferred specimen types for soil
physical determinations.
Table 3.1: Preferred sampling of soil (adapted from Tan 1996)
Measurement Preferred Alternative No. of Replicates
Matric potential: -10 m to -150 m
Small aggregates (1-5 mm)
Ground and sieved soil (< 2 mm)
1-2
Ksat, laboratory Undisturbed large core
Undisturbed small core
3-5
Particle size distribution
Ground and sieved soil (<2mm)
- 1
Bulk density and pore space relations
Undisturbed small core
Large clod 3-5
Undisturbed samples of soil are collected within a box (die) or a tube which is driven
carefully into the soil. The sample is cut loose with a knife. Undisturbed samples are
Chapter 3 Principles of measuring soil and water properties
Disturbed samples are collected with an auger, a tube or a core sampler. The centre
portion of the sample is cut, lifted and placed in a clean plastic bag. The collected
units may be mixed in a plastic bucket thoroughly until a completely homogeneous
mixture is attained (Tan 1996), ground and remoulded to produce disturbed cores.
3.1.3 Preparation of soil cores
Care must be taken to avoid contamination and to prevent the occurrence of further
chemical reactions. According to Tan (1996), air drying is the most accepted
procedure of sample preservation and samples should not be allowed to stay moist
for extended period of time. Furthermore, drying at elevated temperature must be
avoided to prevent physical and chemical changes. A drying temperature of not
exceeding 35°C is recommended.
Tan (1996) recommended air drying of soil by spreading it in drying trays in an oven
at 40 °C, the soil then can be broken down by grinding. The grinding can be done by
using a mortar and pestle, rolling pin or mechanical grinder. However, the soil
should not be subjected t