Running Head: THE ECONOMIC VALUE OF PSYCHOLOGY
The economic value of psychology in Australia: 2001 Jeff Patrick
University of Southern Queensland
Correspondence to: Jeff Patrick
Department of Psychology University of Southern Queensland Toowoomba Queensland 4350, Australia
E-mail: parick@usq.edu.au
Word Length: 6707
Abstract
The purpose of this paper was to update the Guldberg & Sivaciyan (1995) estimates of the value of psychology based on 1991 figures. In addition, this paper expands the scope of their work by including comparisons of other related professional groups (those with tertiary training in psychiatry, mental health nursing, social work, counselling, occupational therapy, and human resources). Economic modelling indicated that psychology contributes $8.6 billion to the National economy – some 500% more than in 1991, and more than all other related professional groups combined. However,
psychology incomes in most sectors have marginally decreased in real terms, and still lag 9.2% behind related professionals. The number of individuals trained in psychology has also risen dramatically to at least 37,978. Many of these individuals (17,364) have only a bachelor degree, and experience a higher rate of unemployment than both their higher qualified peers in psychology, and the national average for individuals with the same level of qualification. The ongoing lack of Federal funding for professional higher degrees, and the training guidelines of the Australian Psychological Society are likely to lead to rises in the cost of postgraduate education in the coming years. There is
The economic value of psychology in Australia: 2001
In 1995, Hans Guldberg and Seven Sivaciyan were the first to systematically estimate the economic value of psychology in Australia, thanks to a commission from the Australian Psychological Society (APS). Their figures were current as at the 1991 Census and the corresponding National Account figures. Estimates such as these have been valuable to the profession, and have been quoted by the APS in a number of submissions to Government over the past half-decade (e.g. their submission to the Review of Higher Education Financing and Policy). However, estimates lose their currency if they are not updated. The purpose of this paper is to update the Guldberg & Sivaciyan (1995)
estimates of the value of psychology in 1991, to estimates based on the 2001 Census and the corresponding National Account figures (Australian Bureau of Statistics 2002, 2003). In addition, this paper will expand the scope of Guldberg & Sivaciyan’s (1995) work by including comparisons of other related professional groups (those with tertiary
qualifications in psychiatry, mental health nursing, social work, counselling, occupational therapy, and human resources).
The Economic Value of Psychology
estimates at all, when it comes to communicating to policy makers and funding bodies the value of the profession.
Guldberg and Sivaciyan (1995) defined the direct economic value of psychology in terms of its contribution to Gross Domestic Product (GDP). GDP is a national
accounting measure of production occurring in the whole economy. Everyone that works for an income contributes to it, and collective productivity is always worth more than we are collectively paid, because we utilise other non-human resources to increase our productivity. Australia (as do other OECD member countries) uses GDP as their primary estimate of the economic value of industry. Guldberg and Sivaciyan (1995) noted that while a professional groups are not an industry, the same principle of estimating productivity could apply to groups of professionals if one could logically attribute a portion of productivity to the professionals within that industry. I should highlight at this stage the use of the terms profession and professionals. For the purposes of this
discussion, the former refers to the group to which one identifies, and is qualified. The latter refers to any individual who works for a living, and who holds some level of related tertiary qualification. By these definitions, a profession is a recognised subset of
professionals. Unfortunately, there is no direct way to make this distinction from the National Accounts figures regularly provided by the Australian Bureau of Statistics (ABS). The economic modelling presented below therefore refers to the collective
economic contribution of professional groups. The micro-economic implications of these estimates can, and will later be applied to the profession of psychology.
Census of 1991. They first determined the number of people with psychology
qualifications (bachelor degree or higher) working in each industry, and then determined their total income (ΨPayrollind). Guldberg & Sivaciyan (1995) then determined the total payroll for each industry (everyone including those with psychology qualifications - TotalPayrollind). Finally they turned to corresponding (1991) National Account figures in order to determine the ratio of GDP (GDPind) to payroll for each industry. Assuming that those with psychology qualification contribute at least as much to productivity as other workers (i.e. the same ratio applied at least on a gross level), they could estimate the contribution of those with psychology qualification to GDP for each industry from their income (Equation 1).
(1)
This methodology implies a number of things. Firstly, the total of what
psychology graduates are paid is a key feature of the calculation on the basis that their income flows back into the economy as spending and investment. This is not to say that the professional group is paid what they are worth, merely that in a capitalist economy we are manifestly willing to work (supply) for what the country is currently prepared to pay (demand). Secondly, this figure includes everyone with an undergraduate degree or higher in psychology, whether or not they are registered as a psychologist, and whether or not they earn an income. This is so for the simple reason that most everyone with
qualifications uses their training (by virtue of their choice to undertake it) in their work – not just registered psychologists. Likewise, the fact that many individuals with
psychology qualifications work casually, part-time, voluntarily, or not at all, is also a fair reflection of the range of professional outcomes (and hence the direct economic value). Finally, the degree to which workers contribute to GDP varies with the nature of the industry. Some industries are more reliant on capital plant and equipment than on staff (e.g. mining); hence the ratio of GDP to payroll is much higher than in an industry like education. Nonetheless, the logic of this method still holds because the miner using a multi-million dollar piece of equipment is potentially more productive than a hundred miners with picks and shovels. Psychology may not have the same degree of productivity amplifying technology, but GDP still has a meaningful (albeit varying) relationship with payroll.
Guldberg and Sivaciyan (1995) also spoke of what they termed social value, which is the economic value of preventing illness, treating illness more cost-effectively, and optimising human performance. Ideally the economic and social value should be one and the same, but the lack of methods to reliably estimate the social benefits of
Nevertheless, Guldberg and Sivaciyan (1995) attempted to estimate the gap between direct economic value and social value by examining the difference in the average income for those qualified in psychology, compared to those qualified in other disciplines, and then add this percentage on to the direct economic value of psychology. Strictly speaking, this method will invariably underestimate the true social value because it does not directly value current direct or interaction effects, or long-term effects for individuals, families, organisations, or communities. This method can however identify an unjustifiable market anomaly in the way the economy values one professional group compared to others. Correcting any gap in income would therefore close any gap in relative economic value, but not necessarily close the gap between direct economic value and the social value of psychology, because the adjustment could be in either direction. In other words, the value of psychology as a profession could just as easily be reduced if their salaries were above the average professional salary. For this reason, Guldberg and Sivaciyan’s (1995) method for estimating social value was not used here, nor is any alternative yet available.
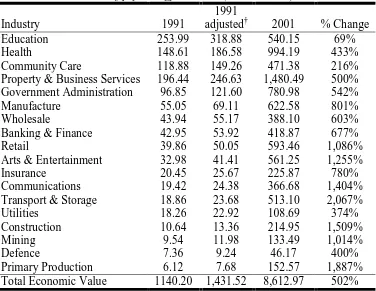
Guldberg and Sivaciyan’s (1995) figures of the economic value of psychology have been adjusted for inflation (1991 to 2001) and corrected for a few minor
from a relatively low base in 1991. Psychology has also benefited from the combined effects of a strong growth in GPD over the decade (ABS, 2002), a marked increase in the number of individuals trained in psychology (Table 6), and a dramatically higher growth rate for psychology jobs compared to virtually every other occupational group which has increased the proportion of psychology trained individuals as a function of the total workforce (ABS, 2001).
Individual Income
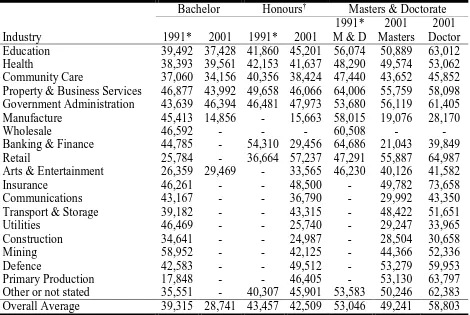
Table 3 shows the increase/decrease in average annual earning from 1991 to 2001. Because the ABS gathers information about income groups rather than exact income, these figures are not statistical means, but the weighted average (weighted by the number of individuals in each income group) of income group medians. For this reason the weighted means were not calculated for cells with less than 30 individuals because the weighted mean may not reflect the true mean for so few individuals.
The figures in Table 3 point to a real decrease in annual income in most sectors. While it is impossible from these figures to determine the cause of the decline, it may be the combined effect of industry deregulation, industrial reforms, and increases in
permanent part-time and casual employment. Specifically, a decline in the average income in the Manufacture, Utilities and Banking sectors probably does point to a dramatic proportional increase in the number of part-time and casual staff with
psychology qualifications. This reduction in real terms was also reflected for those with Masters and Doctoral qualifications in the Property & Business Services, and Arts & Entertainment industries. There was also a decline in average real income for those with either Bachelor or Honours qualification (the former being quite dramatic). Further research into the causes of these declines is needed. It is also evident that there is a clear progression in average annual income positively associated with the level of
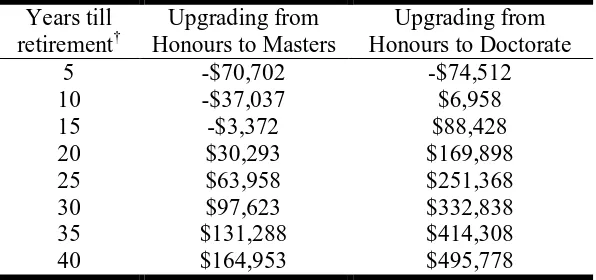
Implications for postgraduate students
Now that the difference between the average incomes for those with Honours (or equivalent), Masters, and Doctorate is evident, one can estimate the average gross economic benefit (net present value) of undertaking postgraduate studies by multiplying the difference in income by the number of years until retirement. In fairness, this figure should be tempered by the costs the student faces in the form of lost income while studying and direct Program fees. In order to produce the figures displayed in Table 4 I have assumed that the student will study full-time (2 years for Masters and 3 years for Doctorate) and forgo what their lower degree average income would have been for that time ($42,509). I have also assumed that the cost of the degree is the average of the fees available on the websites of Australian universities in 2003 (it is also worth highlighting that Masters Courses ranged from Government [HECS] subsidised to $37,820,
Professional Doctorates ranged from $18,000 to $44,000). The net economic benefit is therefore the gross economic benefit which varies depending on the number of years to retirement, minus the loss in income, minus the cost of the degree (in this example $19,349 for Masters, and $28,455 for Doctorate).
more highly qualified individuals tend to do better on average. It is also likely that these figures are underestimations given that the only other alternative to gaining professional registration is a supervised practice program. While State and Territory requirements vary, this non-degree alternative is not without cost if private colleges and supervisors charge a fee for their services.
These estimates clearly indicate that there is room for postgraduate program fees to rise substantially without compromising the favourable cost-benefit surplus for most students. In fact preliminary modelling indicates this may need to occur rapidly over the coming years. Postgraduate programs that are not largely or wholly research degrees, do not attract any Australian government funding, and the failure of these programs to break-even and yet continue to employee staff, could amount to misappropriation of public funds in the eyes of the Australian Auditor General. In order for postgraduate programs to meet APS (2000) Accreditation Guideline they need to maintain a full-time equivalent (FTE) student to full-time equivalent staff ratio of 6 to 1 or better (Section 3.3.8). These guidelines also stipulate that 3 full-time staff members need to be largely associated with the program (Section 2.4.9). For the sake of this example I have
interpreted this to be equivalent to 2 FTE staff members for each postgraduate program. This would mean the minimum program would consist of 2 FTE staff, and no more than 12 FTE students (an annual FTE intake of 6 students per year for a Masters program).
facilities are provided free by the university, then a Masters program could not break even charging $20,000 (around the 2003 average) per student per program even with an intake of 50 students per year. More realistically, in order to cover just university staff costs a Masters program with a minimum intake of 6 FTE students per year would need to charge around $25,000 per student per program (in 2001 dollars). Even with a larger number of students, a larger Masters program could not generate a revenue-to-cost surplus given the APS guidelines to maintain a minimum student/staff ratio. If the program could not contain its costs as has been assumed here, or wanted to achieve a surplus, then even higher fees in the order of $30,000 per student per program (again, in 2001 dollars), will need to be charged. Program fees would need to be half as much again for a Professional Doctorate program.
Perhaps more than any other estimates presented in this paper, the cost of
postgraduate training is the least definitive. The issue of compliance with APS guidelines, and cost containment is complicated when one considers that guidelines and their
interpretation are under regular revision, anecdotal evidence from a former Head of Department (G. Fogarty, personal communication, May 7, 2004) suggests that staff costs can easily be twice the estimates presented here, and the definition of direct and indirect costs is not at all clear. While further research is warranted, what is clear is that there is strong upward pressure of postgraduate course fees.
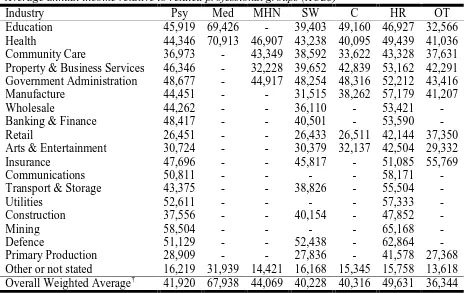
Implications for professional income
evident for all the professional groups related to psychology. It is also evident that those with tertiary qualifications in psychology are paid less on average than related
professional groups. In fact, those with psychology qualifications would need to be paid 9.2% more just to receive the average annual income ($45,778). One can interpret this to be a fair standard professional income for professional groups related to psychology. What this implies for psychologists in private practice is captured in Equation 2.
(2)
The standard session fee (SSF) should be some rational function of the standard professional income (SPI), the percent of gross income needed to cover overheads (OH%), the number of working weeks in a year (WW), and the number of sessions per week (SpW). Estimates presented above suggest that the SPI for those with a Masters degree (the criteria for membership of the APS) should be $53,771 (Table 3 average for Masters plus 9.2%). Research by Garton and Symons (2001) showed that only 8.9% of private practicing psychologists in Australia face overheads greater than 64% of gross income (OH%). This figure would therefore cover professional expenses for the majority of private practicing psychologists. Assuming a full-time professional takes 4 week holiday per year, and enjoys 10 public holidays, the WW would be 46. And finally it is assumed that if a psychologist works a 40 hour week that half that time will be devoted to administration, professional development, report writing, preparation. The balance of the working week (20 hours) constitutes the billable hours (i.e. the potential for 20 sessions per week: SpW).
SpW WW OH
SPI
SSF ÷ ÷
− =
(3)
While this model could be refined to account for more empirically based
estimates of SpW, it does suggest that SSF should have been $162 in 2001 (Equation 3). While this figure should be indexed each year in order to keep pace with inflation, it is also possible to discount it without adversely affecting income if business expenses can be contained under 64% of gross income.
Professional Supply and Demand
While Table 6 shows the change in number of persons with qualifications in psychology, these figures are likely to be underestimations because anyone who has subsequently gained a higher qualification in another discipline would be lost given the Census only ascertained the highest level of qualification. The figures in Table 6 indicate that there were 37,978 individuals with a bachelor degree or higher in psychology. Of these only 13,943 had qualifications of Honours (or equivalent) or higher, and could therefore (at least historically) be registered as Psychologists. In fact, there were 18,761 either conditionally (provisionally) registered or fully registered as Psychologists in Australia in 2001 (figures available via public registers). The discrepancy of 4,818 more on State and Territory registers than were apparently qualified to be registered may give some indication of the magnitude of the underestimation. This reasoning appears to be supported by a study by de Looper (1994) on 576 graduates with a major in psychology found that 35.4% went on to gain higher qualifications in another discipline. If de
Looper’s (1994) estimate is correct then about 35.4% of those registered (6,641) would have a higher degree in a field other than psychology (e.g. Public Health or Business Administration). Thus, while it may be an underestimation, the best estimate of the growth in the number of those with psychology qualifications is 53.8% between 1991 and 2001. The membership of the APS grew by 106% (to 13,007) during the same decade (Crowe, 2001). Quite simply, Psychology in Australia has never before seen a period of such dramatic growth.
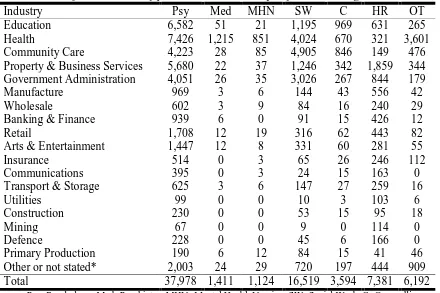
Table 7 also illustrates that there are more individuals with psychology qualifications in virtually every industry than all other related professional groups combined. The exceptions was in Community Care where those with qualifications in social work were dominant, and the Utilities and Mining industries where those with qualifications in human resources were dominant.
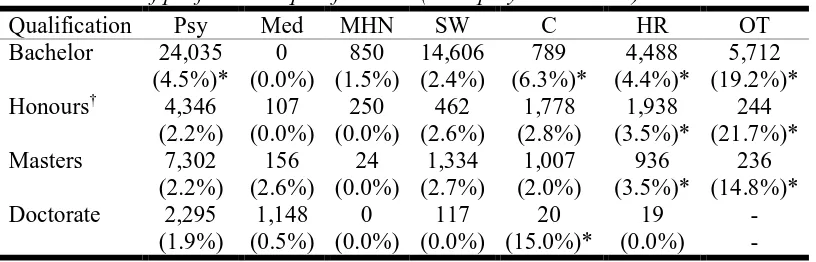
Table 8 illustrates two issues, the high numbers of individuals with qualifications in psychology at every level of degree relative to other related professional groups, and the marginal oversupply of those with only a bachelor qualification in psychology. At 4.5% the unemployment rate was above the National average for those with university qualifications at 3.4%.
absorbed. That is not the same thing as saying that these graduates have nothing to offer, or that they would not be productive if employed, or indeed that they will not one day be employed – merely that they were not then employed. Oversupply and ongoing
governmental cost containment can place downward pressure on professional remuneration. Given psychology in the United States also faces a broadly similar situation one could argue for the need to curtail the training of psychologists (Robiner, 1991).
There are at least four possible responses to oversupply among undergraduates. Firstly, ignore it. The oversupply is only marginal and may only be temporary as capitalist markets usually move to close temporary anomalies. Secondly, undergraduate intake could be limited. While this may improve the average quality of students, it is likely to be unpopular with Psychology Departments struggling to maintain their income. Thirdly, mandate a higher level of professional training where the graduates are more employable (Helmes & Wilmoth, 2002). While there may be benefits to this, simply mandating more time in training does not ensure quality training and hence a better level of professional skills (Dyck & O’Donovan, 2003).
negative impact on public perception. Janda et al. (1998) went on to argue that psychologists should emphasise the scientific nature of their profession and strive to differentiate psychology form other related professional groups, but this too is difficult if epistemological debate undermines a collective stance.
It is also important to recognise that while there may be a marginal oversupply of those with no more than a bachelor degree in psychology, this gross level of analysis does not take sufficient account of different supply and demand situations in each State and Territory, rural and metropolitan areas, the constantly expanding nature of the profession (VandenBos, DeLeon & Belar, 1991), or the different specialisations within the
profession of psychology (Pion, 1991). The data available in the Census is less helpful in this regard because it is no more specific about each individual’s qualifications than to denote them as “psychology” or “behavioural science”. Nevertheless, a crude insight into differential demand can be gleaned from a comparing the ratio of registered psychologists to the total population in each State and Territory (as at the 2001 Census). The Australian Capital Territory is the best supplied (628 persons for every psychologist, p/ψ), followed by Victoria (805 p/ψ), New South Wales (959 p/ψ), and Western Australia (1,062 p/ψ). Queensland (1,281 p/ψ), the Northern Territory (1,359 p/ψ), Tasmania (1,698 p/ψ), and South Australia (1,766 p/ψ) had less psychologists per capita than the National average (1,195 p/ψ). Clearly, further research and debate is warranted.
Summary
psychology declined in real terms over this period, and still lags 9.2% behind related professional groups. There is nevertheless a clear economic advantage to most students undertaking a professional postgraduate degree, however the cost of these degrees are likely to rise substantially in the coming years.
APS recommended fees may be marginally low given the economic modelling presented here, but simple supply and demand issues may mean that many psychologists in private practice struggle to achieve a professionally comparable income.
References
Australian Bureau of Statistics. (2001). The labour force, Australia (6203.0 May 2001). Canberra: Author.
Australian Bureau of Statistics. (2002). National income, expenditure and product, Australian national accounts (5206.0 December 2001). Canberra: Author. Australian Bureau of Statistics. (2003). Consumer price index, Australia (6401.0).
Canberra: Author.
Australian Psychological Society. (2000). APS Accreditation Guidelines. Melbourne: Author.
Cascio, W. F. (2000). Costing Human Resources: The financial impact of behaviour in organisations (4th ed.). Cincinnati: OH, South-Western College Publishing. Crowe, B. (2001). Today & tomorrow. InPsych, 23(1), 32-35.
de Looper, M. W. (1994). Career paths of psychology graduates. Unpublished masters dissertation, Australian National University, Canberra.
Dyck, M. J. & O’Donovan, A. (2003). What are the benefits of longer training in psychology? A comment on Helmes and Wilmoth (2002). Australian Psychologist, 38(3), 214-215.
Fitz-enz, J. (2000). The ROI of human capital: Measuring the economic value of employee performance. New York: Amacom.
Garton, A. F. & Symons, M. S. (2001). Survey of independently practicing psychologists: A snapshot at the start of the 21st century. InPsych, 23(2), 28-34.
Groth-Marnat, G. & Edkins, G. (1996). Professional psychologists in general health care settings: A review of the financial efficacy of direct treatment interventions. Professional Psychology: Research and Practice, 27(2), 161-174.
Guldberg, H. & Sivaciyan, S. (1995). The economic and social value of psychology in Australia. Melbourne: Australian Psychological Society.
Helmes, E., & Wilmoth, D. (2002). Training in clinical psychology in Australia: A North American perspective. Australian Psychologist, 37, 52-55.
Janda, L. H., England, K., Lovejoy, D. & Drury, K. (1998). Attitudes toward psychology relative to other disciplines. Professional Psychology: Research and Practice, 29(2), 140-143.
Kaplan, R. M. & Groessl, E. J. (2002). Applications of cost-effectiveness methodologies in behavioural medicine. Journal of Consulting and Clinical Psychology, 70(3), 482-493.
Kenkel, D. S. (2000). Prevention. In A. J. Culyer & J. P. Newhouse (Eds.), Handbook of health economics (Vol 1, pp.1675-1720). Little Rock, AR: Elsevier Science. Knapp, M. (1999). Economic evaluation and mental health: Sparse past…Fertile future.
The Journal of Mental Health Policy and Economics, 2, 163-167.
Mason, J., Eccles, M., Freemantle, N. & Drummond, M. (1999). Incorporating economic analysis in evidence-based guidelines for mental health: the profile approach. The Journal of Mental Health Policy and Economics, 2, 13-19.
Miller, N. E. & Magruder, K. M. (1999). Cost-effectiveness of psychotherapy: A guide for practitioners, researchers, and policy makers. New York: Oxford University Press.
Pion, G. M. (1991). A National human resources agenda for psychology: The need for broader perspective. Professional Psychology: Research and Practice, 22(6), 449-455.
Robiner, W. N. (1991). How many psychologists are needed? A call for a National psychology human resource agenda. Professional Psychology: Research and Practice, 22(6), 427-440.
Sinh, B., Hawthorne, G. & Vos, T. (2001). The role of economic evaluation in mental health care. Australian and New Zealand Journal of Psychiatry, 35, 104-117. VandenBos, G. R., Belar, C. D. & DeLeon, P. H. (1991). How many psychological
practitioners are needed? It’s too early to know! Professional Psychology: Research and Practice, 22(6), 441-448.
Author Note
Jeff Patrick, Department of Psychology, University of Southern Queensland. I would like to acknowledge the Department of Psychology at the University of Southern Queensland for their generous funding of this project. I would also like to thank Mick Symons for providing additional data on his study with Alison Garton, the
Registration Boards of every State and Territory for their data on the number of registered psychologists, and Grace Pretty and Analise O’Donovan for their valuable input on an early draft of this paper.
Table 1
Economic contribution of psychology to GDP* (AUS$ million)§
Industry 1991
1991
adjusted† 2001 % Change
Education 253.99 318.88 540.15 69%
Health 148.61 186.58 994.19 433%
Community Care 118.88 149.26 471.38 216%
Property & Business Services 196.44 246.63 1,480.49 500% Government Administration 96.85 121.60 780.98 542%
Manufacture 55.05 69.11 622.58 801%
Wholesale 43.94 55.17 388.10 603%
Banking & Finance 42.95 53.92 418.87 677%
Retail 39.86 50.05 593.46 1,086%
Arts & Entertainment 32.98 41.41 561.25 1,255%
Insurance 20.45 25.67 225.87 780%
Communications 19.42 24.38 366.68 1,404%
Transport & Storage 18.86 23.68 513.10 2,067%
Utilities 18.26 22.92 108.69 374%
Construction 10.64 13.36 214.95 1,509%
Mining 9.54 11.98 133.49 1,014%
Defence 7.36 9.24 46.17 400%
Primary Production 6.12 7.68 152.57 1,887%
Total Economic Value 1140.20 1,431.52 8,612.97 502%
Note. *GDP excludes property ownership. †Adjusted to 2001 equivalent value in order to account for inflation (as measured by the Consumer Price Index) between 1991 and 2001. §
Table 2
Relative economic contribution of related professional groups to GDP* (AUS$ million)†
Industry Psy Med MHN SW C HR OT
Education 540.15 6.33 1.16 84.15 85.13 52.92 15.42
Health 994.19 260.11 120.51 525.27 81.10 47.91 446.12
Community Care 471.38 4.03 11.12 571.48 85.87 19.49 54.08 Property & Business Services 1,480.49 5.84 6.71 277.86 82.40 555.82 81.82 Government Administration 780.98 5.42 6.23 578.31 51.09 174.53 30.78
Manufacture 622.58 0.79 4.51 65.59 23.78 459.52 25.02
Wholesale 388.10 0.41 4.20 44.18 12.68 186.74 14.65
Banking & Finance 418.87 2.73 - 33.96 6.46 210.33 6.25
Retail 593.46 4.81 7.11 109.72 21.59 245.24 40.23
Arts & Entertainment 561.25 6.79 2.03 126.94 24.34 150.78 20.37
Insurance 225.87 - 1.08 27.44 11.40 115.78 57.55
Communications 366.68 - 2.42 18.85 13.67 173.24 -
Transport & Storage 513.10 4.43 4.43 108.03 23.11 272.09 12.10
Utilities 108.69 - - 9.00 4.88 123.23 7.00
Construction 214.95 - - 52.96 7.56 113.12 16.76
Mining 133.49 - - 15.13 - 253.00 -
Defence 46.17 - - 9.35 1.30 41.33 -
Primary Production 152.57 3.68 8.79 64.95 14.29 47.35 34.97 Total Economic Value 8,612.97 305.38 180.29 2,723.17 550.67 3,242.42 863.10
Table 3
Average annual income (AUS$)
Bachelor Honours† Masters & Doctorate
Industry 1991* 2001 1991* 2001
1991* M & D
2001 Masters
2001 Doctor Education 39,492 37,428 41,860 45,201 56,074 50,889 63,012
Health 38,393 39,561 42,153 41,637 48,290 49,574 53,062
Community Care 37,060 34,156 40,356 38,424 47,440 43,652 45,852 Property & Business Services 46,877 43,992 49,658 46,066 64,006 55,759 58,098 Government Administration 43,639 46,394 46,481 47,973 53,680 56,119 61,405
Manufacture 45,413 14,856 - 15,663 58,015 19,076 28,170
Wholesale 46,592 - - - 60,508 - -
Banking & Finance 44,785 - 54,310 29,456 64,686 21,043 39,849
Retail 25,784 - 36,664 57,237 47,291 55,887 64,987
Arts & Entertainment 26,359 29,469 - 33,565 46,230 40,126 41,582
Insurance 46,261 - - 48,500 - 49,782 73,658
Communications 43,167 - - 36,790 - 29,992 43,350
Transport & Storage 39,182 - - 43,315 - 48,422 51,651
Utilities 46,469 - - 25,740 - 29,247 33,965
Construction 34,641 - - 24,987 - 28,504 30,658
Mining 58,952 - - 42,125 - 44,366 52,336
Defence 42,583 - - 49,512 - 53,279 59,953
Primary Production 17,848 - - 46,405 - 53,130 63,797
Other or not stated 35,551 - 40,307 45,901 53,583 50,246 62,383 Overall Average 39,315 28,741 43,457 42,509 53,046 49,241 58,803
Table 4
The average net present economic benefit to students of postgraduate psychology qualifications*
Years till retirement†
Upgrading from Honours to Masters
Upgrading from Honours to Doctorate
5 -$70,702 -$74,512
10 -$37,037 $6,958
15 -$3,372 $88,428
20 $30,293 $169,898
25 $63,958 $251,368
30 $97,623 $332,838
35 $131,288 $414,308
40 $164,953 $495,778
Table 5
Average annual income relative to related professional groups (AUS$)*
Industry Psy Med MHN SW C HR OT
Education 45,919 69,426 - 39,403 49,160 46,927 32,566
Health 44,346 70,913 46,907 43,238 40,095 49,439 41,036 Community Care 36,973 - 43,349 38,592 33,622 43,328 37,631 Property & Business Services 46,346 - 32,228 39,652 42,839 53,162 42,291 Government Administration 48,677 - 44,917 48,254 48,316 52,212 43,416
Manufacture 44,451 - - 31,515 38,262 57,179 41,207
Wholesale 44,262 - - 36,110 - 53,421 -
Banking & Finance 48,417 - - 40,501 - 53,590 -
Retail 26,451 - - 26,433 26,511 42,144 37,350
Arts & Entertainment 30,724 - - 30,379 32,137 42,504 29,332
Insurance 47,696 - - 45,817 - 51,085 55,769
Communications 50,811 - - - - 58,171 -
Transport & Storage 43,375 - - 38,826 - 55,504 -
Utilities 52,611 - - - - 57,333 -
Construction 37,556 - - 40,154 - 47,852 -
Mining 58,504 - - - - 65,168 -
Defence 51,129 - - 52,438 - 62,864 -
Primary Production 28,909 - - 27,836 - 41,578 27,368
Other or not stated 16,219 31,939 14,421 16,168 15,345 15,758 13,618 Overall Weighted Average† 41,920 67,938 44,069 40,228 40,316 49,631 36,344
Note. Psy=Psychology, Med=Psychiatry, MHN=Mental Health Nursing, SW=Social Work, C=Counselling, HR=Human Resources, OT=Occupational Therapy. *2001 dollars, for individuals with a bachelor degree of higher. †
Table 6
Number of persons with psychology qualifications
Bachelor Honours* Masters & Doctorate
Industry 1991 2001 1991 2001
1991 M & D
2001 Masters
2001 Doctor
Education 3,004 3,179 512 781 1,716 1,424 1,198
Health 1,754 3,182 271 1,091 1,222 2,667 486
Community Care 1,992 2,613 308 683 524 845 82
Property & Business Services 1,074 4,111 134 582 255 753 234 Government Administration 1,626 2,736 211 504 350 704 107
Manufacture 514 803 24 64 43 93 9
Wholesale 402 509 21 45 36 39 9
Banking & Finance 463 780 31 62 69 83 14
Retail 676 1,512 40 104 54 89 3
Arts & Entertainment 638 1,226 24 89 76 101 31
Insurance 229 423 7 45 29 37 9
Communications 157 340 23 20 14 31 4
Transport & Storage 226 524 18 41 25 57 3
Utilities 84 71 6 13 12 12 3
Construction 121 191 12 11 15 22 6
Mining 33 49 12 6 3 12 0
Defence 132 141 19 33 25 38 16
Primary Production 95 139 9 18 12 18 15
Other or not stated† 4,144 1,506 258 154 911 277 66
Overall Average 17,364 24,035 1,940 4,346 5,391 7,302 2,295
Table 7
Available workforce: Number of persons with bachelor qualifications or higher
Industry Psy Med MHN SW C HR OT
Education 6,582 51 21 1,195 969 631 265
Health 7,426 1,215 851 4,024 670 321 3,601
Community Care 4,223 28 85 4,905 846 149 476
Property & Business Services 5,680 22 37 1,246 342 1,859 344 Government Administration 4,051 26 35 3,026 267 844 179
Manufacture 969 3 6 144 43 556 42
Wholesale 602 3 9 84 16 240 29
Banking & Finance 939 6 0 91 15 426 12
Retail 1,708 12 19 316 62 443 82
Arts & Entertainment 1,447 12 8 331 60 281 55
Insurance 514 0 3 65 26 246 112
Communications 395 0 3 24 15 163 0
Transport & Storage 625 3 6 147 27 259 16
Utilities 99 0 0 10 3 103 6
Construction 230 0 0 53 15 95 18
Mining 67 0 0 9 0 114 0
Defence 228 0 0 45 6 166 0
Primary Production 190 6 12 84 15 41 46
Other or not stated* 2,003 24 29 720 197 444 909
Total 37,978 1,411 1,124 16,519 3,594 7,381 6,192
Table 8
Relative level of professional qualifications (unemployment rate %)
Qualification Psy Med MHN SW C HR OT
Bachelor 24,035 (4.5%)* 0 (0.0%) 850 (1.5%) 14,606 (2.4%) 789 (6.3%)* 4,488 (4.4%)* 5,712 (19.2%)* Honours† 4,346
(2.2%) 107 (0.0%) 250 (0.0%) 462 (2.6%) 1,778 (2.8%) 1,938 (3.5%)* 244 (21.7%)* Masters 7,302
(2.2%) 156 (2.6%) 24 (0.0%) 1,334 (2.7%) 1,007 (2.0%) 936 (3.5%)* 236 (14.8%)* Doctorate 2,295
(1.9%) 1,148 (0.5%) 0 (0.0%) 117 (0.0%) 20 (15.0%)* 19 (0.0%) - -
Note. Psy=Psychology, Med=Psychiatry, MHN=Mental Health Nursing, SW=Social Work, C=Counselling, HR=Human Resources, OT=Occupational Therapy. *National average