HOS-Miner: A System for Detecting Outlying
Subspaces of High-dimensional Data
Ji Zhang
1, Meng Lou
1, Tok Wang Ling
2, Hai Wang
1 1Department of Computer Science, University of Toronto,
Email:
{
jzhang, mlou, hai
}
@cs.toronto.edu
2
Department of Computer Science, National University of Singapore
Email: [email protected]
Abstract
We identify a new and interesting high-dimensional outlier detection problem in this paper, that is, detecting the subspaces in which given data points are outliers. We call the subspaces in which a data point is an outlier as its Outlying Subspaces. In this paper, we will propose the prototype of a dynamic subspace search system, called HOS-Miner (HOS stands for High-dimensional Outlying Subspaces), that utilizes a sample-based learning process to effectively identify the outlying subspaces of a given point.
1
Introduction
Outlier detection is an important step in data mining that enjoys a wide range of applications such as the detection of credit card frauds, criminal activities and excep-tional patterns in databases. Outlier detection problem can typically be formulated as follows: given a set of data points or objects, find a specific number of objects that are considerably dissimilar, exceptional and inconsistent with respect to the remaining data.
To deal with the above definition of outlier detection problem, numerous research works have been proposed. They can broadly be divided into the distance-based methods [5, 6, 8] and the local density-based methods [3, 4, 7]. However, many of these outlier detection algorithms are unable to deal with high-dimensional datasets effectively as many of them only consider outliers in the entire space. This implies that they will miss out on the important information about the subspaces in which these outliers exist. Recently, a new technique in high-dimensional outlier detection uses evolutionary search method [1] where outliers are detected by searching for sparse subspaces. Points in these sparse subspaces are assumed to be the outliers. All the exiting outlier detection techniques, regardless of in low or high dimensional scenario, invariably fall into the framework of detecting outliers in a specific data space, either in the full space or a certain subspace. We term these methods ”space → outliers” techniques. For instance, [1] detects outliers by first finding locally sparse subspaces, and [6] discoveries the so-called Strongest/Weak Outliers by first finding the Strongest Outlying Spaces.
x x x x
x x x x x x
* p
x x
x x
x x x x x x
* p
x x x
x x xx
x x
x
[image:2.595.220.393.123.175.2]* p
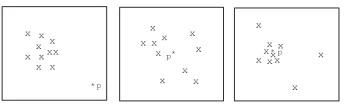
Figure 1: 2-dimensional views of the high-dimensional data
While knowing which data points are the outliers can be useful, in many appli-cations, it is more important to identify the subspaces in which a given point is an outlier, which motivates the proposal of a new technique in this paper to handle this new outlier detection task. First, let us consider the example in Figure 1 where three 2-dimensional views of the high-dimensional data are presented. Note that pointp exhibits different outlying degrees in these three views. In the leftmost view, p is clearly an outlier. However, this is not so in the other two views. There are also a number of real-life applications that can benefit from the results of the this new task. In the case of designing a training program for an athlete, it is critical to identify the specific subspace(s) in which an athlete deviates from his or her teammates in the daily training performances. Knowing the specific weakness (subspace) allows a more targeted training program to be designed. In a medical system, it is useful for the Doctors to identify from voluminous medical data the subspaces in which a particular patient is found abnormal and therefore a corresponding medical treatment can be provided in a timely manner.
We will identify this new and interesting high-dimensional outlier detection prob-lem in this paper, that is, detecting the subspaces in which given data points are outliers. We call the subspaces in which a data point is an outlier as its Outlying Subspaces. We now formulate this new problem as following: given a data point or object, find the subspaces in which this data is considerably dissimilar, exceptional or inconsistent with respect to the remaining points or objects. This problem can be mathematically stated as: for any given pointp, find the set of subspacesS such that for each subspaces∈S, we haveODs(p)≥T, where OD is the distance function used
(to be discussed in the sequal). If the answer set is empty forp, we say thatpis not an outlier in any subspaces.
In this paper, we will propose the prototype ofa dynamic subspace search system, called HOS-Miner (HOS stands for High-dimensional Outlying Subspaces), that utilizes a sample-based learning process to effectively identify the outlying subspaces of a given point. In contrast to the so-called ”space→outliers” outlier detection techniques, our method can be described as a ”outlier →spaces” technique. To our best knowledge, this is the first such work in the literature so far.
Dynamic Subspace Searching
Detected Subspaces of Query Data
Users
Query Data
High-dimensional Dataset
Indexed High-dimensional data Sampled Data
Downward and upward pruning possibilities X-tree
Indexing
Dynamic Subspace Searching Random
Sampling
[image:3.595.219.392.122.238.2]Filter
Figure 2: The overview of HOS-Miner
2
Outlying Degree Measure and Its Properties
For each point, we define the degree to which the point differs from the majority of the other points in the same space, termed the outlying degree (OD in short). OD is defined as the sum of the distances between a point and itsk nearest neighbors. Mathematically speaking, the OD of a pointpin spacesis computed as:
OD(p, s) =
k
X
i=1
Dist(p, pi)|pi∈KN N Set(p, s)
whereKN N Set(p, s) is the set containing the KNNs ofpins.
OD maintains two interesting properties that allow the design of an efficient outlier subspace search algorithm.
Property 1: If a pointpis not an outlier in anm-dimensional subspaces, then it cannot
be an outlier in any subspace that is a subset ofs.
Property 2: If a pointp is an outlier in anm-dimensional subspaces, then it will be an
outlier in any subspace that is a superset ofs.
The above properties are based on the fact that the OD value of a point in a subspace cannot be less than that in its subset space. Mathematically, we have ODs1(p)≥ODs2(p) ifs1⊇s2.
3
HOS-Miner
3.1
Subspace Pruning
To find the outlying subspaces of a given point, we make use of the properties of OD to quickly detect the subspaces in which the point is not an outlier or the subspaces in which the point is definitely an outlier. All these subspaces can be removed from further consideration in the later stage of the search process.
There are two basic pruning strategies: the upward pruning strategy and the down-ward pruning strategy. In the downdown-ward pruning strategy, we make use of Property 1 of OD to quickly prune away those subspaces in which the point cannot be an out-lier. This is because ifODs1(p) < T, thenODs2(p) < T, where s1 ⊇s2 and T is
the distance threshold. In the upward pruning strategy, Property 2 of OD is utilized to detect those subspaces in which the point is definitely an outlier. The reason is that if ODs2(p) ≥ T, then ODs1(p) ≥ T. Hence, these detected subspaces can be
immediately returned in the answer set and excluded from further exploration in the subsequent search.
Next, we will compute the savings obtained by applying the pruning strategies during the search process quantitatively. Before that, let us first give three definitions.
Definition 1: Downward Saving Factor (DSF) of a Subspace
The Downward Saving Factor of an m-dimensional subspace s is defined as the savings obtained by pruning all the subspaces that are subsets ofs. In other words, the Downward Saving Factor ofs, denoted as DSF(s), is computed as:
DSF(s) =
m−1
X
i=1
Ci m∗i
whereCi
m denotes the combinatorial number of choosingi items out ofm items.
Definition 2: Upward Saving Factor (USF) of a Subspace
The Upward Saving Factor of anm-dimensional subspaces, denoted as USF(s), is defined as the savings obtained by pruning all the subspaces that are supersets of
s. It is computed as
U SF(s) =
d−m
X
i=1
[Ci
d−m∗(m+i)]
e.g. Refer to a 4-dimensional space, DSF([1,2,3]) = C31 ∗1 +C 2
3 ∗2 = 9 and
U SF(1,4]) =C1
2 ∗(2 + 1) +C 2
2∗(2 + 2) = 10.
Definition 3: Total Saving Factor (TSF) of a Subspace
The Total Saving Factor of anm-dimensional subspace, in terms of a query point
p, denoted as TSF(m, p), is defined as the combined savings obtained by applying the two pruning strategies during the search process. It is computed as follows:
T SF(m, p) =
pup(m, p)∗fup(m)∗U SF(m), m= 1
pdown(m, p)∗fdown(m)∗DSF(m)
+pup(m, p)∗fup(m)∗U SF(m), 1< m < d
pdown(m, p)∗fdown(m)∗DSF(m), m=d
where
(1) fdown(m) and fup(m) are the percentages of the remaining subspaces to be
searched. specifically,
and
fup(m) =Cup lef t(m)/Cup(m)
Let dim(s) denote the number of dimensions in subspaces. Cdown lef t(m) and
Cup lef t(m) are computed as:
Cdown lef t(m) =
X
dim(s)
wheresis unpruned or unevaluated subspaces anddim(s)< m.
Cup lef t(m) =
X
dim(s)
wheresis unpruned or unevaluated subspaces anddim(s)> m.
Cdown(m) andCup(m) are the total subspace search workload in the subspaces
whose dimensions are lower and higher thanm, respectively. Intuitively,fdown(m)
andfup(m) approximate the fraction of DSF and USF of anm-dimensional
sub-space that are potentially achievable in each step of the search process.
(2) pup(m, p) andpdown(m, p) are the probabilities that upward and downward
prun-ing can be performed in the m-dimensional subspace respectively. In other words, pup(m, p) =P or(ODs(p) ≥T) and pdown(m, p) = P or(ODs(p) < T),
wheresis anm-dimensional subspace. A difficulty in computing the two prior probabilities, i.e. pup(m, p) and pdown(m, p), is that their values cannot be
known without any priori knowledge of the dataset. To overcome this difficulty, we first perform a sample-based learning process to obtain some knowledge about the dataset and then apply this knowledge in the later subspace search for each query point.
3.2
Sampling-based Learning Process
To facilitate the computation ofpup(m, p) andpdown(m, p), we adopt a sample-based
learning process to obtain some prior knowledge about the dataset before subspace search of the query points are performed. In this learning process, a small number of points randomly sampled from the dataset are obtained and the subspace searches are performed on each of the sampling points. For each sampling pointsp, we set
pup(m, sp) =pdown(m, sp) = 0.5,1< m < d
pup(m, sp) = 1 andpdown(m, sp) = 0, m= 1
pup(m, sp) = 0 andpdown(m, sp) = 1, m=d
This implies that we assume there are equal probabilities for upward and downward pruning in the subspaces of any dimension, except 1 andd, for each sampling point. After all them-dimensional subspaces have been evaluated forsp, thepup(m, sp) and
pdown(m, sp) are computed as the percentage ofm-dimensional subspacess in which
ODs(sp)≥T and the percentage of subspacessin whichODs(sp)< T, respectively.
The averagepupandpdownvalues of subspaces from 1 toddimensions can be obtained
as follows:
pup(m) =
PS
i=1pup(m, spi)/S
whereS is the number of sampling points,pdown(1) =pup(d) = 0.
For each query pointp, we set pup(m, p) =pup(m) andpdown(m, p) =pdown(m)
in the computation of TSF(m, p) of the query pointp.
3.3
Dynamic Subspace Search
In HOS-Miner, we use a dynamic subspace search method to find the outlying sub-spaces of the sampling and query points. The basic idea of the dynamic subspace search method is to commence search on those subspaces with the same dimension that has the highest TSF value. As the search proceeds, the TSF of subspaces with different dimension will be dynamically updated and the set of subspaces with the highest TSF value are selected for exploration in each of subsequent steps. The search process terminates when all the subspaces have been evaluated or pruned. Note that the only difference between the dynamic subspace search method used on the sample points and query points lies in the decision of values ofpup(m, p) andpdown(m, p): For
sample points, we assume an equal probability of upward and downward pruning (re-ferring to Section 3.2) while for query points we use the averaged probabilities obtained in the learning process.
3.4
Result Refinement
Given the typically large number of data points in the dataset and outlying subspaces for each data point, which may overwhelm the users, we devise a filter in HOS-Miner to help refine the result returned by HOS-Miner. For each data point, HOS-Miner only returns the outlying subspaces with the lowest possible number of dimensions. This is because the subspaces that are supersets of a known outlying subspaces are also outlying subspaces. This outlying subspaces selection process adopts an upward search strategy which starts with outlying subspaces of the lowest number of dimension. A subspace is discarded if it is found to be a superset of a previously selected subspace. The whole selection process terminates when all the subspaces returned by HOS-Miner have been examined. Now, we will give an example to illustrate such outlying subspaces selection process. Let us suppose that the outlying subspaces of a data point, in a 4-dimensional space, are [1,3], [2,4], [1,2,3], [1,2,4], [1,3,4], [2,3,4] and [1,2,3,4]. The filter will only return [1,3] and [2,4] to the users and ignore all the rest. This is because all of remaining subspaces are supersets of either [1,3] or [2,4] or both.
4
The Plan of Demo
Our demo will consist of the following 4 parts.
First, we will present the new task of detecting the outlying subspaces of dimensional data by pictorially showing the different distribution nature of high-dimensional data points in varied subspaces, which motivate our research work. We will also show the audience some real-life applications in which our technique can be potentially applied. These examples will provide the audience with insights into the interesting notion of outlying subspaces for high-dimensional data and the valuable knowledge that can be explored from them.
Second, we will showcase the system architecture of HOS-Miner. Among the fo-cuses of system architecture demostration are thesampling-based learning module, the
HOS-Miner used to perform fast subspaces learning, exploration/pruning and filtering in high-dimensional space.
Third, by using both synthetic and real-life datasets, we will show to the audience the experimental evaluation of HOS-Miner and the comparative study of HOS-Miner and the latest high-dimensional outlier detection technique, i.e. the evolutionary-based searching method, in terms of efficiency and effectiveness under a wide spectrum of settings.
Finally, we will showcase the prototype of HOS-Miner and the audience will be encouraged to play the demo interactively themselves.
References
[1] C. C Aggarwal and P.S. Yu. Outlier Detection in High Dimensional Data. Proc.
ACM SIGMOD’00, Santa Barbara, California, 2001.
[2] S. Berchtold, D. A. Keim and H. Kriegel. The X-tree: An Index Structure for High-Dimensional Data. Proc.VLDB’96, Mumbai, India, 1996.
[3] M. Breuning, H-P, Kriegel, R. Ng, and J. Sander. LOF: Identifying Density-Based Local Outliers. Proc.ACM SIGMOD’00, Dallas, Texas, 2000.
[4] W. Jin, A. K. H. Tung, J. Han. Finding Top n Local Outliers in Large Database. Proc.SIGKDD’01, San Francisco, CA, August, 2001.
[5] E. M. Knorr and R. T. Ng. Algorithms for Mining Distance-based Outliers in Large Dataset. Proc.VLDB’98, pages 392-403, New York, NY, August 1998. [6] E. M. Knorr and R. T. Ng. Finding Intentional Knowledge of Distance-based
Outliers. Proc.VLDB’99, pages 211-222, Edinburgh, Scotland, 1999.
[7] S. Papadimitriou, H. Kitagawa, P. B. Gibbons, and C. Faloutsos: LOCI: Fast Outlier Detection Using the Local Correlation Integral. Proc. ICDE’03, pages 315, Bangalore, India, 2003.