Assessing Individual Student Performance in a Team-based
Engineering Problem Solving Course
Thiru Aravinthan, Paul Fahey, John Worden
University of Southern Queensland, Australia
Abstract:
The Faculty of Engineering and Surveying at the University of Southern Queensland (USQ) has introduced a series of Problem-Based Learning (PBL) courses as part of the curriculum1-3. Engineering Problem Solving 2 (ENG2102) was introduced in 2002 as part of this change and has been delivered successfully for three consecutive years. About 250 students enrol in this course annually, with over 100 students studying externally. One of the major challenges faced by examiners in such team-based problem-solving courses is how to assess individual student performance for grading 4. While some argue that teamwork should be evaluated by outcomes and that individual students should receive equal shares, there are others who believe that individual students must be rewarded based on their contribution to the teamwork. There are different evaluation techniques proposed in the literature to assess individual performance in a team-based project. Rating individual performance within and by the team members is the method evaluated in this paper. This team rating was verified by peer evaluation carried out individually by the team members. This paper evaluates the performance of teams and individual students in three different projects in the 2004 delivery of this course. There was evidence that the majority of the 40 teams (260 students) appreciated and made use of the opportunity to participate the allocation of assessment marks. Similar performance patterns were observed in all the three projects. The implementation of this rating system significantly reduced the individual complaints from the students on the assessments for this course. It is concluded that this rating method, with minor refinement is effective in evaluating individual student performance in team-based learning courses.
Introduction
Engineering Problem Solving 2 (ENG2102) is the second of the four Problem-based Learning
(PBL) courses offered by the Faculty of Engineering and Surveying (FOES) at the University of Southern Queensland (USQ). This is a core course for all FOES programs. It was first offered in S2, 2002 as part of a radical change in the curriculum to incorporate graduate attributes in conjunction with technical content. The key graduate attributes considered were
teamwork, critical thinking, communication skills, independent learning and problem-solving
skills. The main focus in the technical content includes statistics, physics and GIS and
mapping. This course is offered in both on-campus and external modes of study with over
There are two schools of thought in evaluating individual performance in teamwork. One school holds that the team should be assessed as a whole and that each member receives an equal share. The other school adheres to the view that individual contribution within the team should be taken into consideration and rewarded accordingly. The literature is equally divided in this evaluation according to Ettaro5. Arango and Petrulis both endorse group grades in collaborative learning in teams, while Kagan strenuously opposes the use of group grades, claiming that they are blatantly unfair, undermine motivation, violate individual accountability and convey the wrong message6-8. Related sentiments have been expressed by Divaharan and Atputhasamy who noted that “One of the weaknesses in the use of cooperative learning and using the groups’ products as part of course assessment is the awarding of equal grades to all members of the group”9. Kaufman et al., investigated the use of confidential peer rating in sophomore-level chemical engineering courses to arrive at individual performance results for team members10-11. Following Brown12, they converted the ratings to individual weighting factors that were used to compute individual project grades from the product of the team project grade and the weighting factor. They found that “the autorating system works exceptionally well as a rule.” Furthermore, they state that “Most cooperative learning experts agree that the approach works best if team grades are adjusted for individual performance.”
There are different evaluation techniques used to evaluate the individual contribution. One process is to grade the individual contribution (eg: A+, B, C, or D-). Another method is to score the individual contribution out of 100%, which was adopted in our course. It is interesting to note that in some cases, a score of more than 100% is recommended 5.
In our latest delivery of the course (in semester 2, 2004), the teaching team gave overall marks to each team report but allowed the teams themselves to take some control over how the team mark was distributed between individual team members. In this paper we use data generated by the assessment process last year in three team-based problems to evaluate :
§ Whether student teams were willing and capable of taking on the challenge of redistributing marks between individuals; and
§ Whether this redistribution of marks had any noticeable impact on overall results.
Methodology Used in ENG2102
Three problems were set by the teaching team and each team had about 4 weeks to address each problem. Teams’ answers were submitted as a single report. The reports were the integrated work of the team overall and no individual contributions could be identified from the report. The teaching team marked each report according to its validity, completeness and clarity. The first report was worth 20% of the total assessment, the second and third were worth 30% each. The remaining 20% was allocated to a fourth individual report (portfolio of reflections), which is beyond the scope of this paper.
Teams were asked to give a score, out of 100, describing the relative contribution of each team member. That is, if all team members worked equally hard on the project, each should be allocated a relative contribution score of 100%. If however, one team member only contributed half as much as fellow members, that team member should be given a relative contribution score of 50%, while all others in the team received 100%.
We used a number of strategies to try to ensure equity in the system. Firstly, the allocation of relative contribution scores had to be negotiated within the team and agreed to by all members. An appeals process was available to students who felt the team had not reached consensus and/or that the contribution scores submitted were not a fair reflection of team agreements.
Secondly, we insisted that the relative contribution scores had to be negotiated and agreed before the report was submitted and submitted at the same time as the actual report. This ensured all negotiations were concluded before the team knew their team mark. (We wish to ensure that these negotiations focussed on relative contributions, not relative marks.)
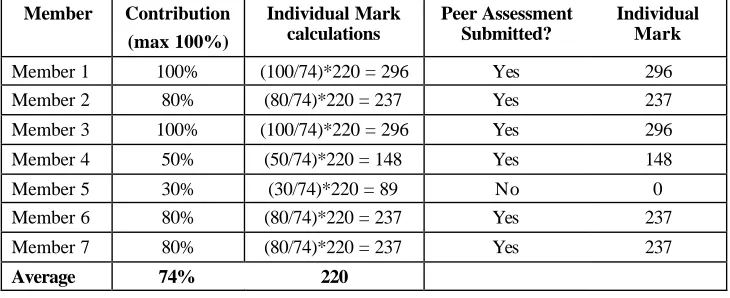
Thirdly, we had two mechanisms for checking that the relative contribution scores were valid. Each individual student was required to submit a confidential self and peer assessment giving relative contribution scores for their team. Students who failed to submit this form had their marks withheld. That way, each individual student’s opinions could be cross-checked across the team relative contribution scores. Also, the team facilitator was required to check and certify the validity of the relative contribution scores. An example of calculating the individual mark for a team report worth 300 marks is shown below in Table 1.
Member Contribution (max 100%)
Individual Mark calculations
Peer Assessment Submitted?
Individual Mark
Member 1 100% (100/74)*220 = 296 Yes 296
Member 2 80% (80/74)*220 = 237 Yes 237
Member 3 100% (100/74)*220 = 296 Yes 296
Member 4 50% (50/74)*220 = 148 Yes 148
Member 5 30% (30/74)*220 = 89 No 0
Member 6 80% (80/74)*220 = 237 Yes 237
Member 7 80% (80/74)*220 = 237 Yes 237
[image:3.612.124.489.497.646.2]Average 74% 220
Teams Willingness to Distribute Marks to Individuals
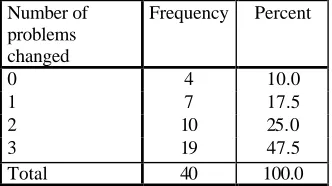
How did the teams take up this challenge? This section discusses whether the student teams were willing and capable of taking on the challenge of redistributing marks between individuals. Table 2 summarises how often teams opted to vary the allocation of marks between team members in the three problems.
Number of problems changed
Frequency Percent
0 4 10.0
1 7 17.5
2 10 25.0
3 19 47.5
[image:4.612.224.390.182.275.2]Total 40 100.0
Table 2. Number of teams opting to reallocate marks
From the above table it can be seen that as many as thirty-six out of forty teams (90%) decided to change the contribution in one or more problems. Only four teams (10%) accepted team marks (i.e., gave equal contribution scores for each team member) for all the three problems. Nineteen (47.5%) of teams reallocated marks on all three problems. There was no significant difference between problems. Problem 1 marks were reallocated by 28 teams, Problem 2 marks were reallocated by 29 teams and Problem 3 marks were reallocated by 27 teams. In average, 70% of the teams reallocated the marks in each of the three problems. Only one appeal was received: two students appealing that the team’s allocation of marks was not a fair representation of their opinions. (In this particular instance, it transpired that the team had never successfully formed and was acting somewhat as two teams – one of 4 and the other of 2).
In previous years, students had an opportunity to adjust the marks after they had obtained the team mark for their report. It was observed that most teams decided not to adjust the mark to avoid having confrontations with their fellow team members. We believe this is a significant improvement to the assessment process compared to the previous years of delivery. Student feedback suggested that students appreciated the opportunity to have their own feedback on the performance of members of their team included in the assessment process.
“I believe that this course is more effective than problem solving one as the team contribution sheets, and criteria that you are scored on for each project seem to allow each member to be scored with more accuracy for the level of commitment that they have showed to the team.”
“This course has a good marking system where the students have to grade each others performance. This works well except for those who are sensitive and give everyone 100%. The team in general did well and I should be achieving a high grade for the course.”
0 10 20 30 40 50 60 70 80 90 100 Problem 1 mark (%)
0 2 4 6 8 10 12
Number of teams
Comparison and Impact of Team and Individual Performance
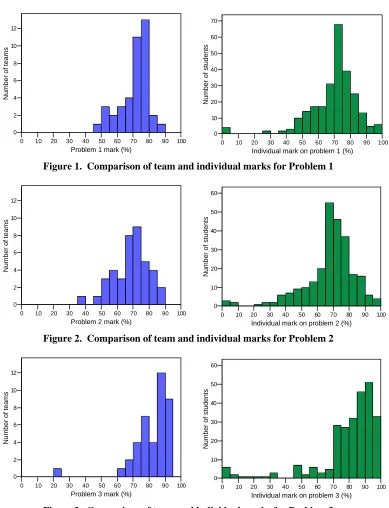
Based on the method described in the previous section, the team mark was distributed according to the weighted contribution of each member to arrive at an individual mark. The following figures compare the team marks and individual marks for the three problems.
0 10 20 30 40 50 60 70 80 90 100
Individual mark on problem 1 (%) 0
10 20 30 40 50 60 70
[image:5.612.117.506.159.667.2]Number of students
Figure 1. Comparison of team and individual marks for Problem 1
0 10 20 30 40 50 60 70 80 90 100
Individual mark on problem 2 (%) 0
10 20 30 40 50 60
Number of students
Figure 2. Comparison of team and individual marks for Problem 2
0 10 20 30 40 50 60 70 80 90 100
Individual mark on problem 3 (%) 0
10 20 30 40 50 60
[image:5.612.120.505.172.316.2]Number of students
Figure 3. Comparison of team an d individual marks for Problem 3
0 10 20 30 40 50 60 70 80 90 100
Problem 2 mark (%) 0
2 4 6 8 10 12
Number of teams
0 10 20 30 40 50 60 70 80 90 100
Problem 3 mark (%) 0
2 4 6 8 10 12
In each of these figures we can see that individual marks are more spread than team marks. We view this as desirable. It is expected that team marks underestimate true spread of abilities within the class because the team effort represents the amalgam of stronger and weaker students. Figures 1 and 2 show that team performance is skewed while the individual marks display a nearer to normal distribution. It should be noted that due to a higher average team mark received for Problem 3, some individual marks were capped at 100%, which resulted in a slightly different distribution in Problem 3 compared to the other two.
The following three graphs in Figure 4 show the percentage contribution rating for each student across the 3 projects. The number of students contributing 95% -100% for a problem rose from about 128 (50.6%) towards 149 (59.6%) over the three problems. This perhaps indicates the impact of peer pressure as they progress through the three problems, and expressed through the peer review process, encouraging all team members to contribute fully.
Figure 4 also indicates that more than 50% of the students are considered by their team as contributing fully (95%-100%) when working in a team environment. Apart from a few exceptions, the contributions by the others vary in the range above 50%. The above distribution provides us with some guideline on the level of minimum contribution by a student to be considered to be making a genuine effort in a team-based problem.
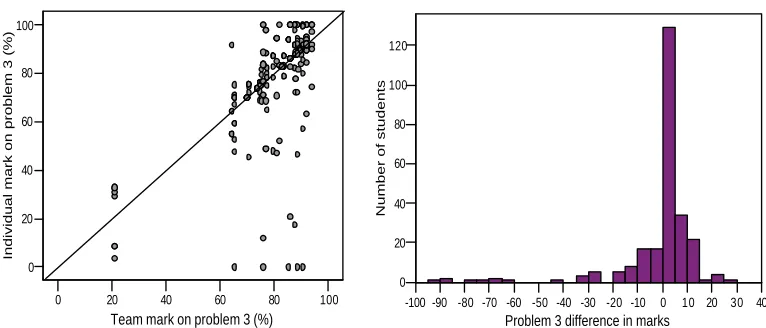
The following three graphs in Figures 5, 6 and 7 show the relationship between the team marks and individual marks on each of the three problems. It should be noted that with no peer adjustment, these results would follow a 45 degree straight line. The level of scatter around this line indicates the effect of the peer review process on the individual marks.
The associated correlation statistics for the relationship between individual marks and team marks are:
o 0.59 for Problem 1 o 0.68 for Problem 2 o 0.62 for Problem 3
A correlation of 1.00 would imply that the peer review had no effect on individual marks. On the other hand, a correlation of 0.00 would imply that that team mark had no effect on individual marks. The results above show that peer review and team marks are impacting on final individual marks. An overall correlation of 0.66 across all the three problems indicates that both the peer review and the team mark are affecting the individual mark of a student.
0 10 20 3 0 40 5 0 60 70 80 90 100
Contribution on problem 1 0
20 4 0 60 80 100 120 140 160
Number of students
0 10 20 3 0 40 5 0 60 70 80 90 100
Contribution on problem 2 0
20 4 0 60 80 100 120 140 160
Number of students
0 10 20 3 0 40 5 0 60 70 80 90 100
Contribution on problem 3 0
20 4 0 60 80 100 120 140 160
[image:6.612.117.495.265.387.2]Number of students
-100 -90 -80 -70 -60 -50 -40 -30 -20 -10 0 10 20 30 40
Problem 1 difference in marks
0 20 40 60 80 100 120
[image:7.612.118.505.98.261.2]Number of students
Figure 5. Correlation of team and individual marks for Problem 1
-100 -90 -80 -70 -60 -50 -40 -30 -20 -10 0 10 20 30 40
Problem 2 difference in marks
0 20 40 60 80 100 120
[image:7.612.116.501.294.458.2]Number of students
Figure 6. Correlation of team and individual marks for Problem 2
-100 -90 -80 -70 -60 -50 -40 -30 -20 -10 0 10 20 30 40
Problem 3 difference in marks
0 20 40 60 80 100 120
Number of students
Figure 7. Correlation of team and individual marks for Problem 3
0 20 40 60 80 100
Team mark on problem 1 (%)
0 20 40 60 80 100
Individual mark on problem 1 (%)
0 20 40 60 80 100
Team mark on problem 2 (%)
0 20 40 60 80 100
Individual mark on problem 2 (%)
0 20 40 60 80 100
Team mark on problem 3 (%)
0 20 40 60 80 100
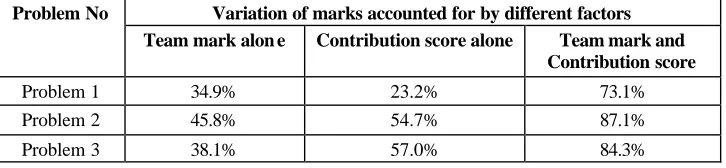
[image:7.612.117.500.489.653.2]Variation of marks accounted for by different factors Problem No
Team mark alon e Contribution score alone Team mark and Contribution score
Problem 1 34.9% 23.2% 73.1%
Problem 2 45.8% 54.7% 87.1%
[image:8.612.127.490.102.186.2]Problem 3 38.1% 57.0% 84.3%
Table 3. Comparison of the variation of marks accounted for by different factors
A linear regression analyses was carried out to study the effect of team mark and contribution score on the variation of individual marks. The results are summarised in Table3. When results of all three problems are considered about 44% of the variation could be accounted for by team marks alone compared to 40% from contribution score alone. The effect of contribution score on the variation is only 23% in Problem 1, but increases to 57% in Problem 3. The apparent increase in the effect of the contribution indicates that the team may be becoming more critical of members whose relative contribution is lower. This is also evident from Figures 5-7, where the scatter is becoming wider on the lower side of the 1:1 line from Problem 1 to Problem 3. About 80% of the variation could be accounted for by the combined effect of team mark and the contribution score.
The above results provide us with evidence that, yes students can and do want to have some input into the final distribution of team marks between individuals, and yes, this process can have a significant impact on both student grades and student satisfaction.
Feedback from students as given below strengthens the contention that the assessment process is working very well and is impacting on the individual grades.
“How our grades were compared to others in the course. I found this a source of motivation as did other team members.”
“I would have to say that the biggest improvement over [problem solving 1] was that our marks are now individualised. Also the electronic submission setup adopted by you guys is brilliant.”
“The best part of this course is that it has been marked fairly, which I don’t think was necessarily the case for Problem Solving 1. As I have, in general, done a fair bit more work than most of my team mates, I have also been accorded a better mark. Unfortunately, most of my team mates will have to learn the hard way, that you only get out what you are prepared to put in, and riding on someone else’s coat tails may work at school, but university is another matter.”
Further Developments
While there is clear evidence that the assessment process of individual contribution is working very well in nearly all cases, one team did experience considerable problems:
We consider that our mechanisms have inbuilt safeguards to protect our students from similar repeats of this unfortunate incident. Some of the mechanisms we have include:
§ Cross-check with the confidential self-peer assessment,
§ Facilitator’s input based on monitoring the team progress and other documented evidence such as weekly progress report by the team.
As discussed in the previous section, it is evident from the level of contribution (Figure 4) that most team members are contributing in the range of 50-100%. This gives us a strong justification to expect a contribution of at least 50% by each student to be considered as making genuine contribution to the team report. While this gives a motivation to each student to satisfy the individual assessment requirements for this course, it also prevents possible isolation of one or two students who are being unfairly marked down by the other team members. We plan to implement this minimum contribution of 50% in the current delivery of the course in semester 2, 2005.
While this process works well in most cases, we have found in some instances where the team mark is greater than the average contribution by the team. In such cases, the members contributing 100% will be receiving a mark greater than 100%, which will need to be capped at 100%. This is a mathematical anomaly in the algorithm that is sometime encountered in a team with many high-achievers.
The process of assessing the individual marks had obtained wider acceptance within the students teams and other engineering problem solving courses within the Faculty. This method is currently being adopted by the foundation and pre -requisite course Engineering
Problem Solving 1 (ENG1101). We believe once the students are familiar with the
assessment scheme in ENG1101, the teams will be in a position to give us a better judgement of their peers when they are enrolled in ENG2102.
Concluding Remarks
The introduction of the Engineering Problem Solving courses has brought radical changes to the curriculum within the Faculty of Engineering Surveying at USQ. The second level course ENG2102 has been delivered successfully for three years, for both on-campus and external modes of studies and leads the authors to claim that:
§ The majority of the teams are willing to distribute the team marks to reflect the individual efforts of the members.
§ Incorporation of peer review has a significant impact on the distribution of team marks vs adjusted individual performance, where the individual performance has a wider distribution, much like one would expect in a large class.
§ There is strong evidence of acceptance and satisfaction of their final mark based on the process of distribution used in this course.
References
1. Dowling, D. G., (2001). Shifting the Paradigm for a New Era in Engineering and Surveying Education, New Engineering Competencies - Changing the Paradigm, SEFI Annual Conference, SEFI Annual Conference
(p114), Copenhagen, Denmark.
2. Brodie, L.M. & Porter, M.A. (2001). Delivering Problem Based Learning courses to engineers in on-campus and distance education modes. Proceedings of 3rd Asia Pacific Conference on Problem Based Learning, Yeppoon, 9 -12 Dec.
3. Porter, M.A. & Brodie, L.M. (2001). Challenging tradition: Incorporating PBL in Engineering courses at USQ. Proceedings of 3rd Asia Pacific Conference on Problem Based Learning, Yeppoon, 9-12 Dec. 4. Aravinthan, T, & Fahey, P. (2004). Evaluation of students performance in Engineering Problem Solving
Course from a dual mode delivery, Austr alasian Association of Engineering Educators Conference, University of Southern Queensland, Toowoomba Australia. September 2004.
5. Ettaro, J.E (2000). Assessing Individual Student Performance in Teams. Journal of Industrial Technology, 16(3).
6. Arango, Roger (n.d.) Group Projects and Group Grading: Work in Progress. Available at :
http://www.evergreen.edu/washcenter/resources/acl/b5.html (Accessed June 6, 2005). 7. Petrulis, Bob. (n.d. ) G rading in Collaborative Classrooms. Available at:
http://www.evergreen.edu/washcenter/resources/acl/b1.html (Accessed June 6. 2005).
8. Kagan, S, (1995) Group Grades Miss the Mark, Special Topic in Educational Leadership, May 1995 68 -71. 9. Divaharan, S & Atputhasamy, L. (2002). An attempt to enhance the quality of cooperative learning through
peer assessment. Journal of Educational Enquiry, Vol 3, No 2, 72-82.
10. Kaufman, Deborah B., Felder, Richard M., and Fuller, Hugh. (1999) Peer Ratings in Cooperative Learning Teams. Proceedings of the 1999 Annual ASEE Meeting, ASEE, June 1999. Session 1430.
11. Kaufman, Deborah B., Felder, Richard M., and Fuller, Hugh (2000) Accounting for Individual Effort in Cooperative Learning Teams. J Engr. Education, 89 (2), 133-140.
12. Brown, R. W. (1995). Autorating: Getting individual marks from team marks and enhancing teamwork. 1995 Frontiers in Education Conference Proceedings. Pittsburgh, IEEE/ASEE, November 1995.
Biographical Data
THIRU ARAVINTHAN is a Senior Lecturer in Structural Engineering at the University of Southern Queensland. He holds a MEng and PhD from Saitama University, Japan and is a registered Professional Engineer at the state of Oregon. His research interests include external post-tensioning for structural rehabilitation, innovative bridge design and engineering education.
PAUL FAHEY is a Lecturer in Statistics within the Faculty of Sciences, USQ. He has a degree in statistics from the Australian National University and a Master in Medical Statistics from the University of Newcastle. Prior to commencing his current duties, Paul has worked in a variety of health service research positions at the University of Newcastle and Westmead Hospit al, Sydney.