White Rose Research Online URL for this paper:
http://eprints.whiterose.ac.uk/151262/
Version: Published Version
Article:
Guertin, MJ, Cullen, AE, Markowetz, F et al. (1 more author) (2018) Parallel factor ChIP
provides essential internal control for quantitative differential ChIP-seq. Nucleic Acids
Research. e75. ISSN 0305-1048
https://doi.org/10.1093/nar/gky252
[email protected] https://eprints.whiterose.ac.uk/ Reuse
This article is distributed under the terms of the Creative Commons Attribution (CC BY) licence. This licence allows you to distribute, remix, tweak, and build upon the work, even commercially, as long as you credit the authors for the original work. More information and the full terms of the licence here:
https://creativecommons.org/licenses/
Takedown
If you consider content in White Rose Research Online to be in breach of UK law, please notify us by
Parallel factor ChIP provides essential internal control
for quantitative differential ChIP-seq
Michael J. Guertin
1, Amy E. Cullen
2, Florian Markowetz
2and Andrew N. Holding
2,*1Department of Biochemistry and Molecular Genetics, School of Medicine, University of Virginia, Charlottesville, VA
22908, USA and2Cancer Research UK Cambridge Institute, University of Cambridge, Cambridge, Cambridgeshire
CB2 0RE, UK
Received September 11, 2017; Revised March 15, 2018; Editorial Decision March 21, 2018; Accepted March 28, 2018
ABSTRACT
A key challenge in quantitative ChIP combined with high-throughput sequencing (ChIP-seq) is the nor-malization of data in the presence of genome-wide changes in occupancy. Analysis-based normaliza-tion methods were developed for transcriptomic data and these are dependent on the underlying assump-tion that total transcripassump-tion does not change between conditions. For genome-wide changes in transcrip-tion factor (TF) binding, these assumptranscrip-tions do not hold true. The challenges in normalization are con-founded by experimental variability during sample preparation, processing and recovery. We present a novel normalization strategy utilizing an internal standard of unchanged peaks for reference. Our method can be readily applied to monitor genome-wide changes by ChIP-seq that are otherwise lost or misrepresented through analytical normalization. We compare our approach to normalization by to-tal read depth and two alternative methods that utilize external experimental controls to study TF binding. We successfully resolve the key challenges in quantitative ChIP-seq analysis and demonstrate its application by monitoring the loss of Estrogen Receptor-alpha (ER) binding upon fulvestrant treat-ment, ER binding in response to estrodiol, ER me-diated change in H4K12 acetylation and profiling ER binding in patient-derived xenographs. This is sup-ported by an adaptable pipeline to normalize and quantify differential TF binding genome-wide and generate metrics for differential binding at individual sites.
INTRODUCTION
ChIP combined with high-throughput sequencing
(ChIP-seq) quantiies the relative binding intensity of protein/DNA interactions genome-wide for a single
con-dition (1–3). However, comparing relative intensities of binding between samples and between conditions is an ongoing challenge (4–8). Conventionally, correcting for sample-to-sample variability between conditions occurs at the analysis stage (9–12), but these methods assume that experimental variables remain constant between datasets and assume comparable genomic binding of the protein between conditions. In practice, different eficiencies in nu-clear extraction, DNA shearing and immunoprecipitation present potential points within a typical ChIP-seq protocol (13) to introduce experimental variation and error (14). Analytical normalization methods exist to control for vari-ability between samples of the same condition (14,15), but these methods cannot account for experimental variation between conditions (7). In order to approximate normaliza-tion between condinormaliza-tions the ield has exploited a deiciency in ChIP-seq. In short, the total read depth is used as a normalization factor because the vast majority of ChIP-seq reads are outside of true transcription factor (TF) binding sites (8,9). Nonetheless, this approach does not control for any of the aforementioned causes of experimental variabil-ity and differences in DNA recovery can be interpreted as differential binding. Previous studies have aimed to resolve these challenges when analyzing genome-wide changes through the use of external spike-in controls (4,5). These methods rely on xenogeneic chromatin (i.e. from a second organism) and either a second species-speciic antibody (5), or the cross-reactivity of a single antibody to the factor of interest (4) in both organisms.
Here we present a method, termed parallel-factor ChIP, that utilizes a second antibody to provide an internal con-trol. The process of utilizing a second antibody against the target chromatin avoids the need of a xenogeneic spike-in and controls for more experimental variables than previ-ous methods. In contrast to spike-in methods, this approach controls for cell lysis conditions, immunoprecipitation ef-iciency and sonication fragment size. Moreover, parallel-factor ChIP is not dependent upon accurate quantiication of spike-in chromatin. We present this method alongside the application of two xenogeneic methods for the analysis of the fold-change in TF binding between two conditions.
Fur-*To whom correspondence should be addressed. Tel: +44 1223 769 500; Fax: +44 1223 769 510; Email: [email protected]
C
The Author(s) 2018. Published by Oxford University Press on behalf of Nucleic Acids Research.
This is an Open Access article distributed under the terms of the Creative Commons Attribution License (http://creativecommons.org/licenses/by/4.0/), which permits unrestricted reuse, distribution, and reproduction in any medium, provided the original work is properly cited.
D
o
w
n
lo
a
d
e
d
fro
m
h
ttp
s:
//a
ca
d
e
mi
c.
o
u
p
.co
m/
n
a
r/
a
rt
icl
e
-a
b
st
ra
ct
/4
6
/1
2
/e
7
5
/4
9
7
2
8
7
4
b
y
U
n
ive
rsi
ty
o
f Y
o
rk
u
se
r
o
n
2
4
S
e
p
te
mb
e
r
2
0
1
ther, we have developed an adaptable pipeline to apply these strategies and provide a highly reliable quantitative analysis of differential binding sites utilizing established statistical software packages.
Estrogen Receptor-alpha as a model transcription factor
Nuclear hormone receptors are a super-family of ligand-activated TF. Many of the molecular mechanisms under-lying well-characterized robust and rapidly inducible tran-scriptional responses, such as estrogen signaling, are shared among other systems. Therefore, we use the transcriptional response to estrogen treatment as a model system to study TF binding. Moreover, many of the aforementioned nor-malization challenges are exacerbated in the case of ligand inducible TFs (7). For our development and comparison of methods, we monitored ER binding upon treatment with fulvestrant (16). Accurate analysis of the ER binding is of key interest as 70% of all breast cancer tumors are classi-ied as ER+ (17). Fulvestrant is a targeted therapeutic to prevent the growth of ER+ tumors (18,19). The mode of action for fulvestrant is to bind to the ER as an antagonist, which results in recruitment of a different set of cofactors compared to the native ligand estra-2-diol. The fulvestrant-speciic cofactors promote degradation of the ER (20,21) via the ubiquitination pathway and the proteasome (22). The family of compounds to which fulvestrant belongs is called Selective Estrogen Receptor Degraders or Downreg-ulators (SERDs). Cellular loss of ER protein results in com-promised ER binding genome-wide and is thus an ideal model for the development of novel quantitative ChIP-seq normalization methods.
MATERIALS AND METHODS
Experimental design
For experiments containing xenogeneic spike-in material, we generated four replicates for both the control and
fulves-trant treatment, a total of eight samples for theDrosophila
spike-in and eight ChIP-seq samples for the murine chro-matin spike-in. For the CTCF parallel-factor ChIP exper-iments, three replicates were prepared for the parallel ER-CTCF pull-down for both control and treatment, giving a total of six samples. A single replicate of the CTCF-only pull-down was prepared for both control and treatment conditions.
Cell culture
All experimental conditions were conducted in the MCF-7 (Human, ATCC) cell line. Spike-in standards were
gen-erated using HC11 (Mouse, ATCC) and S2 (Drosophila,
ATCC) cells. MCF-7 were authenticated using STR DNA proiling.
For each individual ChIP pull-down, 4×10⁷MCF-7 cells
were cultured asynchronously, as previously described (23), across two 15 cm diameter plates in DMEM (Dulbecco’s Modiied Eagle’s Medium, Glibco) with 10% Fetal Bovine Serum (FBS), Glutamine and Penicillin/Streptomycin
(Glibco). Incubators were set to 37◦C and to provide a
hu-midiied atmosphere with 5% CO2.
The cells were treated with either fulvestrant or estradiol (E2) (inal concentration 100 nM, Sigma-Aldrich). Prior to E2 treatment, cells were washed with phosphate-buffered saline (PBS) and grown for 4 days in phenol red-free me-dia supplemented with charcoal-stripped FBS. Meme-dia was changed daily. The cells were then incubated for the appro-priate time period: 48 h fulvestrant, 2 h for the effect of E2 on H4K12ac or 45 min for ER activation. The cells were washed with ice cold PBS twice and then ixed by incubat-ing with 15 ml per plate of 1% formaldehyde in unsupple-mented clear media for 10 min. The reaction was stopped by the addition of 1.5 ml of 2.5 M glycine and the plates were washed twice with ice cold PBS. Cells were released from each plate using a cell lifter and 1 ml of PBS with protease inhibitors (PI) into a 1.5 ml microcentrifuge tube. The cells
were centrifuged at 8000 rpm for 3 min at 4◦C and the
su-pernatant removed. The process was repeated for a second wash in 1 ml PBS+PI and the PBS removed before storing
at−80◦C.
S2 cells were grown in T175 lask with Schneider’s
DrosophilaMedium + 10% FBS at 27◦C. Cells were released
by agitation and transferred to a 50 ml Falcon tube. The cells were then pelleted at 1300 rpm for 3 min. The media was removed and the cells resuspended in 7.5 ml PBS. In a fume hood, cells were cross-linked by the addition of 7.5 ml 2% formaldehyde in unsupplemented clear media. The reac-tion was stopped with 3 ml of 1M glycine at 10 min. The
sus-pension of cells was then centrifuged at 2000×gfor 5 min.
The cells were then washed twice with 1.5 ml PBS+PI before
the PBS+PI was removed and the cells stored at−80◦C.
Untreated HC11 were prepared following the same pro-cedure as MCF-7.
Chromatin immunoprecipitation (ChIP)
ChIP was performed as previously reported for cell lines (13) and tissue (23) with the modiications listed below.
For theDrosophila melanogasterchromatin spike-in
ex-periment (sequencing data: SLX-8047), D. melanogaster
andHomo sapienssamples were prepared separately follow-ing the reported protocol until completion of the sonica-tion step. Next, the MCF-7 (experimental) chromatin was combined with the S2 derived chromatin (control) in a ra-tio of 10:1. Magnetic protein A beads were prepared
identi-cally for both the target antibody (100g, ER, SC-543, lot
K0113, Santa Cruz) and the control antibody (10l, H2Av,
39715, lot 1341001). The washed beads were then combined
in a ratio of 1:4 for pull-down. For theMus musculus
chro-matin spike-in experiment (sequencing data: SLX-12998),
M. musculusandH. sapienscells were prepared separately following the aforementioned protocol until after sonica-tion. Next, we combined the chromatin from the
experimen-tal samples (4×10⁷ MCF-7 cells) with that from a single
plate of HC11 cells (2×10⁶ cells). The protocol was
con-tinued unmodiied using only the ER antibody and protein A beads.
For experiments containing the CTCF antibody con-trol (sequencing data: SLX-14229, SLX-14438, SLX-15090,
SLX-15091 & SLX-15439), 100 l magnetic protein G
beads were prepared separately for both antibodies, CTCF
(10l, 3418 XP, Cell Signaling) and ER (100g, SC-543,
D
o
w
n
lo
a
d
e
d
fro
m
h
ttp
s:
//a
ca
d
e
mi
c.
o
u
p
.co
m/
n
a
r/
a
rt
icl
e
-a
b
st
ra
ct
/4
6
/1
2
/e
7
5
/4
9
7
2
8
7
4
b
y
U
n
ive
rsi
ty
o
f Y
o
rk
u
se
r
o
n
2
4
S
e
p
te
mb
e
r
2
0
1
lots F1716 , F0316 and H1216, Santa Cruz) or H4K12ac
(100g, 07-595, Lot: 2884543 Millipore). The beads were
then combined 1:1 giving 200l of beads. The only
excep-tions were the two CTCF controls (one with and one with-out treatment) where no ER beads were added. These sam-ples were used to generate a CTCF consensus peak set.
Library prep
ChIP and input DNA were processed using the Thruplex Library DNA-seq Kit (Rubicon) according to the manufac-turer’s protocol.
Sequencing
Sequencing was carried out by the CRUK Cambridge In-stitute Genomics Core Facility using a HiSeq 4000, 50 bp single end reads.
Alignment
Previously, Eganet al.(5) aligned the reads to the genomes
of the two species separately for the generation of correction factors. We developed our protocol around the alignment to a single combined reference genome, either Drosophila-Human (DmHs) or Mouse-Drosophila-Human (MmHs). The reference genomes were generated from Hg19 and Mm9 or Dm3. We used BowTie2 (version 2.3.2) to align the FASTQ format reads. This resolves and simpliies the challenge of ambigu-ous alignments between the two genomes. Reads were re-moved from blacklisted regions (http://mitra.stanford.edu/ kundaje/akundaje/release/blacklists/).
Peak calling
We used MACS2 (version 2.1.1, default parameters) to call peaks against the combined genome. An example with input data is provided within the Brundle Example repository in Git Hub.
Motif analysis was performed using Homer (v4.9) to pro-vide conidence in peak sets; ER and CTCF control showed
a strong enrichment of the full CTCF motif (P-value ∼
0). Pairwise IDR (irreproducible discovery rate) analysis of all samples conirmed reproducibility and is summarized in Supplementary Figures S3, 14C and 16C. QC reports are summarized in Supplementary Table S3.
qPCR validation of peaks
Loss or gain of ER binding at known ER binding sites
near RARA␣, NRIP1 and XBP1 were conirmed by
ChIP-qPCR (Supplementary Figure S4) and changes in H4K12ac was monitored at GREB1, CXCL12 and XBP1. Primers were as previously reported (24–27). Fold enrichment was calculated against a control region of the genome, proxi-mal to TFF1, known to not bind by ER and to be free of H4K12ac marks from our own ChIP-seq data. The en-richment values were normalized to an input control. The primer sequences for the ER unbound control genomic re-gion were as previously reported (25).
Bioinformatic analysis
The bioinformatic analysis was implemented using R (ver-sion 3.3.2) with a modiied ver(ver-sion of DiffBind (ver(ver-sion 2.5.6, available from the AndrewHolding/BrundleDevelop ment repository on GitHub) and DESeq2 (version 1.14.1). These modiications have been included for the next release of DiffBind from Bioconductor.
Gene set enrichment analysis
Gene set enrichment analysis of the ER peaks that
re-sponded to fulvestrant treatment (FDR=0.01) as
estab-lished by the parallel-factor ER-CTCF ChIP were submit-ted to GREAT (28) for analysis. These gave an enriched es-trogenic signal (Supplementary Tables S1 and 2).
UCSC Genome browser sessions for the data analy-sis can be found in the ReadMe.md ile uploaded to the AndrewHolding/Brundle R-Package repository on GitHub.
Pipeline and R packages
An R package containing the functions used for the analysis can be installed directly from CRAN or via
AndrewHolding/Brundle on GitHub using the
in-stall github found in the Devtools package.
An R package containing two sets (one internal and one spike-in control) of test data provided as aligned reads, peak iles and samples sheets can be installed from AndrewHolding/BrundleData on GitHub.
The complete set of scripts for the preprocessing pipeline is provided to support the implementation of fu-ture analysis with Brundle in the preprocessing folder of AndrewHolding/Brundle Example GitHub. All the con-tents of the Brundle Example repository are also pack-aged in a Docker container for easy use. Instructions on downloading and running the container are available in the ReadMe.md ile.
RESULTS
Analytical normalization methods highlight the need for ex-perimental quantitative ChIP-seq controls
Three data-based normalization strategies are commonly used to normalize ChIP-seq binding between conditions: reads per million (RPM) reads in peaks, RPM total reads and RPM aligned reads. We applied these methods to each of our ER ChIP-seq datasets to highlight their deiciencies. Despite the presence of spike-in chromatin, these analyses
only considered reads that align to theH. sapiensgenome.
CTCF binding sites were excluded from the analysis of parallel-factor ChIP-seq data. We present the analysis of the xenogeneic spike-in and human/mouse cross-reacting ER antibody below, but analysis of all datasets gave consis-tent results and exhibited a strong decrease in ER binding upon fulvestrant treatment.
We irst plotted the average ER peak intensity, as de-termined by raw counts and three counts-based normal-ization methods, by the change in ER intensity upon ful-vestrant treatment (Supplementary Figure S1). In properly
D
o
w
n
lo
a
d
e
d
fro
m
h
ttp
s:
//a
ca
d
e
mi
c.
o
u
p
.co
m/
n
a
r/
a
rt
icl
e
-a
b
st
ra
ct
/4
6
/1
2
/e
7
5
/4
9
7
2
8
7
4
b
y
U
n
ive
rsi
ty
o
f Y
o
rk
u
se
r
o
n
2
4
S
e
p
te
mb
e
r
2
0
1
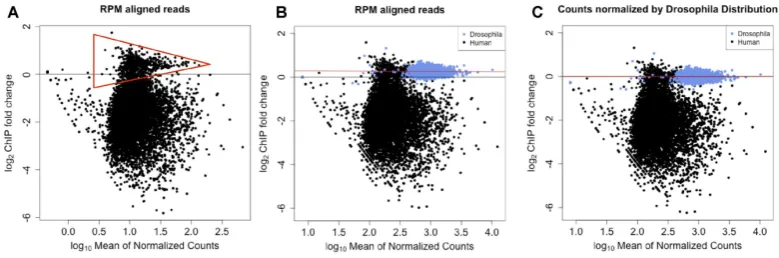
Figure 1.MA plots showing ER binding before and after treatment with fulvestrant including matched Dm H2Av spike-in control. (A) Reads corrected to total aligned reads showed the same off-center peak density as observed in the igure. Putative unchanged ER binding sites are within the red triangle.
(B) Overlaying the MA plot combining the changes in chromatin binding of Hs ER (black) and Dm H2Av (blue). Dm peaks overlay the off-center peak
density. (C) Utilizing the Dm H2Av binding events as a ground truth for 0-fold-change, a linear it to the log-fold-change is generated and the it is applied
to adjust the Hs ER binding events.
normalized MA plots, the unchanged peaks between con-ditions are distributed with a log-fold difference centered on zero with increasing variance as the peak intensity de-creases. However, the distribution of data points in the raw counts MA plot shows that this distribution is shifted up to
a y-value of∼1 (Supplementary Figure S1A). We
hypothe-sized that these are true ER binding sites that do not change upon fulvestrant treatment or false-positive peaks. In both cases, the apparent increase in binding would therefore be an artefact of the data processing. As expected, the appar-ent fold-change for the increase in ER binding was most pronounced when the data was normalized with respect to total number of reads in peaks (Supplementary Figure S1B) because this method is reliant on the majority of binding events between the two experimental conditions remaining constant. Other common normalization methods that have been applied to ChIP-seq data, such as quantile normaliza-tion (29,30), would result in a similar systematic error in the inal data. More appropriate methods that correct for total library size, such as RPM total reads, showed little improve-ment for our datasets over the raw number of reads counts in peaks (Supplementary Figure S1C). Each normalization strategy erroneously implies an increase in ER binding to the chromatin at a large number of sites after 48 h of treat-ment.
Comparison of existing methods
To conirm that the normalization effects we observed were typical of the commonly used tools for ChIP-seq analysis, we compared results from ChIPComp (31), DiffBind (23), DeSEQ2 (32) and EdgeR (33). In a recent comparative anal-ysis, ChIPComp and DiffBind were the only two methods recommended for analysis of narrow peak protein/DNA binding data (12). We therefore compared the results from these two pipelines with EdgeR and DeSeq2, which are rou-tinely applied to ChIP-seq data. The data showed (Supple-mentary Figure S2) that ChIPComp, EdgeR and DeSEQ2 detect a large number of signiicantly unregulated ER bind-ing sites. DiffBind outperformed these methods usbind-ing to-tal aligned reads for correction. However, Supplementary Figure S1C highlights the limitations of using total aligned reads.
Internal and spike-in normalization controls
Normalization using D. melanogaster chromatin and species-speciic antibody for H2Av. To overcome the challenges
of normalizing ChIP-seq data, Egan et al. (5) combined
the extract with xenogeneic chromatin and a second anti-body that is speciic to the spike-in organism’s chromatin. This controls for the eficiency of the immunoprecipita-tion if the same ratio of target to control chromatin is achieved between samples. This work reported that a reduc-tion in H3K27me3 in response to inhibireduc-tion of the EZH2 methyltransferase cannot be detected by standard normal-ization techniques. Instead, the study demonstrated
ge-nomic H3K27me3 reduction by includingD. melanogaster
(Dm) derived chromatin and a Dm-speciic histone vari-ant H2Av vari-antibody as a spike-in control for normalization. However, this method fails to control for variation in son-ication fragment length distributions or innaccuracies in quantifying chromatin concentration.
The challenge in analyzing the genome-wide reduction in H3K27 methylation by ChIP-seq shares many similari-ties to quantifying changes in ER binding after fulvestrant treatment. In particular, both result in a global unidirec-tional change in chromatin occupancy due to the speciic loss of the target molecule.
We applied this method of normalization to
fulvestrant-depleted ER samples using xenogeneic D. melanogaster
chromatin and an H2Av antibody. Figure1A shows a
sim-ilar distribution to Supplementary Figure S1C, including the off-center putative unchanged ER binding events
(Fig-ure1A, within red triangle) as highlighted in
Supplemen-tary Figure S1A. Overlaying the peak information from the
D. melanogasterpeaks indicated that they overlapped along
the samey-axis value (Figure1B) as the ER binding events
(Figure1A) that are presumptively unchanged or false
pos-itive peaks. We then applied a linear it to Dm log2
(fold-change) values for each binding site. The coeficients gener-ated from the linear regression were then used to adjust the
log2(fold-change) of all data points (Figure1C). The
nor-malization of the data resulted in a reduced number of creased ER binding events at 48 h. The remaining loci of in-creased binding resulted from the higher variation at lower intensities.
D
o
w
n
lo
a
d
e
d
fro
m
h
ttp
s:
//a
ca
d
e
mi
c.
o
u
p
.co
m/
n
a
r/
a
rt
icl
e
-a
b
st
ra
ct
/4
6
/1
2
/e
7
5
/4
9
7
2
8
7
4
b
y
U
n
ive
rsi
ty
o
f Y
o
rk
u
se
r
o
n
2
4
S
e
p
te
mb
e
r
2
0
1
Figure 2. CTCF peak height remains constant while ER peaks change upon treatment with fulvestrant. As the binding of CTCF at the three control peaks (right) will remain constant in all three conditions, the data is scaled to CTCF peak height. After 100 nM fulvestrant treatment for 48 h, ER binding (left) shows a reduction in binding at the RARA gene (red) when compared to control (blue). The CTCF peaks can be conirmed against a CTCF only ChIP-seq experiment (red).
Normalization utilizing ER antibody cross-reactivity and spike-in murine chromatin. A challenge with using D. melanogasterspike-in chromatin as a reference standard for
H. sapiensChIP-seq experiments is that both antibody and chromatin must be precisely and accurately quantiied. This is technically challenging because cross-linking eficiency,
the fragment size and the protein concentration ofH.
sapi-enschromatin may not be constant between experimental
conditions. In an attempt to reduce the number of variables that can result in experimental error, we developed a similar
method to that of Bonhoureet al.(6). Their study utilized
the cross-reactivity of a Pol II antibody against Hs control
chromatin and sample chromatin fromM. musculus(Mm).
The ER antibody utilized in this study is known to cross-react with both Hs and Mm ER homologs. We therefore expected that the inclusion of Mm chromatin would provide a series of control data points that would remain constant between conditions. Unexpectedly, we found that Mm ge-nomic ER peaks were greatly increased after treatment with fulvestrant (Supplementary Figure S5A). We compared the level of Hs and Mm reads between samples and found the ratios to be consistent (Supplementary Figure S6), which precludes poor sample balancing as the cause of the results presented in Supplementary Figure S5.
These results highlight a problem with using a constant antibody and a xenogeneic source of chromatin for normal-ization. Despite constant levels of mouse ER, as the spike-in cell line was not treated with fulvestrant, we observe an ap-parent change in ER binding. We propose that the ER anti-body has lower afinity for mouse ER, compared to human ER. Therefore, we conclude that the increase in Mm reads from ER binding sites results from a reduction in
competi-tion with human ER for the same antibody, because fulves-trant is degrading human ER. These challenges are likely to be less of a concern when applying this method to a more conserved target and this explains why there has been pre-vious success in applying this strategy to the analysis of hi-stones (5) and RNA Polymerase (6).
Normalization using a second control antibody to provide an internal control. A key reason for utilizing the cross-reactivity of antibodies between organisms was to reduce the number of sources for experimental variation. For the same reason, we developed the use of a second antibody as an experimental control to normalize the signal. The ad-vantages of using a second antibody over a spike-in control is that the target:control antibody ratio can be maintained for all samples by producing a single stock solution. For concurrent experiments, a single stock of antibody-bound beads can be prepared and used for all samples with mini-mal variation. For this control to be effective, it is critical to identify a DNA-binding protein whose genomic distribu-tion and intensities are not affected by the treatment. For the analysis of ER binding, we chose CTCF as our control antibody. While CTCF is affected by compounds that tar-get ER, the effects of these changes have been documented at only a small fraction of the total number of sites (34), a result that was subsequently replicated in our own analysis
(Figure2; Supplementary Figures S8 and 9B).
We separated the ER and CTCF binding events and plot-ted them separately on an MA plot (Supplementary Fig-ure S7A and B). As previously shown for Dm spike-in
con-trol, we applied a global it to the log2-fold-change between
the two conditions, thereby correcting the bias in
fold-D
o
w
n
lo
a
d
e
d
fro
m
h
ttp
s:
//a
ca
d
e
mi
c.
o
u
p
.co
m/
n
a
r/
a
rt
icl
e
-a
b
st
ra
ct
/4
6
/1
2
/e
7
5
/4
9
7
2
8
7
4
b
y
U
n
ive
rsi
ty
o
f Y
o
rk
u
se
r
o
n
2
4
S
e
p
te
mb
e
r
2
0
1
change between conditions in ER binding (Supplementary Figure S7C). Taken together, we show that performing a parallel ChIP-seq experiment with an unrelated and rela-tively unchanged factor is an alternative and complemen-tary method to account for extreme genomic changes in fac-tor occupancy.
Pipeline and quantitative analysis
H2Av and CTCF provide a set of unchanged reference peaks for normalization. For a parallel-factor ChIP to be effec-tive as an internal control, the majority of the binding sites for the control factor must not change between the two conditions. We identiied control CTCF peaks from a con-ventional CTCF ChIP-seq experiment that did not include ER antibody. Since the signal at CTCF-proximal ER bind-ing sites may change upon fulvestrant treatment due to the overlapping signal from ER peaks, we excluded all CTCF ChIP-seq peaks that are within 500 bp of previously identi-ied ER binding sites from MCF-7 cells. Comparison of the two control datasets (Supplementary Figure S9) displayed a lower variance and a lower maximum fold-change for H2Av compared to the CTCF control binding regions. In contrast, the CTCF dataset provides a much greater number of data points for normalization as a result of relative size of the
human andDrosophilagenomes. None of the H2Av sites in
theDrosophilagenome or CTCF sites used for normaliza-tion showed a signiicant change in occupancy.
Normalization implementation using DESeq2 and size fac-tors. DESeq2 was initially developed for the analysis of RNA-seq data (32) to provide a method to quantify sig-niicant differences in gene expression between two sam-ples by modeling gene counts data with a negative binomial distribution. Given the similarities in ChIP-seq and RNA-seq, primarily that they are both based on the same high-throughput sequencing technologies, DESeq2 has been suc-cessfully adapted to ChIP-seq analysis to establish differen-tial intensity analysis of histone modiications.
DESeq2 is designed for an RNA-seq library where to-tal transcription is assumed to not change between
condi-tions and∼100% of counts are signal (in contrast, the
ChIP-seq signal is often contributed by fewer than 5% of reads).
As expected, the default DESeq2estimateSizeFactors()
pa-rameter calculated from a ChIP-seq counts table distorted the average change in ER signal because the assumption of constant total binding between conditions is not met (Sup-plementary Figure S10A). In the dual antibody Dm spike-in experiment, the Dm H2Av peaks should be constant. We manually used the read counts in these H2Av control peaks as a size factors parameter estimate for correcting ER bind-ing intensities (Supplementary Figure S10B). We processed the CTCF internal control data in the same manner, using the counts with CTCF peaks to adjust the size factors pa-rameter. We normalized the data using the counts within CTCF peaks to estimate the DESeq2 size factors (Supple-mentary Figure S11B).
Integration with DiffBind using corrected size factors. Diff-Bind (23) is an established R package to provide a pipeline to quantitatively measure differential binding from ChIP-seq data. DiffBind has been applied to a variety of ChIP-ChIP-seq
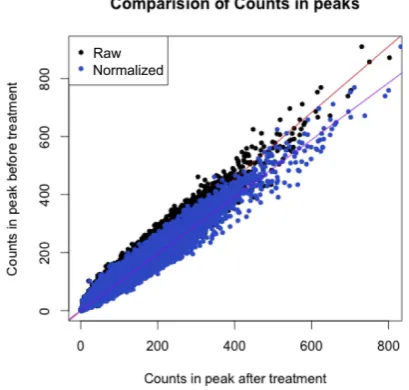
Figure 3. Comparison of mean counts in CTCF peaks before and after treatment. If the samples have no systematic bias before and after treat-ment then the linear it would be expected to have a gradient of 1. Here, we
establish that the gradient is<1, implying a systematic bias between
sam-ples. The read counts in the treated samples peaks are corrected (blue), removing the bias and resulting in a new gradient of 1.
studies; recent examples include the epigenomic landscapes of retinal rods and cones (35), the interaction of MDM2 polycomb repressor complex 2 (36) and establishing an
en-vironmental stress response network inArabidopsis(37). In
a comparative study of ChIP-seq analysis tools, DiffBind re-liably outperformed other methods (12) and is the preferred strategy for analysis of ChIP-seq experiments with multiple replicates. For these reasons, we chose DiffBind to under-pin our analytical methodology and as a key benchmark to improve upon. A key feature of DiffBind is that, to cal-culate size factors, it utilizes the total library size from the sequence data provided in a sample sheet (e.g. BAM iles)
rather than theestimateSizeFactors function provided by
DESeq2. Nonetheless, while improved, the analysis of the raw data by DiffBind is incomplete with the putative
un-changing peaks showing a>0 log-fold-change
(Supplemen-tary Figure S12). To address this shortcoming, we modiied
the DiffBind package to directly calculate thesizeFactor
pa-rameter from a counts matrix of control peaks, in our case either H2Av or CTCF peaks (Supplementary Figure S12B).
Establishing a normalization coeficient by linear regression of control peak counts
DESeq2 generates the size factor estimates through the summation of all reads within the peaks, resulting in a bias to the peaks with the largest read count. We therefore hy-pothesized that we could improve normalization by calcu-lating the sample bias through the application of linear re-gression. We plot the read count in each CTCF peak of one
condition against the other (Figure3) and then apply a
lin-ear model to the data. Our normalization coeficient is de-ined as the constant by which we need to scale the count data for each CTCF peak from the treated samples to cor-rect this systematic bias (and thereby setting the gradient
D
o
w
n
lo
a
d
e
d
fro
m
h
ttp
s:
//a
ca
d
e
mi
c.
o
u
p
.co
m/
n
a
r/
a
rt
icl
e
-a
b
st
ra
ct
/4
6
/1
2
/e
7
5
/4
9
7
2
8
7
4
b
y
U
n
ive
rsi
ty
o
f Y
o
rk
u
se
r
o
n
2
4
S
e
p
te
mb
e
r
2
0
1
[image:7.612.330.535.71.266.2]Figure 4.Comparison of DiffBind results before and after our two methods of normalization. (A) Normalization to library size. (B) Applying the corrected
size factors from our DESeq2 pipeline generated from CTCF internal control. (C) Applying correction using linear regression of CTCF peaks between
conditions to normalize the data. The result is a 10.7% increase in the number of loci detected as signiicantly changed ER binding.
of the linear it equal to 1). This normalization coeficient is then applied in the same manner to ER count data and then reinserted into the DiffBind object for analysis.
We compared normalization by total library size, CTCF control peak-derived size factors, and linear regression to our sample data. Our linear regression method provided higher sensitivity, as 10.7% more sites were detected as
dif-ferentially bound (FDR<0.05) compared to normalization
by library size alone (Figure4).
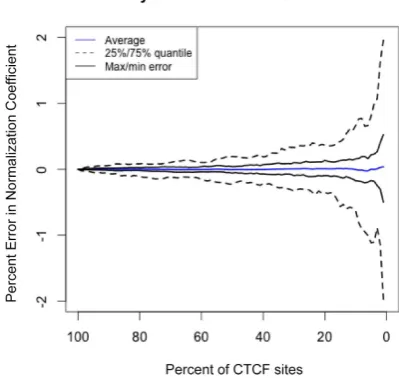
Normalization factors are consistent over a wide range in number of control binding sites
In order to determine if parallel-factor ChIP normalization could be used with factors that are not pervasively bound throughout the genome like CTCF, we recalculated the nor-malization coeficient by sub-sampling from 100% to 1% of the CTCF peaks. The variability of the result was then
modeled by re-sampling each analysis 100 times (Figure5).
When sampling only 1% of sites at random, 50% of cases
resulted in an error of<0.5% and the maximum error was
still within 2% of the expected value. This analysis indicates that parallel factor ChIP is robust and that the number of control peaks can vary over two orders of magnitude and not substantially affect the normalization factor.
Normalization of samples with minimal binding condition
In the absence of E2, ER binding to DNA is nearly un-detectable by ChIP-seq. The minimal level of TF binding in the initial condition could present a challenge to nor-malization. To conirm if parallel-factor ChIP was suitable for application to conditions with a very low level of initial binding, we applied our pipeline to the analysis of ER bind-ing in E2-free conditions and 45 min after stimulation with 100 nM E2. The data was normalized using our pipeline and we identiied 16 884 sites of signiicantly increased
bind-ing (FDR=0.05, Supplementary Figure S14A). Analysis of
normalized read depth at known binding sites near RAR␣,
NRIP1 and XBP1 genes showed an increase in ER bind-ing as expected (Supplementary Figure S14B).
Compari-Figure 5.Stability of CTCF derived normalization coeficient. Stability of the CTCF derived normalization coeficient was analyzed by sub-sampling CTCF peaks before undertaking the calculation (between 1 and 100% of total sites) at random. This analysis was repeated 100 times to model the variability of the result.
son of conditions show good correlation between replicates (Supplementary Figure S14C). Motif analysis of the sites displaying signiicantly increased binding gave strong en-richment for the motifs of the ERE, FOXA1 and GATA3 representing the core ER complex (Supplementary Figure S14D). Comparison of sites that showed increased ER
bind-ing (FDR=0.01, Supplementary Figure S15) overlapped
with a core of 1312 conserved sites across four independent
studies and>60% of peaks overlapped with at least 1 other
dataset.
Parallel-factor ChIP to normalize broad histone modiication peaks
Applying parallel-factor ChIP to histone modiications presents an additional challenge because histone modiica-tions occur over broad domains, as opposed to the discrete
D
o
w
n
lo
a
d
e
d
fro
m
h
ttp
s:
//a
ca
d
e
mi
c.
o
u
p
.co
m/
n
a
r/
a
rt
icl
e
-a
b
st
ra
ct
/4
6
/1
2
/e
7
5
/4
9
7
2
8
7
4
b
y
U
n
ive
rsi
ty
o
f Y
o
rk
u
se
r
o
n
2
4
S
e
p
te
mb
e
r
2
0
1
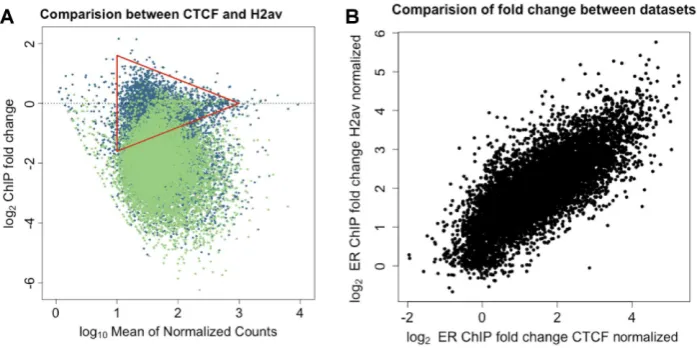
[image:8.612.345.545.290.479.2]Figure 6.Comparison of normalization methods using consensus peak set. (A) The analysis for the CTCF normalized (blue) and H2Av normalized (green) dataset using an ER consensus peak set of 10 000 peaks were formatted as an MA plot and overlaid. This recovered the low-fold-change higher-intensity
peaks that were not visible in Supplementary Figure S7A and both datasets showed a similar distribution. (B) Comparison of fold-change values for
individual ER binding sites between two datasets showed that the inclusion of these sites did not appear to affect the correlation (r=0.77).
binding TFs. To demonstrate the application of parallel-factor ChIP-seq to histone marks, we applied our method to H4K12ac in MCF7 cells. ER regulates H4K12 acetyla-tion through the recruitment of BRD4 (27). Analysis of the normalized data showed an increase of H4K12ac at 11393 sites and reduction at 4817 sites (Supplementary Figure
S16A), overall resulting in a signiicant increase (P-value
=5.7×10⁻¹²) of the H4K12ac histone mark as expected.
A total of 377 of the individual sites are signiicant after
multiple testing correction (FDR=0.05). As no
genome-wide statistical analysis had previously been undertaken at individual peaks, we cannot compare this result; however, included in those 377 signiicant sites were GREB1 (FDR
=2.7×10⁻⁴) and XBP1 (FDR=3.0×10⁻⁶) peaks near
their respective transcription start site (TSS), as previously reported (27). Analysis by qPCR of H4K12ac of GREB1, CXCL12 and XBP1 sites (Supplementary Figure S16B),
along with the H4K12ac occupancy proile ±3000 bp of
ER Binding (Supplementary Figure S16D), agreed with a previous report (27). As H4K12ac is commonly associated with transcription (38) and previous work reported that ER recruits BRD4 to increase H4K12 acetylation at active pro-moters (27), we repeated the analysis focusing on H4K12ac
occupancy within±500 bp of ER binding at transcription
start sites. Under this more stringent iltering, we identi-ied 497 ER promoter regions with H4K12ac occupancy. Of these sites, 28 regions were found to have signiicantly increased levels of H4K12ac compared to ive regions with
decreased (FDR =0.05) occupancy, equating to ∼6-fold
more sites with increased H4K12ac than had decreased. In
comparison, we observed a∼2-fold bias genome-wide.
Comparison of absolute fold-change from parallel-factor ChIP and xenogeneic spike-in
A small subset of high-intensity low-fold-change peaks, i.e.
those at the narrow end of the triangle in Figure1A, were
absent in the MA plots of samples generated with the
par-allel pull-down of CTCF and ER (Figure1A and
Supple-mentary S7A). To address if masking of ER binding sites by CTCF has a signiicant impact on the results of ER parallel-factor ChIP, we re-analyzed the data using a consensus set of 10 000 high-conidence ER binding sites (as established by ER-only ChIP). Normalization was carried out as pre-viously described, either using the Dm chromatin or the CTCF loci. In principle, if both the internal control using CTCF binding events and the use of the spike-in Dm/H2Av control are accurate, the normalized fold-change for each genomic loci between the two data sets should be equal. Plotting the fold-change of normalized results from the two
experimental methods (Figure6) gave a result of near
par-ity between the methods (linear it of gradient=0.94) and
a correlation ofr=0.77, with aP-value tending to 0).
Cross-normalization of single-factor ChIP to parallel-factor ChIP
A potential limitation of parallel-factor ChIP is that CTCF sites may suppress the fold-change measurement of proxi-mal TF binding sites. To address this, we made use of an in-trinsic feature of standard ChIP-seq that the method accu-rately quantiies relative binding intensities within the same pull-down. By quantifying TF binding at sites that are not proximal to CTCF in a parallel-factor ChIP experiment, we can normalize all sites in a TF-only ChIP. To demonstrate cross-normalization, we used the Hs reads from the HsDm dataset as an example of an ER-only ChIP-seq dataset. We established a set of consensus peaks by matching non-CTCF proximal ER binding sites from our parallel-factor ChIP with ER binding sites in our ER-only experiment. Given that relative binding between sites is intrinsically ac-curate, by normalizing the ER consensus site binding in the ER-only experiment to the normalized parallel-factor ChIP, we were able to accurately normalize all sites in the ER-only experiment (46). As the ER-only data we used contained xenogeneic spike-in controls, we were able to validate the cross-normalization. Comparison of
log-fold-D
o
w
n
lo
a
d
e
d
fro
m
h
ttp
s:
//a
ca
d
e
mi
c.
o
u
p
.co
m/
n
a
r/
a
rt
icl
e
-a
b
st
ra
ct
/4
6
/1
2
/e
7
5
/4
9
7
2
8
7
4
b
y
U
n
ive
rsi
ty
o
f Y
o
rk
u
se
r
o
n
2
4
S
e
p
te
mb
e
r
2
0
1
change after normalization using the xenogeneic spike-in and cross-normalization showed cross-normalization gave equivalent results to that previously seen: Pearson’s
correla-tion of 0.992,P-value tending to 0 (Supplementary Figure
S13A). Analysis of ER binding events proximal to CTCF after cross-normalization showed a marginally greater mag-nitude of mean and maximal fold-change compared to that established by parallel-factor ChIP (Supplementary Figure S13B). We can therefore ascertain that cross-normalization provides a robust strategy to establish changes in TF bind-ing; however, in the case of ER binding, the suppressive ef-fect of proximal CTCF binding is minimal.
Analysis of patient-derived xenografts (PDX) by parallel-factor ChIP
To demonstrate the versatility of parallel-factor ChIP-seq, we applied our method to the analysis of ive patient-derived xenografts (PDX) samples. The analysis of PDXs presents similar challenges to that of clinical material. As a conse-quence of the high levels of sample heterogeneity, the sam-ple preparation and immunoprecipitation steps in the ChIP protocol are signiicantly more variable than for cell lines. The low amounts and the high value of samples present fur-ther challenges by limiting the ability to perform replicate experiments and analysis.
Analysis of CTCF binding within the samples acted as a QC step (Supplementary Figure S17A). PDX02 showed no enrichment at either CTCF or ER binding sites, thereby conirming the result was not due to low-expression of ER in the PDX material. The sample was therefore excluded from further analysis. Clustering of samples by ER binding events gave two clusters with PDX01 and PDX04 display-ing the greatest correlation (Supplementary Figure S17B). A potential reason for the clustering is PDX01 and PDX04 are both derived from PR positive tumors, while PDX05 is derived from a PR negative tumor. The PR status of PDX03 is unknown.
Comparison of normalization to total read count (RPM) and parallel-factor ChIP showed a large disparity between
the two methods at the RARA␣, GREB1 and CLIC6 ER
binding sites (Supplementary Figure S17C). Analysis of the variance of the CTCF control peaks proximal to these sites demonstrated Parallel-Factor ChIP-seq was able to stabi-lize the data (Supplementary Figure S17D) while normal-ization to total read count gave little improvement over the raw data. PDX05 was found to have the lowest levels of ER bound at the sites investigated.
Genome-wide proiling of the parallel-factor ChIP-seq PDX data was in agreement with the analysis of individal promoters. CTCF binding was normalized between sam-ples (Supplementary Figure S18, top) and gave a consis-tent proile. ER binding genome-wide was then normalized on the basis of the correction established from CTCF bind-ing. Before normalization, all four samples displayed dif-ferent maximum levels of ER binding. After normalization PDX01, PDX03 and PDX04 gave similar levels of ER bind-ing, all derived from tumors with an Allred (39) score of 8 (an immunohistochemical score out of 8 estimating the proportion and intensity of ER-staining in tumor cells).
In agreement with the analysis of RARA␣, GREB1 and
CLIC6 ER binding sites, PDX05’s binding proile showed a reduced maximum level of binding. These results are in agreement with the PDX05 being derived from a tumor with an Allred score of 5 (Supplementary Figure S18, bottom).
DISCUSSION
We have described a normalization strategy using internal ChIP-seq controls. We applied this technique to normalize TF binding in a model system and patient derived xenograft samples. Moreover, we developed and implemented a sta-tistical analysis at the level of individual binding sites, which was lacking from previous spike-in methodologies. We demonstrate that a parallel-factor control antibody is a reliable alternative to previously described experimental controls (4,5).
We showed that an internal parallel-factor control is com-parably quantitative to using a second antibody and xeno-geneic chromatin as a spike-in control, but there are many advantages to using a second antibody (CTCF) that IPs a protein within the same extract. Primarily, the parallel-factor ChIP controls for the greatest number of steps in the process and gives fewer opportunities for variation being in-troduced into the sample preparation. In contrast, the ad-dition of xenogeneic chromatin relies on the precision that the concentration of the chromatin of both the experimen-tal samples and the spike-in can be established reliably and must be added to each sample individually. As chromatin is routinely cross-linked for ChIP-seq, the resultant mix-ture of protein and DNA makes accurate quantiication of DNA challenging without puriication, which presents an-other challenge for the use of xenogeneic spike-in methods.
Limitations
Normalization has over-promised the ability to directly compare different ChIP-seq experimental conditions, an aim that is intrinsically challenging due to the inherent bio-logical and environmental variability between experiments. As a result, inconsistency between ER ChIP-seq in previ-ous datasets is an ongoing challenge (40). While parallel-factor ChIP provides an essential normalization between conditions, it should be understood that the method can-not control for large-scale biological and environmental fac-tors. To demonstrate these challenges, we compared our re-sults with three independent studies and found substantial overlap of our ER binding events (>60%) with those previ-ously reported. Further iltering for conserved ER binding across all four studies gave a core of 1312 sites (Supplemen-tary Figure S15), improving on a previous comparison of similar datasets which gave only 284 (40). Nonetheless, this core set of binding events represents less than 10% of
signif-icant binding sites we identiied at an FDR=0.05. This low
level of reproducibility between studies highlights the need to understand that biological and environmental variability is distinct from the technical variability for which parallel-factor ChIP is designed to control. The key challenge our method resolves is providing a value of fold-change from differential analysis that is accurate and comparable be-tween experiments, which has not previously been possible with analytical normalization (7). Once the fold-change for
D
o
w
n
lo
a
d
e
d
fro
m
h
ttp
s:
//a
ca
d
e
mi
c.
o
u
p
.co
m/
n
a
r/
a
rt
icl
e
-a
b
st
ra
ct
/4
6
/1
2
/e
7
5
/4
9
7
2
8
7
4
b
y
U
n
ive
rsi
ty
o
f Y
o
rk
u
se
r
o
n
2
4
S
e
p
te
mb
e
r
2
0
1
each peak has been established, then we can undertake di-rect comparison of fold-change between datasets through
the use of consensus peak sets (Figure6).
The reliability of any experimental control is critical for any normalization technique. For the parallel-factor ChIP peaks, we undertook triplicate biological replicates. If one was to require the CTCF peak to appear in every replicate, this would result in over 54 000 high-conidence peaks in our test dataset. Analysis of the stability of the normalization coeficient showed only a small fraction of this number of
sites is needed with<2% maximal error when using only 1%
of CTCF peaks (Figure5). Nonetheless, due to the key role
that normalization plays in the downstream data analysis, the quality of the data obtained should be assessed by a QC pipeline, e.g. ChIPQC (41) and NGS-QC (42).
Importantly, our use of normalization controls appears resilient to changes in antibody batch. There are genuine concerns in reproducibility of ChIP-seq as a result of batch variation in antibody. We were able to demonstrate strong correlation between the xenogeneic spike-in and parallel-factor controls despite the two experiments being con-ducted with different lots of ER antibody (see ‘Materials and Methods’ section) and at different times. Nonetheless, the initial differential analysis that establishes normalized fold-change should be performed with the same batch and source of antibody.
Parallel-factor ChIP has broad utility in the chromatin and transcription ields. First, we established the ability to normalize signal from samples that have effectively no de-tectable binding in the initial condition. We exhibited this ability using the extreme example of a nuclear receptor that is nearly entirely unbound in the ligand-free condition. Sec-ondly, we showed that this approach effectively normalizes histone modiication ChIP-seq data, which presents a dis-tinct set of challenges (7). We were able to reliably nor-malize both ER and H4K12ac ChIP-seq signal to the con-trol factor that was immunoprecipitated in parallel (CTCF). Previous studies provided evidence of a global increase in H4K12ac. Through the application of parallel-factor ChIP, we were able to monitor changes in individual regions of
H4K12ac genome-wide. In agreement with Nagarajanet al.
(27), we found average occupancy of H4K12ac increases; however, we showed the increase is coupled with a global re-distribution of H4K12ac not previously described. Analyt-ical normalization would typAnalyt-ically suppress measurement of the global increase in H4K12ac, yet the use of parallel-factor ChIP enabled the quantitative analysis of the increase in the H4K12ac histone mark while simultaneously provid-ing evidence of the redistribution of H4K12ac histone oc-cupancy. This exempliies the power of the internal controls provided by parallel-factor ChIP. Without these controls, we would have been unable to reconcile our more detailed
analysis with the results presented by Nagarajanet al.
Experimental normalization is essential and complementary to analytical normalization
Normalization at the analysis stage has developed consider-ably since early ChIP-seq experiments; recent examples in-clude ChIPComp (31), csaw (11) and HMCan-diff (15). In contrast to analytical normalization, the development of
ex-perimental sample controls is more limited (4–6,8). Exper-imental normalization, including parallel-factor controls, remain necessary as analytical normalization of pull-down eficiency is only possible between replicates of the same ex-plicit condition (14,15). Without experimental controls to provide a reference, any systematic bias between conditions will remain indistinguishable from biological signal.
ER response to fulvestrant
The only previous ChIP-seq study of the effects of fulves-trant on ER binding (43) identiied 10 205 ER binding sites in the control condition. The ER binding was compared to tamoxifen (8855 peaks) and fulvestrant (4285 peaks) treat-ments and concluded the presence of ligand-speciic bind-ing. This result has since been disputed in the context of the tamoxifen treatment (44). The majority of the tamoxifen-speciic peaks were reassigned as ER peaks by Hurtado
et al.and, of the remaining tamoxifen-speciic sites, only seven were found in both studies and therefore not repro-ducible. Our analysis of ER binding identiied 13 745 sites in the control condition under the more stringent require-ments. After normalization, we found no evidence that ful-vestrant induced ligand-speciic binding at 48 h after treat-ment. Given a single replicate, it is not possible to estab-lish a statistical test of binding at each site from the
Wel-borenet al. dataset. Our analysis found 10 705 (FDR <
0.05) differentially bound sites, which is substantially more than previously identiied. Gene Set Enrichment Analysis with GREAT (28) conirmed consistency with the literature as there was signiicant enrichment for the ER pathways for both the MSigDB pathway and perturbation datasets.
Importance of experimental normalization
Normalization has played a key role in these analyses as, before normalization, our analysis found sites that would be considered to have signiicantly increased ER binding on fulvestrant treatment. Further, as we repeated the ex-periment with two different normalization techniques, we can conidently state that, in the context of asynchronous MCF7 cells, fulvestrant does not result in any signiicantly increased binding after 48 h of treatment.
We have shown, as parallel-factor ChIP-seq utilizes inter-nal standards, our protocol can be applied to the ainter-nalysis of tumor samples, PDXs and other clinical material. Consis-tent sample preparation is a key challenge in clinical sam-ple studies; and by controlling for variation in cell lysis, im-munoprecipitation and sonication eficiency, parallel-factor ChIP allows for the deconvolution of biological signal from variability in sample preparation in a way that is not possi-ble with spike-in normalization methods. As implemented here, one could monitor if individuals who are heterozygous for DNA binding proteins have absolute reduced binding or if the absolute levels of TF binding increase during disease progression.
Integration with existing methods
Most importantly, we have developed the analysis tools to integrate the normalization strategies described into well-established quantitative ChIP-seq analysis methods (32). By
D
o
w
n
lo
a
d
e
d
fro
m
h
ttp
s:
//a
ca
d
e
mi
c.
o
u
p
.co
m/
n
a
r/
a
rt
icl
e
-a
b
st
ra
ct
/4
6
/1
2
/e
7
5
/4
9
7
2
8
7
4
b
y
U
n
ive
rsi
ty
o
f Y
o
rk
u
se
r
o
n
2
4
S
e
p
te
mb
e
r
2
0
1
providing an open and reproducible pipeline, we permit oth-ers the ability to accurately normalize TF binding. We ex-pect future studies of TFs that undergo rapid and genome-wide changes will ind the methods we present essential to accurately characterize biological effects. Our analysis tools, combined with the beneits and relative simplicity of parallel-factor ChIP to normalize ChIP-seq data, have pro-vided a fundamental resource for quantitative TF analysis.
DATA AVAILABILITY
All sequence data utilized for this study is available from the Gene Expression Omnibus (GSE102882, GSE107749 and GSE110824).
SUPPLEMENTARY DATA
Supplementary Dataare available at NAR Online.
ACKNOWLEDGEMENTS
We would like to acknowledge the contribution from the CRUK CI Genomics and Bioinformatic core facilities in supporting this work. We are grateful to Rory Stark for sup-plying a modiied version of his DiffBind Package and to Ashley Sawle and Federico Giorgi for their ideas and sup-port in strategies for alignments to multiple genomes. We would like to thank Caldas Lab at CRUK CI for providing PDX material to support our method development.
Authors’ contribution: M.J.G. and A.N.H. conceived the normalization strategies, designed the experiments, under-took the data analysis and wrote the manuscript. A.N.H. and A.E.C. undertook the ChIP-seq experiments. A.N.H. developed the R data and analysis packages. F.M. reviewed and contributed to the initial proposal and provided feed-back to the project.
FUNDING
University of Cambridge; Cancer Research UK; Hutchison Whampoa Limited; CRUK Core Grant [C14303/A17197, A19274 to F.M., in part]; Breast Cancer Now Award [2012NovPR042 to F.M., in part]; CRUK Travel Award [C60571/A24631 to A.N.H., in part]; Thomas Jefferson Fellowship [to A.N.H., in part]. Funding for open access charge: Cancer Research UK Grant.
Conlict of interest statement.None declared.
REFERENCES
1. Mei,S., Qin,Q., Wu,Q., Sun,H., Zheng,R., Zang,C., Zhu,M., Wu,J.,
Shi,X., Taing,L.et al.(2017) Cistrome data Browser: a data portal for
ChIP-Seq and chromatin accessibility data in human and mouse. Nucleic Acids Res.,45, D658–D662.
2. Song,L., Koga,Y. and Ecker,J.R. (2016) Proiling of transcription factor binding events by Chromatin Immunoprecipitation Sequencing
(ChIP-seq).Curr. Protoc. Plant Biol.,1, 293–306.
3. Sakata,T., Shirahige,K. and Sutani,T. (2017) ChIP-seq analysis of
condensin complex in cultured mammalian cells.Methods Mol. Biol.,
1515, 257–271.
4. Orlando,D.A., Chen,M.W., Brown,V.E., Solanki,S., Choi,Y.J., Olson,E.R., Fritz,C.C., Bradner,J.E. and Guenther,M.G. (2014) Quantitative ChIP-Seq normalization reveals global modulation of
the epigenome.Cell Rep.,9, 1163–1170.
5. Egan,B., Yuan,C.C., Craske,M.L., Labhart,P., Guler,G.D.,
Arnott,D., Maile,T.M., Busby,J., Henry,C., Kelly,T.K.et al.(2016)
An alternative approach to ChIP-Seq normalization enables detection of genome-wide changes in histone H3 lysine 27
trimethylation upon EZH2 inhibition.PLoS One,11, e0166438.
6. Bonhoure,N., Bounova,G., Bernasconi,D., Praz,V., Lammers,F.,
Canella,D., Willis,I.M., Herr,W., Hernandez,N., Delorenzi,M.et al.
(2014) Quantifying ChIP-seq data: a spiking method providing an
internal reference for sample-to-sample normalization.Genome Res.,
24, 1157–1168.
7. Saleem,M.A.M., Mendoza-Parra,M.A., Cholley,P.E., Blum,M. and Gronemeyer,H. (2017) Epimetheus-a multi-proile normalizer for
epigenomic sequencing data.BMC Bioinformatics,18, 259.
8. Chen,K., Hu,Z., Xia,Z., Zhao,D., Li,W. and Tyler,J.K. (2016) The overlooked fact: fundamental need for spike-in control for virtually
all genome-wide analyses.Mol. Cell. Biol.,36, 662–667.
9. Pepke,S., Wold,B. and Mortazavi,A. (2009) Computation for
ChIP-seq and RNA-seq studies.Nat. Methods,6, S22–S32.
10. Stark,R. and Hadield,J. (2016) Characterization of DNA-protein interactions: design and analysis of ChIP-seq experiments. In:
Aransay,A M and Trueba,JLL (eds).Field Guidelines for Genetic
Experimental Designs in High-Throughput Sequencing. Springer International Publishing, Cham, pp. 223–260.
11. Lun,A.T. and Smyth,G.K. (2015) Csaw: a bioconductor package for differential binding analysis of ChIP-seq data using sliding windows. Nucleic Acids Res.,44, e45.
12. Steinhauser,S., Kurzawa,N., Eils,R. and Herrmann,C. (2016) A comprehensive comparison of tools for differential ChIP-seq analysis. Brief. Bioinform.,17, 953–966.
13. Holmes,K.A., Brown,G.D. and Carroll,J.S. (2016) Chromatin immunoprecipitation-sequencing (ChIP-seq) for mapping of estrogen
receptor-chromatin interactions in breast cancer.Methods Mol. Biol.,
1366, 79–98.
14. Bao,Y., Vinciotti,V., Wit,E. and AC’t Hoen,P. (2013) Accounting for immunoprecipitation eficiencies in the statistical analysis of
ChIP-seq data.BMC Bioinformatics,14, 169.
15. Ashoor,H., Louis-Brennetot,C., Janoueix-Lerosey,I., Bajic,V.B. and Boeva,V. (2017) HMCan-diff: a method to detect changes in histone
modiications in cells with different genetic characteristics.Nucleic
Acids Res.,45, e58.
16. Osborne,C.K., Wakeling,A. and Nicholson,R.I. (2004) Fulvestrant: an oestrogen receptor antagonist with a novel mechanism of action. Br. J. Cancer,90, S2–S6.
17. Early Breast Cancer Trialists’ Collaborative Group. (1998) Tamoxifen
for early breast cancer: an overview of the randomised trials.Lancet,
351, 1451–1467.
18. Cristofanilli,M., Turner,N.C., Bondarenko,I., Ro,J., Im,S.A.,
Masuda,N., Colleoni,M., DeMichele,A., Loi,S., Verma,S.et al.
(2016) Fulvestrant plus palbociclib versus fulvestrant plus placebo for treatment of hormone-receptor-positive, HER2-negative metastatic breast cancer that progressed on previous endocrine therapy (PALOMA-3): inal analysis of the multicentre, double-blind, phase 3
randomised controlled trial.Lancet Oncol.,17, 425–439.
19. Ellis,M.J., Llombart-Cussac,A., Feltl,D., Dewar,J.A., Jasi ´owka,M., Hewson,N., Rukazenkov,Y. and Robertson,J.F. (2015) Fulvestrant 500 mg versus anastrozole 1 mg for the irst-line treatment of advanced breast cancer: overall survival analysis from the phase II
FIRST study.J. Clin. Oncol.,33, 3781–3787.
20. McClelland,R.A., Gee,J.M.W., Francis,A.B., Robertson,J.F.R., Blarney,R.W., Wakeling,A.E. and Nicholson,R.I. (1996) Short-term effects of pure anti-oestrogen ICI 182780 treatment on oestrogen receptor, epidermal growth factor receptor and transforming growth
factor-alpha protein expression in human breast cancer.Eur. J.
Cancer,32, 413–416.
21. Agrawal,A., Robertson,J.F., Cheung,K.L., Gutteridge,E., Ellis,I.O., Nicholson,R.I. and Gee,J.M. (2016) Biological effects of fulvestrant on estrogen receptor positive human breast cancer: short, medium
and long-term effects based on sequential biopsies.Int. J. Cancer,
138, 146–159.
22. Howell,A. (2006) Pure oestrogen antagonists for the treatment of
advanced breast cancer.Endocr. Relat. Cancer,13, 689–706.
23. Ross-Innes,C.S., Stark,R., Teschendorff,A.E., Holmes,K.A., Ali,H.R., Dunning,M.J., Brown,G.D., Gojis,O., Ellis,I.O.,
Green,A.R.et al.(2012) Differential oestrogen receptor binding is
D
o
w
n
lo
a
d
e
d
fro
m
h
ttp
s:
//a
ca
d
e
mi
c.
o
u
p
.co
m/
n
a
r/
a
rt
icl
e
-a
b
st
ra
ct
/4
6
/1
2
/e
7
5
/4
9
7
2
8
7
4
b
y
U
n
ive
rsi
ty
o
f Y
o
rk
u
se
r
o
n
2
4
S
e
p
te
mb
e
r
2
0
1