AND WORLD TRADE
E
u r o p e a n
U
n io n
t r a d e
d e v e l o p m e n t s
FOR THE YEAR 1996,
COMPARISON WITH THE UNITED STATES AND JAPAN
★
★
Cataloguing data can be found at the end of this publication.
Luxembourg: Office for Official Publications of the European Communities, 1997
ISBN 92-828-2282-6
© European Communities, 1997
Reproduction is authorised provided the source is acknowledged.
Printed in Belgium
GENERAL REMARKS...
i
SUMMARY OF DEVELOPMENTS ... ii
CHAPTER 1 - WORLD ECONOMIC DEVELOPMENTS...
1
Trade in goods and commercial services... ... 3
Developments of merchandise trade in volume by region... 4
CHAPTER 2 - EUROPEAN UNION EXTERNAL TRADE...
7
CHAPTER 3 - UNITED STATES EXTERNAL TRADE ... ... 14
CHAPTER 4 - JAPANESE EXTERNAL TRADE... 20
CHAPTER 5 - EUROPEAN UNION UNITED STATES JAPAN TRADE -
BREAKDOWN BY PRODUCT GROUP... ...
27
SPECIAL SUBJECT
Regionalism in world trade...
40
1) Sources and trade data
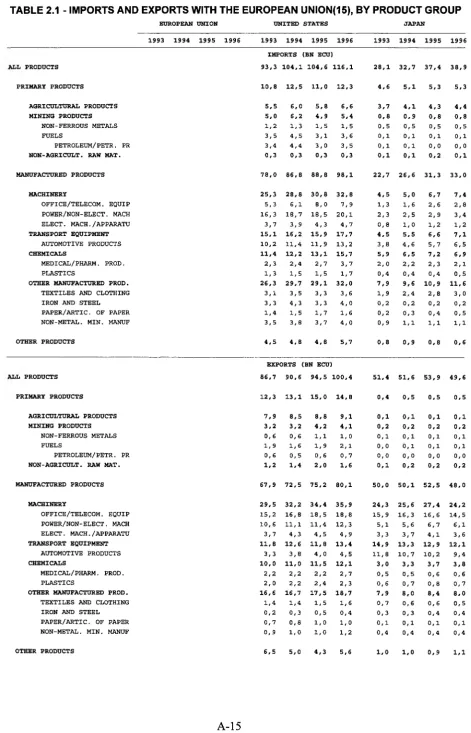
Data for the European Union for 1995 and 1996 originate from the database COMEXT of
EUROSTAT. However, data from 1992 to 1994 are extracted from the COMTRADE
database managed by the UN Statistical Office. This is also the source for the US and
Japanese figures from 1992 to 1996.
Import values include CIF (cost, insurance and freight) and export value are FOB (free on
board).
All trade flows (imports, exports and trade balances) reflect the data as given by the
reporting countries. There may be a divergence between the level of trade reported by
one country and the equivalent trade flow reported by a partner country.
2) Country groupings
The aggregate of the various country groupings is not equal to the value of "EXTRA 15" or
"WORLD", since some countries appear in more than one grouping, whilst others are not
included in any group. The composition of the various groupings is listed in the annex.
3) Exchange rates (1 ECU - ...)
Year
US dollar
Yen
1992
1.298
164.20
1993
1.172
130.10
1994
1.190
121.31
1995
1.308
123.01
1996
1.270
138.08
Signs and abbreviations
data not available
percentages exceeding 1000
bn
billion
World economic growth quickened during 1996 (+4% in real terms) following
widespread deceleration of activity in 1995.
The favourable global economic conditions were underscored by the continued
robust performance with low inflation in the United States, the pickup in growth in
Japan and a moderate recovery in the European Union and Canada.
Among the developing countries, activity strengthened in Africa, Middle East and
Latin America and more than compensated for the moderate slowdown in some
developing Asian countries.
For the countries in transition, considered as a group, the contraction of the economic
activity seems to have bottomed out in 1996 after six years of deep decline. However
the recovery in the Central and Eastern European countries was counterbalanced by
a fall in the Russian GDP.
The value of
world merchandise exports
showed a +3.7% increase in 1996
compared to 1995, totalling 5,100 bn US dollars. The slowdown in the growth rate
(from nearly +20% in 1995) exceeded by a wide margin the deceleration in volume
terms, as dollar prices of globally traded goods stagnated in 1996 after increasing by
+10% in 1995.
Also, exports of commercial services slowed down remarkably in 1996 (+5% growth
rate compared to +14% in 1995) and reached the value of 1,200 bn US dollars.
In volume terms, world trade growth was similar to the growth reported for the first
four years of the decade and below the levels recorded in 1994 and 1995, that were
unusually high. As a result, the large excess of trade growth over output growth
observed each year since 1990 was sharply reduced in 1996.
Among the reasons for the important slowdown of world trade growth in 1996, there
was the easing of the industrial countries' imports and the sluggish performance of
Asia. The export growth of this region in 1996 was not only below its output growth,
but also the smallest among the analysed regions.
On the contrary, Latin America registered a very outstanding export performance
(nearly triple the world average).
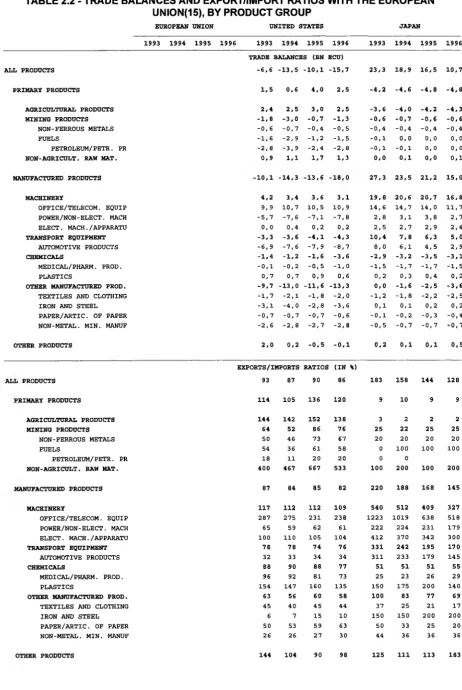
The value of EU merchandise trade balance,
which had been always in deficit since
1958 (except for the 1986-87 small surpluses) turned into the black in 1994, and
reached a remarkable figure of +43.4 bn ecu in 1996. This was mainly due to the
turnaround of the EU-US balance into a small surplus, and to the constant reduction
for the fourth consecutive year of the huge trade deficit with Japan.
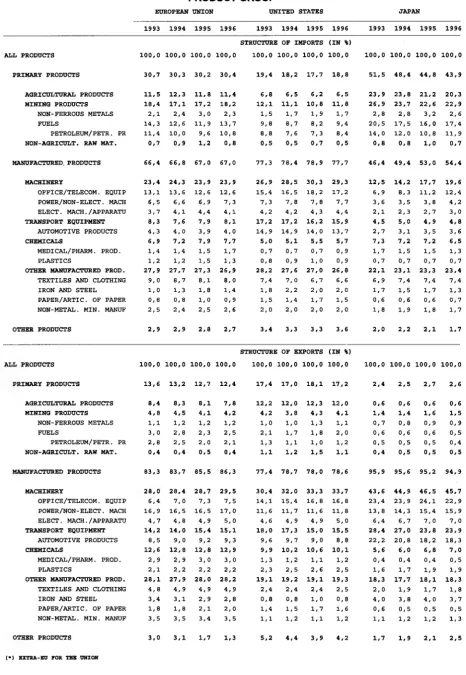
On the products side, the European Union’s structural deficit in the primary sector
(almost completely concentrated in the fuel products sector) was more than
compensated for by the surplus in manufactured products (which more than doubled
between 1994 and 1996).
as compared to that of the European Union. The bulk of its deficit is concentrated in
the manufacturing sector while in the primary sector (excluding the fuel products
deficit) agricultural products and other raw materials are structurally in surplus.
The combination of the economic recovery and the structural changes which
occurred in the Japanese trade patterns, due to the increase of FDI abroad, more
than compensated for the increase in price competitiveness due to the yen
devaluation, which began in the last quarter of 1995. As a consequence, Japanese
trade surplus in ecu terms went down again in 1996 to +48.6 bn ecu. The fall in the
Japanese overall trade surplus was mainly accounted for by the decline in the
manufactured products surplus, although the traditional Japanese deficit in primary
products also widened.
All the Triad countries registered a deterioration of their primary products deficits in
1996. Boosted by the increase in the international oil prices, imports of primary
products registered quite dynamic growth rates that, for the EU and the USA, were
even bigger than the corresponding rates for manufactured products. On the
contrary, export growth was more moderate and, in the case of Japan, even negative
(in line with the overall reduction of the ecu value of Japanese imports).
WORLD ECONOMIC DEVELOPMENTS
WORLD ECONOMY
+4% real growth in
world output in 1996.
Advanced economies
went up by +2.5%.
Developing countries
output was quite
dynamic with a
+6.5% growth rate.
Recovery started in
the transition
economies (+0.1%).
The advanced
economies (15%
world population)
produced 57% of the
world GDP; while
developing countries
(77% population)
less than 40%.
Industrial countries'
GDP grew by +2.3%
in 1996.
EU output went up by
a mere +1.6%.
Japanese and US
economies expanded
briskly (+3.6% and
+2.4% respectively).
Growth in the NIEs
slowed down as a
result of a slowdown
in exports.
In 1996 the world economy grew by +4% in real terms1. This
result was due to a combination of a relatively moderate growth
of +2.5% registered by the “advanced economies”2, a still
buoyant momentum (+6.5%) in the developing countries and
the start of the recovery among the transition economies,
whose GDP grew by 0.1% compared to the previous year.
On the one hand, this growth was accompanied by a low level
of global inflation, and by the reduction of fiscal imbalances in
many countries, which should help contain real long-term
interest rates and foster higher investment.
On the other hand, economic growth is not yet sufficiently high
to solve the big employment problems in the industrialised
countries and to reduce the areas of poverty in many
developing countries.
However, wealth seems to dwell on a more and more enlarged
share of the world population. In 1996 the output per capita
went up by +1.9% in the advanced economies (representing
56.6% of the world output and 15% of the world population),
while it jumped by +4.9% in the developing countries (where
77% of the population produces 39.2% of the total output).
The year 1996 was characterised by a quite important recovery
in the traditional
industrial countries
(+2.3% GDP growth
rate, the best result since 1989).
In the
European Union
growth was moderate for 1996 as a
whole (+1.6%), but economic activity recovered during the year
from the set back triggered by the monetary turbulence of
1995. Progress in convergence achieved on the road towards
EMU, as witnessed by budgetary consolidation and improved
price stability, makes it less likely that macroeconomic
obstacles, like a distorted policy-mix or monetary turbulence,
harm sustained growth and job creation in the future.
Outside the European Union, the dramatic increase in the
revenues of energy products export boosted the output in
Norway,
while in Switzerland the protracted recession due to
weak internal demand left the economy stagnant for the sixth
successive year.
The
United States economy expanded by +2.4% in real terms
and inflationary pressures remained low despite high resource
utilisation, including a tight labour market.
The recovery in Japan became more broadly based in 1996
(+3.6% in real terms) and the economic climate improved
under the influence of supportive fiscal and monetary policies.
Among the other countries recently included in the “advanced
economies” grouping, in Israel the recent restrictive economic
policies slowed down the output growth rate to a (still
remarkable) +4.4% in 1996. The protracted trend of economic
growth in the NIEs continued, even if at a slower pace partly as
a result of a slowdown in exports. Output in Korea went up by
+7.1% in 1996, followed by Singapore (+7%), Taiwan (+5.6%)
and Hong Kong (+4.5%).
The +6.5% increase in the global GDP of the developing
countries is the result of the important output growth in Africa
(+5%), the Middle East (+4.5%) and Latin America (+3.5%)
which more than compensates for the moderate slowdown in
some developing Asian countries. However, the latter area still
showed an important rate of growth (+8.2%).
Africa’s growth performance in 1996 (+5%, the strongest in
the last 20 years) was boosted mainly by the strong expansion
of the primary sector, in particular agriculture. However, in
some countries, the growth also included the manufacturing
sector. Improved production performances reflect continuing
advances in liberalisation efforts and the macroeconomics and
structural policies being introduced by a number of low-income
African countries.
In South Africa, the region’s most important economy, reforms
and stabilisation policies enhanced the growth, even if the
+3.1% increase was somewhat weaker than expected.
Growth in the Middle East region (+4.5%) was stronger than
expected, partly as a result of economic reforms introduced in
recent years, but also reflecting the higher-than-projected level
of oil prices. The combination of structural reforms, together
with cyclical factors, led to particularly positive GDP growth
rates for Egypt, Jordan, Syria, Lebanon and the Arab Emirates.
In contrast, lax fiscal and monetary policies and rampant
inflation could threaten the economic outlook in Turkey.
In Asia3 the slowdown towards more sustainable expansion
rates is partly the result of tight monetary policies established
to dampen the growth of domestic demand and avoid the risks
of overheating.
In addition, the slowdown in the region’s export growth in 1996
helped contain inflationary pressures in India, Malaysia,
Indonesia and Thailand.
China has also taken measures to reduce overheating (soft
landing policy) and real GDP growth slowed to just under
+10% with inflation slowing further to 6%, down from +22% in
1994.
In many Latin American countries, the economy is continuing
to recover following the 1995 Mexican crisis. In particular,
3 This text refers only to the 1996 developments. The effects and consequences of the 1997 financial crisis are therefore not included in this text.
2
In the developing
countries as a group,
growth picked up to
+6.5% in 1996 from
+6% the previous
year.
output grew remarkably in Mexico (5.1%) and Argentina (4.4%)
which together represented more than 40% of the global GDP
of this region. In Brazil growth slowed down slightly while
inflation fell to 9% by the end of the year, the lowest in the last
35 years. In Chile, the most successful economy in the region
(+7.2% growth), inflation fell to a 36 years low of 6.5% and
demand pressure eased in response to tighter monetary
policies.
Beginning of a
recovery in the
transition countries.
Output grew by
+0.1% in 1996.
CEECs economies
showed a +1.6%
growth for the
second consecutive
year.
Russian GDP
dropped again by
-2
.
8
%.
In contrast, the other
former USSR
Republics grew
slightly.
For the
countries in transition,
considered as a group, the
contraction of the economic activity seems to have bottomed
out in 1996 (+0.1 %)4 after six years of deep decline. However
among them individual countries showed quite different trends.
For the second consecutive year in 1996, the global output of
the
Central and Eastern European countries
showed a
recovery (+1.6%). Most of these countries are now reaping the
rewards of structural reforms and stabilisation policies pursued
with determination over several years. The economic
performance was positive in Croatia, the Czech and Slovak
Republics, Poland, Romania and Slovenia, thanks to the
growth in the manufacturing sector and increase in the internal
demand. In Hungary, by contrast, the growth slackened due to
tight monetary and fiscal policies, while the Baltic States
continued their recovery.
Russian GDP continued to fall in 1996 (-2.8%) due to a drop in
both production and investments, even if some important
results were obtained on price stabilisation. On the contrary,
the other former Soviet Union Republics,
except Tajikistan
and Turkmenistan, registered positive growth rates. These
were particularly strong in Georgia, Armenia and Kyrgyz
Republic.
Trade in goods and commercial services
According to WTO estimates, the 1996
value of world
merchandise exports
(5.100 bn dollars) showed a +3.7%
increase compared to the previous year. This slowdown in the
growth rate (from nearly 20% in 1995) exceeded by a wide
margin the deceleration in volume terms, as dollar prices of
globally traded goods stagnated in 1996 after increasing by
10% in 1995. As a matter of fact, price increases for crude oil
and certain other primary products were offset by the changes
in the exchange rate of the US dollar vis-a-vis the currencies of
several major traders5. In 1995 the situation was exactly the
opposite with the dollar values “swollen up” due to the
American currency depreciation.
Trade in products which had benefited from exceptionally
4 It should be emphasised that output data for these countries may underestimate actual growth because they may
WORLD TRADE IN
GOODS AND
SERVICES
In 1996, world
exports of goods and
services grew by
+3.7% and 5%
respectively in value
tenris.
Commercial services
increased by 5%
reaching $US 1,200
billion.
World trade (goods
and services)
represented 21% of
the world GDP that
was estimated at
almost $US30,000
billion.
World trade
(goods+services)
went up by 5.6% in
volume tenns.
strong demand and/or price trends in 1995 - office and telecom
equipment, iron and steel, and non-ferrous metals - was
affected by price declines and weaker demand in 1996.
Consequently, the growth in the value of trade in these
products was less than 5% in 1996. In contrast, exports of
fuels increased by more than 10% in value terms - the biggest
annual gain in trade since 1990 (29%).
Also exports of commercial services slowed down
remarkably in 1996 (+5% growth rate compared to 14% in
1995) and reached the value of 1,200 bn dollars. This can be
attributed both to the effect of the dollar's appreciation against
a number of major currencies, and to the sluggish economic
activity in Western Europe6 which alone accounts for one-half
of the world's trade in commercial services.
Even if there is no perfect comparability, due to differences in
statistical methodologies, the global value of exports of goods
and commercial services amounted to 6,300 bn dollars. This
represented around 21% of the world GDP at market prices
(30,000 billion US dollars in 1996).
The IMF estimated the growth rate of world trade7 in volume
terms at +5.6%. As is evident from Figurel .2, the increase in
1996 was similar to the growth reported for the first four years
of the decade and below the levels recorded in 1994 and 1995
that were unusually high.
As a result, the large excess of trade growth over output
growth observed each year since 1990 was sharply reduced in
1996. This change can be attributed primarily to developments
in Asia, where trade growth (both exports and imports) fell
below GDP growth. While the gap between trade and GDP
growth also narrowed in other regions, trade growth (exports
and imports combined) remained at least twice as large as
GDP growth in North America, Latin America and Western
Europe.
Developments of merchandise trade in volume by region
WORLD TRADE IN
GOODS
The volume of world
merchandise exports
went up by +4% in
1996.
Remarkable
slowdown of Asian
trade (+2%).
In 1996, world merchandise exports increased by an
estimated +4% in volume terms8, slightly less than half the rate
recorded in 1995 (Table 1).
The surprising feature of the geographic breakdown of 1996
trade developments was the performance of Asia. Export
growth in 1996 (+2.5%) was not only below output growth, but
also the smallest among the regions. Asia's imports held up
somewhat better, matching the world average and exceeding
export growth by 2 percentage points. A partial explanation of
this performance could be the above-average importance of
office and telecom equipment in Asia's exports, which implies
that the “boom and bust” cycle of this product group had a
stronger impact in Asia than elsewhere. In addition, exchange
6 WTO grouping including the 15 EU member States, Iceland, Liechtenstein, Malta, Norway, Switzerland, Turkey, Bosnia, Croatia, Slovenia, FYROM and Serbia-Montenegro.
7 Goods and services.
8 WTO Secretariat's report on trade developments in 1996, (world includes intra-EU trade).
Industrial countries'
trade also registered
a more moderate
growth rate (+6.3%).
Intra-EU trade nearly
stagnated (+2%),
while EU exports to
third countries grew
above the average
(+5%).
Outstanding export
performance of Latin
American countries
(globally up by
+
11
%)
Imports of the
countries in transition
registered the most
dynamic growth
(+12%).
rate developments - in particular the stronger dollar - reduced
competitiveness of those countries which peg their currency to
the United States dollar.
The other reason for the important slowdown of world trade
growth in 1996 was the easing of the industrial countries’
imports
that together represented around two thirds of world
imports. This slowdown (from 7.7% in 1995, to 6.3% in 1996
according to OECD estimates) involved the main European
Union countries (except the UK), the USA and in particular
Japan and Canada. As the EU accounts for roughly 40% of
world merchandise trade, the impact on global trade was
marked.
After two years of strong growth9, intra-EU exports nearly
stagnated in 1996 (+2%), while exports to third countries rose
by +5%, a rate significantly faster than extra-EU imports
(+2.5%). Consequently, as in 1995, external demand helped to
sustain output in the EU during 1996.
The
outstanding export performance of Latin America
(nearly triple the world average) can be attributed largely to
Mexico, where export volume expanded by more than +20%
for the second year in a row. Excluding Mexico, Latin
America's exports expanded by +5% in both 1995 and 1996. In
contrast, Brazil's export volume has been stagnant in the last
two years.
Latin America's imports, which grew in volume terms by only
+3% in 1995 due to the sharp recessions in Mexico and
Argentina, recovered strongly in 1996 with an expansion of
+10.5%. Among the major traders, Argentina's and Mexico's
imports were up +17% and +24% respectively, with the result
that the steep fall in imports provoked by the recession in 1995
has been completely offset. A particularly strong deceleration
could be observed for Brazil where the volume of imports, after
expanding by more than one-quarter annually between 1993
and 1995, only increased by about +6% in 1996.
Exports of the transition economies,
which recorded the
strongest export growth of all the major regions in 1995 (up
+14.5%), decelerated sharply in 1996 to just under the global
average. Import growth, in contrast, reached +12% in 1996, the
highest level among the major regions.
Table 1 - GROWTH IN WORLD MERCHANDISE TRADE BY SELECTED
COUNTRIES/REGIONS
(Annual % change in volume)
EXPORTS
IMPORTS
1995
1996
1995
1996
WORLD
8.5
4.0
8.5
4.5
USA (a)
10.6
7.6
8.9
7.0
European Union (b)
7.3
4.0
5.6
2.5
Latin America
12.0
11.0
3.0
10.5
Transition Economies
14.5
13.5
11.5
12.0
Asia
9.5
2.5
14.0
4.5
Japan (a)
3.3
0.5
12.5
3.4
Six East Asian traders(c)
14.5
3.5
15.5
4.0
Source: W T O and (a) O E C D (b) Extra + Intra-Trade
(c) Hong Kong, South Korea, M alaysia, Singapore, Taiw an and Thailand
%
Fig. 1.2 - World GDP and trade (goods+services)
(annual % change in volume)
—-#— Trade GDP
[image:12.595.99.510.559.781.2]EUROPEAN UNION EXTERNAL TRADE IN GOODS
TRADE BALANCE
BY PARTNER
The merchandise
trade balance of the
EU registered a
remarkable surplus of
+43.4 bn ecu in 1996.
This is the third
positive result in a
row.
The EU-USA deficit
turned into a +1.8 bn
ecu surplus.
Remarkable
increases in the
surpluses with the
CEECs, the
Mediterranean
countries and the
NIEs.
The biggest deficits
were registered with
Japan and China (-17
and -15 bn ecu
respectively).
The EU trade balance, always in deficit since 1958 (except
for the 1986-7 small surpluses) turned into the black in 1994,
progressed further in 1995 and reached a remarkable figure of
+43.4 bn ecu in 1996. This last result was due to the
combination of a still buoyant export growth rate (+8.9%), and
of a slow rate of imports that went up by only +6.5%.
The EU’s trade balance with the group of countries made up of
the USA, Japan, Canada, EFTA and Australia-New Zealand
improved considerably in the last four years. The deficit was
reduced from the -35 bn ecu registered in 1993 to less than -
12 bn 1996.
This was mainly due to the turnaround of the EU-US balance
into a small surplus, thanks to the vitality of the American
economic climate and the appreciation of the dollar against the
ecu (+3%). Another reason was the constant reduction for the
fourth consecutive year of the huge trade deficit with Japan (to
-17 bn ecu), despite the deterioration of the EU competitive
position as the ecu appreciated by +11 % vis-a-vis the yen in
1996. On the other hand, the balance with the 3 EFTA
countries that was almost in equilibrium in 1995 registered a
small deficit of -2.2 bn ecu.
In 1996, the Union registered remarkable improvement in its
trade positions with the CEECs (the surplus almost doubled
from +8.8 to +16.4 bn ecu), the CIS (deficit down from -4.1 to
-1.6 bn ecu), the Mediterranean Basin (the surplus increased
by +3.5 bn compared to 1995), Latin America (improvement
of +3.3 bn) and the 4 NIEs (from +10.5 to +13.5 bn ecu
surplus).
The trade balances with ACP and OPEC countries
deteriorated due to the increase in the international oil and
other commodities prices reaching -3.4 and -3 bn ecu deficits
respectively.
Trade with China1 registered the second largest trade deficit in
absolute terms reaching -15.3 bn ecu (compared to -7.4 bn
ecu in 1993). However, in relative terms (i.e. as a percentage
of bilateral trade) the EU-China trade recorded the highest
deficit in 1996 (-34.3%), whereas Japan ranked in second
place (-19.1 %). [See fig. 2.1.]
EXPORTS BY
PARTNER
EU exports up by
+9% in value terms
and +5% in volume in
1996.
USA largest outlet
with 18.3% share.
Exports to CEECs
and CIS grew by
more than +19%.
Slowdown of EU
sales in Asia.
Dynamic momentum
of the exports to the
Mediterranean.
IMPORTS BY
PARTNER
After the slowdown in
1995, EU imports
increased by +6.5%
in value and around
+2.5% in volume in
1996.
USA first supplier with
almost 20% share.
Purchases from
China and ASEAN
countries expanded
at a double figure
rate.
Imports from oil
producer countries
went up by +15.5% in
value.
Dynamic momentum
of the ACP sales.
sales to Japan (stable at 5.7% share) registered a growth rate
slightly below the average (+8.2%).
Benefiting from the continuing structural strengthening of the
economy in the CEECs and the CIS, the value of exports to
these country groups expanded considerably, by more than
19%. This further increased the share in total EU exports to
10.2% for the CEECs, and 4% for the CIS.
After three years of extremely dynamic expansion, EU exports
to the Asian region slowed down, in particular to South Asia
(+4.7% growth rate) and China (+0.7%). However, since 1993
the Asian countries, with the exception of Japan, increased
their global share of the EU exports by +1.5%, going from
16.1% to 17.6%.
Exports to the Mediterranean Basin continued to grow even if
at a more moderate rate (+12.4%), resulting in an increase in
the share of these countries to 11.6% of total EU exports.
[See figs. 2.2 and 2.3.]
The value of EU purchases from the rest of the world
increased by +6.5% in 1996. This result was due to the +4%
increase in average import prices, while the quantity's growth
rate was only +2.5%.
Imports from Japan dropped by -3.3% in 1996. In the last four
years, a constant reduction in the Japanese share of EU
imports has occurred: it was 9.1% in 1996, compared to 12%
in 1993.
By contrast, the US sales to the EU markets increased well
above the average (+8.6%) after having stagnated in 1995.
This was probably due more to the effect of the dollar
appreciation (average import prices went up by +6.5%) than to
the slow economic recovery in Europe. As a result, the share
of US goods in total EU imports increased to 19.4%.
After the boom experienced in the last 3 years, imports from
the CEECs reduced their dynamism slightly below the average
(+6.1%), almost at the same rate registered by imports from
the CIS. However, as far as the former Soviet Union Republics
are concerned, the import slowdown had already begun in
1995. Nevertheless, their global share increased remarkably
in the last four years, reaching 12.7% in 1996.
Imports from Latin America (5.2% of the total) stagnated in
1996. Imports from South and Southeast Asia including
China (which alone represents 5.2% of the total EU
purchases) expanded at a double figure rate with the relevant
exception of the 4 Asian NIEs, whose sales to the European
Union, after the -3.5% drop in 1995, increased by only +4.7%.
Also worth noting is the sharp increase in the value of imports
from OPEC, due to the higher oil prices in dollars (+21% in
1996) and the stabilisation of the recovery in the imports from
the ACP countries which registered a growth rate well above
the average for the third year in a row. [See figs. 2.4 and 2.5.]
TRADE BALANCE
BYPRODUCT
For the third
consecutive year, the
manufactured
products surplus
(+150 bn ecu in 1996)
more than
compensated for the
primary products
deficit (-99 bn ecu).
The largest surpluses
were registered in the
transport equipment
and machinery
sectors.
EXPORTS BY
PRODUCT
Exports of
manufactured
products up by +10%
in 1996, representing
more than 86% of
total exports.
Machinery and
chemicals were the
most dynamic
sectors.
IMPORTS BY
PRODUCT
Machinery and
transport equipment
was the most
important sector with
32% share.
Imports of fuel
The European Union economy, based on the manufacturing
industry, has a structural deficit in the primary sector.
The
absolute value of the deficit slightly increased in the last four
years, reaching -98.7 bn ecu in 1996. However, the
exports/imports cover ratio was stable at 44% - a stabilisation
in relative terms.
This deficit was almost completely concentrated in the fuel
products sector (-64.2 bn ecu) followed by the agricultural
products sector (-17.3 bn ecu).
Between 1993 and 1996, the
surplus in manufactured
products more than doubled,
topping +149.5 bn ecu in
1996. This was due to the positive gaps between export and
import growth rates during this period, witnessed by the
increase of the cover ratio in value for the manufacturing
sector from 124% in 1993 to 138% in 1996.
The largest surplus was registered in the transport equipment
sector (+46.9 bn ecu followed by the machinery (mainly non
electrical machinery) and chemical sectors.
[See fig. 2.6.]
The European Union is a
traditional exporter of
manufactured
products
and this specialisation
has
increased over the last two decades. At the beginning of the
80’s, the share of manufactured products in total EU exports
was around 70%, while in 1996 this figure reached 86.3%.
The corresponding reduction in the share of raw materials was
mainly due to the declining importance of EU exports in fuel
products
(2.5% in 1996). Meanwhile, exports of agri-food
products were fairly stable at around 7-8%.
Among the primary products, in 1996 only the exports of fuel
products, boosted by the previously mentioned increase in
international oil prices, registered a growth rate above the
average (+15%). On the other hand, sales of non-agricultural
raw materials dropped by -10.3%.
As far as manufactured products are concerned, the most
dynamic sectors in 1996 were
machinery and chemical
sectors with +11.8% and +9.9% growth rates respectively.
Agricultural imports
registered slow
growth for the second
consecutive year.
from 1985 when raw materials prices fell, the share of
machinery and transport equipment began increasing and it
became the most important sector, globally reaching 32% in
1996.
Other manufactured products
also achieved a
remarkable increase to almost 27% in 1996.
After the slowdown registered in 1995, due to the slower pace
of economic activity in Europe, in 1996 the growth of imports
of
primary products
went up by +7.1% in value terms. This
increase took place in a context of rising commodity prices.
Indeed, world prices for non-oil commodities rose by +6%
while oil prices grew at a faster rate: on average, the import
price of oil for the EU increased by more than +21% in dollar
terms. The depreciation of the ecu against the dollar (by -3%
in average terms) also increased the import bill. As a
consequence the
imports of fuel products
increased by
almost 23% in value, expanding their share in the total imports
to 13.7%, quite close to the 1993 level.
Finally, after having stagnated in 1995, imports of
agricultural
products increased by a mere +2.6%.
Fig. 21 - Geographic breakdown of EU trade balances in 1996
%
1 c
O
O
S
Hi JO .IB€ 8 g UJ j
© C O ° z <
N
z
*co
O a>
E
< B+■*
+5
« CO
—
I
3
<<
LU
(0
<<
CD
3
(0
w
3 « < c
r- CO
I
o<2
€0
OLU
%
2 0
-Fig. 2 2 - EU exports in 1996
(% change over 1905)
16-12.
8t-*
4 .
0.
BctraBJ
1
1
CO < ■o
1-CO LL c LU CO o
¥
Q . O C
o LU OJ
2
Q_
Q.
^
O
O
COo CO
N
z
.2
1
4-*(0
3
<
(0
(0
0
CO
c .2
35 »-
<
O
<0 (0
LU '25
5 <
<
CO
3
Z
<
LU CO
<
CO
o
■Q (0
<D
CQ
o
LU LU
O
20
15.
%
Fig. 2 4 - RJ imports in 1996
(% change over 1995)
UJ
-O-Fig. 2.5 - Geographical breakdown of EU imports, 1996
4 NIEs of Asia 7%
Others 15%
Fig. 2.6 - EU : Trade balances in primary products
and manufactured products
Bn ecu
200
~L
I Primary products Manfactured products .Trade balance 150 -100
50
0
-50-100
■
I
I
-150
US EXTERNAL TRADE IN GOODS
TRADE BALANCE
BY PARTNER
The US trade
balance showed a
-153 bn ecu deficit
in 1996.
The largest deficit
was registered with
Japan (almost -40
bn ecu), China (-33
bn ecu) and Canada
(-21 bn ecu).
Deficit with the EU
increased by 5 bn
ecu compared to
1995.
Small surpluses
occurred with
Australia-New
Zealand and the
Mediterranean
countries.
After the slow-down of the previous year, in 1996 the US
economy grew by +2.4%. The good economic momentum,
together with the return to a stronger dollar - a trend begun in the
second quarter of 1996 - boosted the US imports.
Consequently, the huge
US trade deficit that slightly reduced in
1995 went up again in 1996, reaching -153.4 bn ecu. However,
due to the positive gap between exports and imports growth
rates, if measured in relative terms, the deficit decreased slightly
from -13.8% to -13.5% of total US trade.
The largest trade deficit was again registered with
Japan.
However, it was reduced substantially, by over 8 bn ecu, to less
than -40 bn ecu - the lowest level since 1992. On the contrary,
after a drop in 1995, the deficit with theEU increased in 1996 by
more than 5 bn, reaching -15.7 bn ecu.
The trade balance with the
four newly industrialised
economies of Asia continued to improve slightly, while the deficit
with
China,
the second largest, grew dramatically totalling -33.4
bn ecu. The export/import ratio with China plunged to 22 per cent,
which is by far the lowest of all major US ratios.
Trade with Asia
as a whole represented 70% of the 1996 US
deficit in spite of the remarkable improvement in the trade
balance with Japan.
Meanwhile, the US trade balances with
Canada
(the most
important trading partner) and with the
Latin American
countries continued to reduce in 1996, reaching -21.4 and -14.6
bn ecu deficit respectively.
Finally, the US registered small surpluses with only Australia-
New Zealand and with
the Mediterranean countries
(+6.3 and
+2.1 bn ecu respectively), while the trade balance with the Gulf
States was almost in equilibrium.
[See fig. 3.1.]
EXPORTS BY
PARTNER
US exports grew by
10% in 1996 in ecu
terms, compared to
a small 3.5% in
1995.
Canada (21%
share) and EU
(20.5%) were the
most important
export markets.
CIS, CEECs and
EFTA countries
were the most
dynamic outlets.
In 1996, the ecu value of US exports
showed a growth rate of
+10.1%, a remarkable increase after the slow-down registered in
1995. This performance is due to a combination of an increase in
volume (+7.6%) and in export prices, bolstered by the dollar
appreciation vis-a-vis the ecu (+3% on average in 1996).
The three most important outlets for US exports,
Canada, EU
and Japan,
registered growth rates below average and, as a
consequence, their shares were slightly reduced. Nevertheless,
these partners still represent 52.6% of the global value of US
sales to third markets.
By contrast, impressive growth rates were recorded in exports to
the
CIS, CEECs and EFTA countries.
However, their double
figure growth rates (+37%, +23.5%, +35.6% respectively) should
be connected with the still limited value of the exports to these
countries, that in 1996 globally represented less than 3% of the
total.
Sales to Latin
America reached a
remarkable 16.6%
share.
IMPORTS BY
PARTNER
Imports growth rate
+9% in 1996 (only
+1.7% in 1995).
Imports from EU
(the second supplier
after Canada) went
up b y +11% in 1996.
Imports from Japan
dropped for the
second consecutive
year.
Latin America and
OPEC sales grew
more than 20%
compared to 1995.
TRADE BALANCE
BYPRODUCT
Manufactured
products accounted
for 75% of the global
US deficit in 1996.
The deficit was
concentrated in the
automobile, textile
and computers
sectors.
Surpluses only in the
chemical and
agricultural products.
With the relevant exception of ASEAN, exports to the
Asian
countries
(including China) slowed down compared to the
remarkable performances of 1995.
On the contrary, sales to Latin
American countries,
after the
6%
drop registered during the
Mexican crisis of
1995,
grew by almost
18%,
increasing these
countries’ share to
16.6% of the total.
[See figs. 3.2 and 3.3.]
The value in ecu of
US imports
grew by
+9.3%
in
1996, 7.5
points more than the previous year. This must to a large extent be
attributed to the rise in the quantities imported (+7%).
After having stagnated in
1995,
the US imports from
EU
countries
went up by
+11%
in
1996.
This result reversed the
declining trend of the EU market share in the USA which
represented
18%
of the total (the second supplier after Canada
with
19.5%).
On the contrary, imports from Japan
went down
(-4.4%)
for the
second consecutive year and the Japanese share of the US
imports dropped by 4 percentage points compared to
1993, falling
to 14.4%.
The Asian countries
(except the NIEs) registered quite dynamic
growth rates in their exports to the American market. In particular
supplies from
China
went up by
+15.4%
in
1996
increasing this
country’s import share to 6.6% (5.6% in
1993).
In
1996, Latin American
sales to the United States
(60%
of
which came from Mexico) confirmed their strong momentum
which began in
1994,
recording a growth rate of more than
+20%.
In the last four years, the share of these countries in the total US
imports increased from
12.3% in
1993 to almost 15% in
1996.
Imports from
OPEC countries,
pushed by the rise in the
international oil prices, also increased by more than 21%.
However, the oil producers’ share of the American market was
still limited to a marginal 5.7%. [See figs. 3.4 and 3.5.]
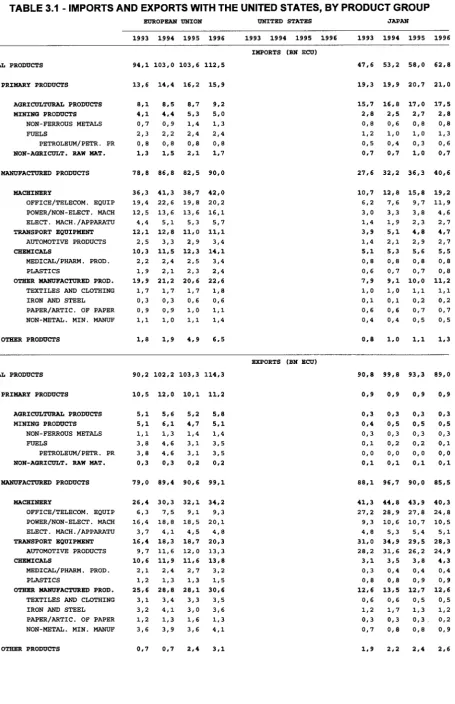
The
product breakdown of the US trade balance
shows a
completely different picture as compared to the European Union.
As a matter of fact, in the primary sector - excluding the huge
fuel products deficit
(-51
bn ecu in
1996)
- agricultural products
and other raw materials are structurally in surplus (globally +20
bn ecu).
On the other hand, the bulk of the deficit is concentrated in
the
manufacturing
sector
(-114.5
bn
ecu).
Among
In the early 80’s the
structure of the US exports
was
characterised by a large share of raw materials (30% of the total).
In the last 15 years, however, a big shift occurred which made the
US export structure more similar to the European Union structure.
In 1996 the
primary products
represented only 17.2% of total
exports. These losses were distributed in all sectors even if the
recent increase in oil prices has boosted US exports of fuels
products
(+20% growth rate). Nevertheless their global value
was relatively small, covering only 2% of the total.
As far as
manufactured products
are concerned (79% of the
total in 1996); a partial shuffling in the relative weight of the
different sectors occurred. The
machinery sector
(in particular
office equipment and electrical machinery) increased its global
share by more than 3 percentage points since 1993. On the
contrary the
transport equipment sector,
despite the +14%
growth rate registered in 1996, lost 2.5 percentage points during
the same period.
Among
other manufactured products
(stable at 19% share), it
is interesting to note a 7% fall in the exports of iron and steel
(especially after the boom experienced in 1995) and the
remarkable increase in textile and clothing
sales (+14% growth
rate).
EXPORTS BY
PRODUCT
US exports were
concentrated in the
manufacturing
sectors (80% of the
total).
Good performance
of the US
manufactured
exports in 1996
(+11%), while the
primary products
sales slowed down
to a +5% rate from
+10.4% registered in
1995.
IMPORTS BY
PRODUCT
Primary products still
represented 19% of
the US total imports
in 1996.
Imports of primary
products up by
+16% compared to
1995.
Manufactured
products grew by
+7.5% only.
The structure of US imports also reflects the growing role of the
manufacturing sectors. Whereas, at the beginning of the 80’s, the
purchases of fuel products still represented one third of the total
value, a decade later their share had shrunk to 10% and than
stabilized in the most recent years at around 8-9%. This was
mainly due to the slump in energy prices and to the growing role
of intra-industry flows in international trade.
However, in 1996, the already mentioned rise in the oil prices
increased the import bill for these products by +27%. This factor,
together with the recovery in the US purchases of
agricultural
products
(+14.2% growth rate) more than compensated for the
dramatic fall (-22.5%) of non agricultural raw material imports. As
a result the
global share of the primary products
in the total
US imports went up by more than one percentage point
compared to 1995, reaching 18.8%.
The recent trends in the
manufacturing sectors
confirmed the
growing importance of the intra-industry trade.
Despite the 1996 slow-down, the share of the office equipment
went up by almost three percentage points in the last four years,
while the
transport equipment share
dropped by -1.3% in the
same period.
Fig. 3.2 - US exports growth rate in 1996
(% change over 1995)
Fig. 3.3 - Geographic breakdown of US exports in 1996
Others
OPEC
8%
Canada
Lat. Amer.
17%
25
20
.%
Fig. 3.4 - US imports growth rate in 1996
(% change over 1995)
(0
o
Fig. 3.5 - Geographic breakdown of US imports in 1996
Fig. 3.6 - U S : Trade balances in primary products and manufactured goods
1992 1993 1994 1995 1996