This is a repository copy of
Current and emerging imaging techniques in the diagnosis and
assessment of pulmonary hypertension
.
White Rose Research Online URL for this paper:
http://eprints.whiterose.ac.uk/135226/
Version: Accepted Version
Article:
Johns, C.S. orcid.org/0000-0003-3724-0430, Wild, J.M. orcid.org/0000-0002-7246-8660,
Rajaram, S. et al. (2 more authors) (2018) Current and emerging imaging techniques in
the diagnosis and assessment of pulmonary hypertension. Expert Review of Respiratory
Medicine, 12 (2). pp. 145-160. ISSN 1747-6348
https://doi.org/10.1080/17476348.2018.1420478
eprints@whiterose.ac.uk https://eprints.whiterose.ac.uk/
Reuse
Items deposited in White Rose Research Online are protected by copyright, with all rights reserved unless indicated otherwise. They may be downloaded and/or printed for private study, or other acts as permitted by national copyright laws. The publisher or other rights holders may allow further reproduction and re-use of the full text version. This is indicated by the licence information on the White Rose Research Online record for the item.
Takedown
If you consider content in White Rose Research Online to be in breach of UK law, please notify us by
Abstract
Introduction
Pulmonary hypertension (PH) is a challenging condition to diagnose and treat. There have been many advances in therapies over the last 2 decades,, along with a rapid development of imaging technologies. The increasing availability of non-invasive imaging gives physicians an unrivalled opportunity to improve diagnostic rates and accurately phenotype patients.
Areas covered
This review discusses the role of imaging in the diagnosis, prognostic assessment and follow-up of patients with PH. Imaging methods, ranging from readily available investigations (chest radiography, echocardiography, nuclear medicine and cross-sectional C (CT), to emerging modalities (magnetic resonance imaging (MRI) and positron emission tomography (PET)) are reviewed. The value and limitations of these clinical application of these imaging modalities and their the evidence for clinicalapplication isreviewed.
Expert commentary
Introduction
Pulmonary hypertension (PH) is defined at right heart catheterisation as a mean pulmonary arterial pressure (mPAP) ≥25mmHg [1]. It ranges from often mild elevations of pulmonary artery pressure, frequently seen in the context of cardiac and respiratory disease, to severe elevations of pressure in patients with an underlying pulmonary arterial vasculopathy [2]. Regardless of its aetiology, it has a negative impact on both symptoms and survival. The current classification identifies 5 groups with similar clinical and pathological characteristics; Group 1: Pulmonary arterial hypertension (PAH), Group 2: Pulmonary hypertension due to left heart disease (PH-LHD), Group 3: Pulmonary hypertension due to lung disease and/or hypoxia (PH-lung),Group 4: Chronic thrombo-embolic pulmonary hypertension (CTEPH), and Group 5: Pulmonary hypertension with unclear/multifactorial mechanisms [3]. Key aspects of the management of pulmonary hypertension include establishing the diagnosis of pulmonary hypertension, identifying the form of pulmonary hypertension (which defines the optimal treatment strategy) and the follow-up of patients.
The diagnosis of pulmonary hypertension is usually suggested by an echocardiogram performed in the breathless patient [2], although increasingly the diagnosis is suggested following other imaging investigations, in particular computerised tomography (CT) [3]. Once a diagnosis of pulmonary hypertension is suspected it is important to identify the cause as this defines the optimal treatment strategy [3]. Conditions for which therapies directed at the pulmonary vasculature have been proven to be effective are uncommon (such as PAH and CTEPH). Other forms of pulmonary hypertension, such as PH-LHD and PH-Lung disease, are much more common, but currently for these forms of
pulmonary hypertension, treatment is aimed at the underlying disease not the pulmonary vasculature. Diagnostic strategies including confirming the diagnosis of pulmonary hypertension with cardiac catheterisation and the approach to imaging is therefore dependent on the physician ensuring that further investigation is in the best interests of the patient. An important part of this strategy is an appreciation of factors that increase the pre-test probability of identifying forms of PH likely to benefit from therapy. Features from the history are important; a previous history of thromboembolic disease raises the probability of CTEPH. Alternatively, features known to increase the likelihood of PAH such as the presence of an underlying connective tissue disease (e.g. systemic sclerosis, with a prevalence of PAH 9% [4]), portal hypertension (prevalence of PAH 2-6% [4]), HIV (prevalence of PAH 0.5% [4]) should also be sought. In contrast, mild elevation of pulmonary artery pressures, in the context of severe respiratory or cardiac disease, may not require further investigation where there are no red flag features such as, severe elevation of pulmonary artery pressures or severe impairment of right ventricular function.
1
Imaging the cardiopulmonary circulation
1
Chest Radiograph
The chest radiograph is well established as a first line imaging technique for assessment of patients with known or suspected lung disease, providing a general overview of
the lungs and pulmonary vasculature. It is helpful in providing a guide to further investigation in patients with unexplained breathlessness, but is insensitive for the
detection of pulmonary hypertension, particularly, where pulmonary artery pressure elevation is modest. It provides limited information on potential causes of pulmonary
hypertension, but may identify the presence of significant lung disease such as emphysema, pulmonary fibrosis or characteristic changes of sarcoidosis. It is has the
advantage that is widely available, utilises minimal doses of radiation and is easily interpreted by medical practitioners. Typical findings in pulmonary hypertension include
dilatation of the pulmonary arteries, right atrial and right ventricular enlargement, although the later are features of severe disease. In a historical study of patients with
Idiopathic PAH, an abnormality on CXR or electrocardiography (ECG) was found in 90% of patients [4], however, this represents a highly selected population of patients with
severe disease and the accuracy of CXR in an unselected population of patients with suspected pulmonary hypertension has not yet been studied.
2
Echocardiography
Echocardiography is widely available and is usually the first non-invasive imaging investigation to suggest a diagnosis of pulmonary hypertension [3]. Echocardiography has the advantage of high temporal resolution with direct visualisation of cardiac motion, allowing assessment of right and left ventricular function and estimation of
pulmonary artery pressure, whilst also being portable and easily performed at the bedside. Systolic pulmonary artery pressure can be measured using Doppler
echocardiography; The peak tricuspid regurgitant jet velocity (v), measured from Doppler echocardiography, is used to calculate the tricuspid gradient (TG) (pressure
difference between right ventricle and right atrium) using the modified Bernoulli equation, TG=4v2 . This is then added to an estimate of right atrial pressure to estimate
right ventricular systolic pressure, which should be equivalent to systolic pulmonary artery pressure in the absence of pulmonary valvular disease. Right atrial pressure is
estimated as either 5, 10 or 15mmHg based on the diameter and respiratory variation of the inferior vena cava [10]. Whilst several studies have identified a strong
correlation of echo derived sPAP and right heart catheter measured mPAP in cardiac disease [11,12] the diagnostic utility of echocardiography derived pulmonary artery
pressure is less accurate in pulmonary hypertension seen in the setting of respiratory disease. A prospective study of unselected patients with PH, identified the
performed in the presence of tricuspid regurgitation and where this is absent, mean pulmonary artery pressure can also be estimated using systolic time intervals such as
pulmonary acceleration time [14,15].
Echocardiography also allows an assessment of cardiac valves and may identify congenital heart defects. The morphological characteristics of chronic right ventricular
pressure overload described using echocardiography include flattening of the inter-ventricular septum (IVS), increased thickness of the right ventricular free wall and
increased left ventricular eccentricity. In addition, tissue Doppler is helpful in the assessment of diastolic function [16]. Injections of agitated saline (bubble echo) can be
used to look for right to left shunting and whether this occurs at an intracardiac or pulmonary level [17,18]. Transoesophageal echocardiography is particularly helpful in the
assessment of suspected intracardiac defects such as atrial septal defects which are often not well visualised on transthoracic echocardiography [19].
3
Radionuclide Imaging
Ventilation/perfusion single photon emission tomography (V/Q SPECT) is currently recommended by the European Society of Cardiology (ESC) as the first line screening test
for chronic thromboembolic pulmonary hypertension (CTEPH) [18]. The perfusion image entails injection of 100MBq of 99mTc labelled macroaggregated human albumin,
exposing the patient to ionising radiation with an effective dose of approximately 0.017mSv/MBq [20]. The macro-aggregated albumin is trapped within the small
pulmonary arterioles, and a 3D reconstructed image of the perfusion of the lungs is acquired over around 10 minutes. In CTEPH, characteristic wedge shaped perfusion
defects, mismatched to ventilation can be demonstrated. The advantage of this technique over CT is that image interpretation is relatively straightforward and a normal
scan excludes the diagnosis of CTEPH. In contrast, the absence of perfusion due to attenuated vessels and the presence of endo-luminal chronic thromboembolic disease
may not be appreciated on CT by less experienced observers. Initial studies demonstrated that scintigraphy was significantly more sensitive than CT although more recent
studies have demonstrated that in expert hands that CT and 3D MR perfusion techniques are equally sensitive when compared with scintigraphy [21 23]. In addition,
imaging of systemic vascular beds (kidneys or brain) can be used to quantify the size of a right to left shunt and can be considered in a patient with unexplained hypoxaemia
and pulmonary hypertension [19].
4
Computed Tomography Pulmonary Angiography (CTPA)
pulmonary angiogram (CTPA) is increasingly performed: a bolus of iodinated contrast is administered typically into the antecubital vein and the scan is acquired ideally at
the point of optimal opacification of the pulmonary arteries. CTPA provides information on the pulmonary vasculature and the size of cardiac chambers, and aids
identification of the form of pulmonary hypertension. In patients with PAH there are characteristic CT findings, which reflect the severity of pulmonary hypertension [23]. In
a large cohort of patients with pulmonary arterial hypertension a systematic assessment of vascular, cardiac, parenchymal and mediastinal features demonstrated
characteristic features of various forms of pulmonary arterial hypertension and also identified important prognostic markers [31].
A well-established feature of pulmonary hypertension is an increased diameter of the pulmonary artery (PA). A number of thresholds have been used to identify the
presence or absence of pulmonary hypertension. In one study, a transverse PA diameter of >29 mm on CT was shown to have a high positive predictive value (97%) for PH
[32] whereas another study used a value of 33 mm [33], and a pulmonary artery with a larger diameter than the adjacent ascending aorta (pulmonary artery-aorta ratio >1)
has also been shown to be predictive of PH [32]. In patients where there is a high prevalence of pulmonary hypertension, such as systemic sclerosis, interrogation of the CT
can be helpful where an enlarged PA may be the first indicator of the presence of pulmonary hypertension. Dilatation of the PA in this setting, in particular a pulmonary to
aortic ratio of >1.0, can be highly predictive [34,35]. CTPA is particularly useful in CTEPH, where the distribution of vascular webs, stenosis and mural thrombus allows for
treatment planning and assessment of suitability for pulmonary endarterectomy. Serpiginous vessels within the pulmonary parenchyma are seen in severe pulmonary
hype E but may also be seen in idiopathic PAH, and are likely to represent neovascularity [28].
Pulmonary hypertension causes remodelling and eventual failure of the right ventricle. Whilst this is visible on CTPA, it is rarely seen in the early stages of disease. CTPA
evidence of right ventricular compromise includes dilatation of the right heart chambers, right ventricular hypertrophy (defined as wall thickness of more than 4 mm) and
bulging of the interventricular septum towards the left ventricle [40]. Changes of right ventricular hypertrophy are often best appreciated in the right ventricular outflow
tract, likely reflecting the reduced quantity of trabeculation. Reflux of contrast into the inferior vena cava and hepatic veins on contrast enhanced CT has been considered
to be a marker of the severity of tricuspid regurgitation, commonly seen in pulmonary hypertension [41], often in PH-LHD, although in the authors experience, it correlates
poorly with the severity of pulmonary hypertension. In severe pre-capillary pulmonary hypertension such as PAH, CTEPH and PH associated with respiratory disease (where
there is severe pulmonary hypertension) the left ventricle is under filled and compressed by the dilated RV, causing a small volume left atrium and ventricle. There may also
be features of cardiac decompensation also visible on CT, such as pleural and pericardial effusions, and an increase in inferior vena caval size, all of which are associated
with a poor prognosis [31].
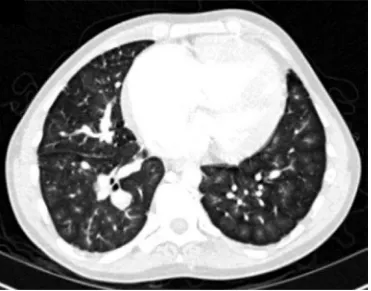
Pulmonary parenchymal changes may help to identify the cause of pulmonary hypertension. In patients with pulmonary hypertension due to lung disease, CT can identify
the underlying lung disease and monitor changes in severity. Patients with IPAH often have centrilobular ground glass opacities [42] (as shown in figure 2), which have also
[43]. Patients with CTEPH often have regions of sub-pleural scarring from infarction and a mosaic pattern of lung attenuation due to perfusion heterogeneity. Although not
in routine clinical use, more specialised methodologies in CT such as ECG gating [44] and dual energy CT for perfusion imaging have been implemented as research tools in
pulmonary hypertension [45 47].
5
Magnetic Resonance Imaging
MRI is considered the gold standard for functional and morphological assessment of the heart. Standard sequences implemented in pulmonary hypertension include two
and four chamber cardiac cine steady state free precession imaging (SSFP), black blood imaging (dual inversion recovery fast spin echo), contrast enhanced MR angiography
and 3D dynamic contrast enhanced MR imaging. Cardiac MRI can be used to diagnose pulmonary hypertension [55,56], assess prognosis and increasingly its utility in
follow-up of patients is being assessed.
Cardiac Cine MR Imaging
Retrospectively ECG gated cardiac cine imaging in the two and four chamber views allow for qualitative and quantitative assessment of the structure and function of the
ventricles [57]. Segmentation of the ventricular endocardium quantifies the right and left ventricular end-diastolic and end-systolic volumes from which stroke volume and
ejection fraction can be calculated. Baseline RV end-diastolic volume and RV ejection fraction and the change in RV ejection fraction over time are both predictive of
outcome [58,59]. RV stroke volume measured using cine imaging is less reproducible due to inaccuracies in contouring the ventricles, although new software allowing for
thresholding of trabeculation may improve reproducibility. In addition, due to the variable nature of tricuspid regurgitation, RV stroke volume measured by volumetry is a
poor reflector of forward pulmonary arterial flow .
The myocardium of the left and right ventricles can be segmented, giving right and left ventricular mass. The ratio of these is the ventricular mass index (VMI = RV mass / LV
In health, left ventricular pressure is significantly greater than the right ventricular pressure, giving a characteristic circular shape to the left ventricle, and a
crescentic shape to the right ventricle on short axis views. The angle of the inter-ventricular septum can be measured, it is increased (deviating towards the LV)
in patients with pulmonary hypertension [63]. This has been shown to correlate with pulmonary artery pressure although in the presence of left heart disease
septal angle measurements are less accurate due to the confounding effect of elevated left ventricular diastolic pressures.
Functional Imaging of the Pulmonary Artery
Black blood imaging is used to provide a morphological assessment of the pulmonary arteries and aorta. In health, there is high contrast between the flowing blood in the
pulmonary arteries (black) and the pulmonary artery wall (high signal/white). A reduction in blood velocity and turbulent flow results in high signal within the pulmonary
arteries, a strongly diagnostic and prognostic feature of PH, described as black blood flow artefact.
Phase contrast MRI is a technique that allows for quantification of blood flow. Pulmonary arterial flow, velocity and area change can be calculated and have been shown to
have clinical value in the assessment of patients with PH.
Detailed analysis of flow can be obtained using 4D phase contrast flow imaging, in which time resolved 3D datasets of flow are acquired. This can be
retrospectively interrogated to analyse flow in multiple regions of interest in the heart or pulmonary vasculature. In pulmonary hypertension, vortices can be
seen within the pulmonary artery [64], and the duration of these vortices have been shown to be predictive of the presence of PH [65,66]. Further research
examining the clinical utility of 4D flow MRI is warranted.
Contrast Enhanced Angiography and Perfusion Imaging
High spatial resolution 3D images of the pulmonary arteries (contrast enhanced MR Angiogram) can be acquired with the injection of intravenous T1 shortening agents.
Typically, a bolus of gadolinium is administered into a large proximal vein (normally in the antecubital fossa) followed by acquisition of a T1 weighted 3D gradient echo
dataset, after a delay that has been assessed by a test bolus. This produces high resolution images of the pulmonary vasculature, with good arterial and venous separation,
which can be useful in the identification of proximal thrombus [67].
Time resolved Imaging of contrast provides high-resolution angiographic assessment of the pulmonary circulation haemodynamics. These are also particularly useful to
imaged, with a frame rate of around 0.5s. This data is often presented as the peak signal for each voxel
a peak perfusion image [22]. This is particularly useful in the assessment of CTEPH and has been shown to be of equivalent sensitivity to perfusion SPECT imaging [21].
Dynamic contrast enhanced MRI can also be quantified
[68 71]
, potentially allowing for easier longitudinal follow up of perfusion abnormalities in pulmonary hypertension[60]
Magnetic resonance imaging tissue characterisation
Late gadolinium imaging is in common usage in the assessment of patients with myocardial infarction, to assess for myocardial scar tissue [72]. The technique utilizes a
T1-weighted inversion recovery sequence performed 10 to 15 minutes after injection of gadolinium (a T1 shortening agent). Normal myocytes enhance early, but wash-out as
they do not trap gadolinium, whereas abnormal tissues, such as fibrosis, trap the gadolinium and remain enhanced on delayed imaging [72]. In patients with pulmonary
hypertension, late gadolinium enhancement is seen in the right ventricular insertion points and in the interventricular septum [73], it is thought that these areas are
exposed to mechanical stress. The extent of right ventricular insertion point and interventricular septal late gadolinium enhancement has been shown to correlate with
right ventricular function [74].
A similar pattern of disease can be seen on native T1 mapping (i.e. non contrast enhanced T1 values), with high native T1 values in the RV insertion points [75], which
correlates with right ventricular dysfunction [76]. This allows the potential to characterise myocardial tissue, without the use of contrast media and potentially providing a
method for the identification of patients at risk of adverse right ventricular remodelling and right ventricular failure.
6
Digital Subtraction Pulmonary Angiography
Digital subtraction angiography (DSA) of the pulmonary artery is an invasive test, in which iodinated contrast is administered through a catheter in the pulmonary artery
under fluoroscopic visualisation. DSA is used in many centres in patients with chronic thromboembolic disease to guide surgical intervention [77] and is currently
recommended in the ESC guidelines as a final step in the surgical assessment of CTEPH. The advent of CTPA and MR angiographic techniques provide an alternative
non-invasive approach to assess suitability for pulmonary endarterectomy. More recently, the authors have demonstrated that in a large population of patients with suspected
CTEPH that a first line imaging approach using nuclear medicine imaging, CTPA, 3D perfusion MR and MR angiography can be successfully used to identify patients with
7
Positron Emission Tomography
Fluorodeoxyglucose (FDG) is a glucose analogue, which is typically bound to 18-Fluorine, a positron emitter. 3D images of the uptake of FDG can be produced using a PET
scanner (positron emission tomography), which allows for qualitative and quantitative assessment of tissue glucose uptake and therefore, an assessment of metabolic
activity. As the spatial resolution of PET scanning is relatively low, the scan is performed at the same time as CT, for anatomical location. In IPAH, there is significantly
increased FDG uptake within the right ventricle and heterogenous uptake within the lung parenchyma [74 76]. In a few centres the availability of PET-MRI scanners allows
Clinical applications of imaging in pulmonary hypertension
Making the diagnosis of pulmonary hypertension
There are many causes of pulmonary hypertension. The identification of the cause is key in defining treatment: patients with PAH benefit from drug therapy, whilst patients
with CTEPH can be potentially cured by pulmonary endarterectomy. The diagnosis may be suggested incidentally by an imaging investigation performed for unexplained
breathlessness, such as large central pulmonary arteries on chest radiograph or CT. The diagnostic approach for patients was highlighted in recent ERS/ESC guideline [3],
however, the approach is dependent in part on local availability of imaging and expertise.
In the authors own institution, which is a tertiary PH referral centre for pulmonary hypertension, a multimodality approach is used
combining radionuclide imaging, CT, MRI and cardiac catheterisation. As many patients travel long distances for their investigations, a
single step approach is taken to reduce the requirement for repeat visits. In other centres, a step-wise approach may negate the need
for some of the diagnostic tests.
Prognostic evaluation of patients with pulmonary hypertension
The assessment of prognosis is important in planning treatment, in particular when considering interventions such as initiation of parenteral prostanoid therapy and
triggering referral for transplantation. Accurate assessment of prognosis allows for adequate counselling of patients. This assessment is usually based on an assessment of
clinical status, exercise capacity and right ventricular function. A wealth of prognostic information can be gained from the clinical status of the patient, and World Health
Organisation (WHO) functional class is a useful tool in this regard. A historical study showed that patients with WHO functional class IV had median survival of 6 months,
class III had a median survival of 2.5 years and class I and II had a median survival of 6 years [89]. Older age, male sex and poor exercise capacity are associated with a worse
prognosis and the cause of pulmonary hypertension also impacts on outcome [90 95].Right ventricular function may be measured in different ways. Serum levels of
NT-proBNP are linked to right ventricular dysfunction, and have been shown to have prognostic value in PAH [94]. On echocardiography, right ventricular function and disease
severity can be assessed using tricuspid annular plane systolic excursion (TAPSE) [96], the RV Doppler index [97,98], interventricular septal displacement [99] and with the
right atrial area index [99], all of which predict outcome. At right heart catheterisation, a number of measurements can be used to assess prognosis including right atrial
Cardiac MRI is also a useful tool in the assessment of prognosis. Multiple studies have identified that stroke volume, RVEF, LV and RV end diastolic volumes are associated
with outcome [101,102], particularly when adjusted for age and sex [103]. The strength of RVEF as a predictor of outcome in PAH was highlighted in a recently published
systematic review [104]. More recently, a larger study of 576 patients from our centre showed that right ventricular end systolic volume (indexed for age and sex) and
pulmonary arterial relative area change were independent predictors of mortality, providing added prognostic value to patient age, sex, subgroup diagnosis and WHO
functional class [55]. The presence of a pericardial effusion on echocardiography, CT or cardiac MRI is also associated with a poor prognosis [99], and other features of
cardiac decompensation such as pleural effusions and ascites are predictive of a poor outcome.
The challenge facing clinicians is how to incorporate large amounts of data from various imaging modalities and how best to integrate these with other data from the clinic
to aid treatment decisions in a way that is meaningful and beneficial to patients.
Follow-up of patients with pulmonary hypertension
A number of parameters are used to assess patients progress including WHO functional class [94], exercise testing measured using field walking tests such as the 6MWT
[105,106] and incremental shuttle walking test [107] and widely available blood test such as N-terminal BNP [108,109]. There has been some concern regarding the ability
of the 6MWT to reflect changes in pulmonary vascular status and this has led to a drive to explore other markers that are more likely to be sensitive to change.
Consequently, there has been a lot of recent interest in cardiac MRI as a highly reproducible, non-invasive, non-ionising tool to assess right ventricular function. Van de
Veerdonk and colleagues, showed that cardiac MRI is sensitive to change, with right ventricular volume changes preceding clinical deterioration in apparently clinically
stable patients with idiopathic pulmonary arterial hypertension [110]. The same group also showed that changes in stroke volume were a marker of clinical improvement in
patients after 1 year of treatment [111]. Further to this, measures of right ventricular function on cardiac MRI have been shown to be highly reproducible [55].
In our centre, we use a multi-modality approach to follow up based on clinical assessment, exercise testing and cardiac MRI to assess response to treatment. Cardiac MRI is not readily available in all centres, so the choice of follow up modality is also based on real life local availability of tests. Echocardiography is an alternative for follow up, able to objectively quantify right ventricular function using TAPSE, right ventricular tissue Doppler and right ventricular free wall strain, although there are concerns
Conclusion
Imaging plays a key role in the diagnosis of pulmonary hypertension and is increasingly used in the follow-up and monitoring of patients. The last 2 decades have seen
significant advances in imaging techniques and a move towards the use of multiple imaging modalities in the assessment of patients with pulmonary hypertension. Despite
this, many of the recommendations on the use of imaging approaches are based on expert opinion and studies include relatively small numbers of patients. There is no
doubt that given the heterogeneity of pulmonary hypertension that large studies and a move towards standardisation of imaging protocols and international collaboration
is required if we are to realise the potential of imaging in pulmonary hypertension. Larger datasets allow for analysis with approaches such as machine learning not only of
measurements derived from image analysis, but also inputting the raw images themselves [88]. Using empirical linear regression models [35], or more physiologically linked
models [89] may also aid the diagnosis of pulmonary hypertension and refine our approaches to assessment of disease progression and combining imaging metrics with
medicine and tailored therapy. Large multi-centre studies examining different diagnostic approaches to the investigation of
pulmonary hypertension are lacking and there is only limited data on the cost effectiveness of different approaches to both diagnose and follow-up. Importantly, however,
there are a number of ambitious imaging studies on the horizon, and it is important that the pulmonary hypertension community embraces initiatives such as CHANGE-MRI,
Key Points
1. Imaging is key in the assessment of patients with suspected pulmonary hypertension.
2. Imaging characteristics can provide important information on the cause of pulmonary hypertension.
3. Non-invasive methodologies such as cardiac MRI and CT can provide useful prognostic information.
4. Cardiac MRI is sensitive to change and reproducible, making it ideal for follow up.
5. Large studies are required to assess the role of non-invasive imaging modalities.
Figures
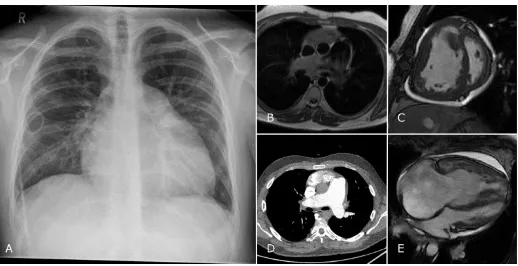
Figure 1: A series of images from a patient with chronic thrombo-embolic pulmonary hypertension (CTEPH). The top row shows a series of images from a CTPA showing
mural thrombus (A and C), a dilated, hypertrophied right ventricle (B) and mosaic pattern of perfusion (D). The bottom row shows a selection of images from the cardiac
MRI study with slow flow artefact on black blood imaging (E), dilated, hypertrophied right ventricle on short axis cine images (G), attenuation of vessels on the contrast
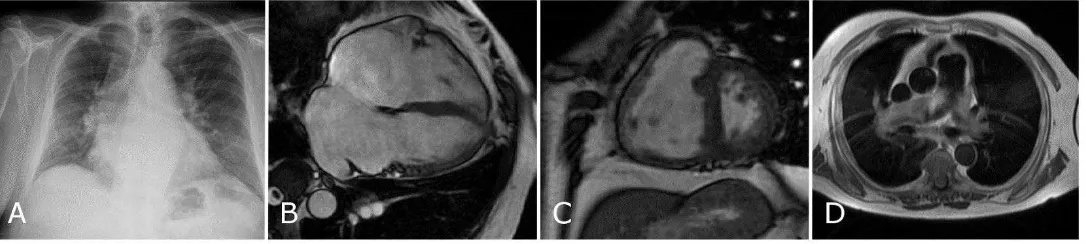
Figure 3: A chest radiograph from a patient with pulmonary hypertension due to left heart disease with combined pre and post capillary disease (A) showing moderate
cardiomegaly and upper lobe venous distension. The subsequent MRI shows bi-atrial dilatation (B), flattening of the interventricular septum (C) and slow flow black blood
Figure 5: Images from a patient with IPAH. The chest radiograph shows cardiomegaly with dilatation of the pulmonary artery, the patient has a PICC for intravenous delivery
of iloprost. Black blood imaging (B) and CTPA (D) confirm the dilated pulmonary artery. Further features of pulmonary hypertension are shown with slow flow artefact on
black blood (B), flattening of the interventricular septum (C) and dilatation of the right sided chambers (C and D). Note is also made of poor filling of the left sided chambers
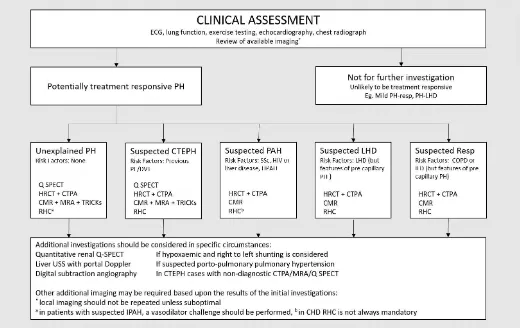
1. PAH 2. Left Heart Disease 3. Lung Disease 4. CTEPH 5. Misc
RHC PAP PAP PAP PAP PAP
PAWP PAWP PAWP PAWP PAWP
CO CO CO CO CO
‘A ‘A ‘A ‘A ‘A
CT PA PA PA PA PA
‘V ‘V ‘V ‘V ‘V
LV LA LA
Flattened IVS Parenchymal lung disease Chronic emboli: webs, CT evidence of disease Centrilobular nodules Pleural or pericardial effusions eg. Emphysema or fibrosis stenoses, mural thrombus eg sarcoidosis
Neovascularity Mosaic perfusion
CMRI PA PA PA PA PA
‘V ‘V ‘V ‘V ‘V
LV LA LV LA
Flattened IVS Septum only flattened in Cpc-PH Flattened IVS
Pleural/Pericardial Effusions Chronic emboli on MRA V/Q
SPECT No segmental defects No segmental defects No segmental defects Segmental perfusion defects No segmental defects
Renal uptake in R-L shunt
Abnormal due to lung
disease
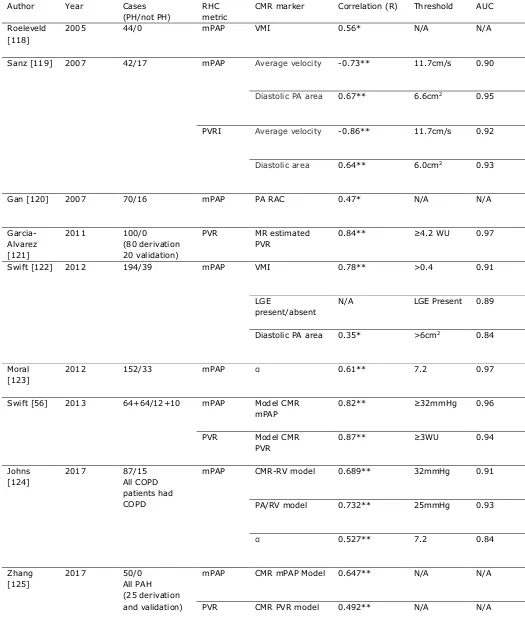
Table 2: Diagnostic accuracy for cardiac MRI metrics to predict the presence of PH.
Author Year Cases
(PH/not PH)
RHC metric
CMR marker Correlation (R) Threshold AUC
Roeleveld [118]
2005 44/0 mPAP VMI 0.56* N/A N/A
Sanz [119] 2007 42/17 mPAP Average velocity -0.73** 11.7cm/s 0.90
Diastolic PA area 0.67** 6.6cm2 0.95
PVRI Average velocity -0.86** 11.7cm/s 0.92
Diastolic area 0.64** 6.0cm2 0.93
Gan [120] 2007 70/16 mPAP PA RAC 0.47* N/A N/A
Garcia-Alvarez [121]
2011 100/0
(80 derivation 20 validation)
PVR MR estimated
PVR
0.84** ≥4.2 WU 0.97
Swift [122] 2012 194/39 mPAP VMI 0.78** >0.4 0.91
LGE
present/absent
N/A LGE Present 0.89
Diastolic PA area 0.35* >6cm2 0.84
Moral [123]
2012 152/33 mPAP 0.61** 7.2 0.97
Swift [56] 2013 64+64/12+10 mPAP Model CMR
mPAP
0.82** ≥32mmHg 0.96
PVR Model CMR
PVR
0.87** ≥3WU 0.94
Johns [124]
2017 87/15
All COPD patients had COPD
mPAP CMR-RV model 0.689** 32mmHg 0.91
PA/RV model 0.732** 25mmHg 0.93
0.527** 7.2 0.84
Zhang [125]
2017 50/0
All PAH (25 derivation and validation)
mPAP CMR mPAP Model 0.647** N/A N/A
PVR CMR PVR model 0.492** N/A N/A
mPAP: mean pulmonary arterial pressure, VMI: ventricular mass index, PVR(I): pulmonary vascular resistance
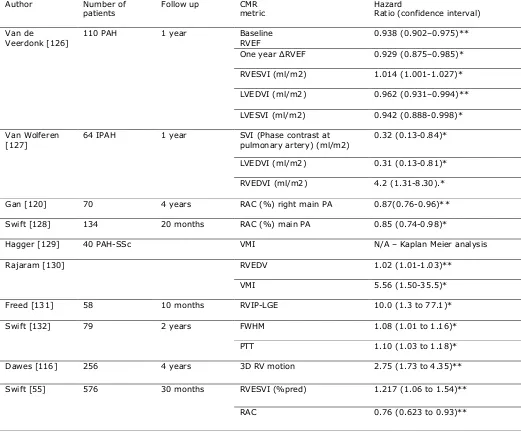
Table 3:
Author Number of
patients
Follow up CMR
metric
Hazard
Ratio (confidence interval)
Van de
Veerdonk [126]
110 PAH 1 year Baseline
RVEF
0.938 (0.902–0.975)**
One year RVEF 0.929 (0.875–0.985)*
RVESVI (ml/m2) 1.014 (1.001-1.027)*
LVEDVI (ml/m2) 0.962 (0.931–0.994)**
LVESVI (ml/m2) 0.942 (0.888-0.998)*
Van Wolferen [127]
64 IPAH 1 year SVI (Phase contrast at
pulmonary artery) (ml/m2)
0.32 (0.13-0.84)*
LVEDVI (ml/m2) 0.31 (0.13-0.81)*
RVEDVI (ml/m2) 4.2 (1.31-8.30).*
Gan [120] 70 4 years RAC (%) right main PA 0.87(0.76-0.96)**
Swift [128] 134 20 months RAC (%) main PA 0.85 (0.74-0.98)*
Hagger [129] 40 PAH-SSc VMI N/A – Kaplan Meier analysis
Rajaram [130] RVEDV 1.02 (1.01-1.03)**
VMI 5.56 (1.50-35.5)*
Freed [131] 58 10 months RVIP-LGE 10.0 (1.3 to 77.1)*
Swift [132] 79 2 years FWHM 1.08 (1.01 to 1.16)*
PTT 1.10 (1.03 to 1.18)*
Dawes [116] 256 4 years 3D RV motion 2.75 (1.73 to 4.35)**
Swift [55] 576 30 months RVESVI (%pred) 1.217 (1.06 to 1.54)**
RAC 0.76 (0.623 to 0.93)**
Advantages Disadvantages
Chest Radiograph Readily available, low cost Low sensitivity and specific Echocardiography Readily available, portable, medium cost Operator dependent
Diagnostic and prognostic data Poor in lung disease Ventilation/Perfusion SPECT Higher sensitivity than CTPA for CTEPH May be non-diagnostic
Information regarding lung disease Ionizing radiation Easy for non-specialists to exclude CTEPH
Computed Tomography Readily available, moderate cost Exposure to ionizing radi Allows assessment of vascular, cardiac, Inexperienced radiologists mediastinal and lung structures
Quick to perform
Cardiac MRI Gold standard for ventricular function
Non-ionizing
High cost, post processin consuming
Not always tolerated, co
Abdominal USS Non-ionizing Not specific or sensitive
Funding
This work was supported by NIHR grant NIHR-RP-R3-12-027, Wellcome grant 205188/Z/16/Z and MRC grant
MR/M008894/1. The views expressed in this publication are those of the authors and not necessarily those of the
References (max 100)
[1] Galiè N, Humbert M, Vachiery J-L, et al. 2015 ESC/ERS Guidelines for the diagnosis and treatment of
pulmonary hypertension: The Joint Task Force for the Diagnosis and Treatment of Pulmonary Hypertension of
the European Society of Cardiology (ESC) and the European Respiratory Society (ERS): Endor. Eur. Heart J.
2016;37:67 119.
[2] Kiely DG, Elliot CA, Sabroe I, et al. Pulmonary hypertension: diagnosis and management. BMJ.
2013;346:f2028 f2028.
[3] ‘ “ “ AJ W JM ‘ CT
M T
-2015-207394.
[4] Avouac J, Airò P, Meune C, et al. Prevalence of pulmonary hypertension in systemic sclerosis in European
Caucasians and metaanalysis of 5 studies. J. Rheumatol. 2010;37:2290 2298.
[5] Mandell MS, Groves BM. Pulmonary hypertension in chronic liver disease. Clin. Chest Med. 1996;17:17 33.
[6] Budhiraja R, Hassoun PM. Portopulmonary hypertension: a tale of two circulations. Chest. 2003;123:562 576.
[7] Castro M, Krowka MJ, Schroeder DR, et al. Frequency and clinical implications of increased pulmonary artery
pressures in liver transplant patients. Mayo Clin. Proc. 1996;71:543 551.
[8] Sitbon O, Lascoux-Combe C, Delfraissy J-F, et al. Prevalence of HIV-related pulmonary arterial hypertension in
the current antiretroviral therapy era. Am. J. Respir. Crit. Care Med. 2008;177:108 113.
[9] Rich S, Dantzker DR, Ayres SM, et al. Primary pulmonary hypertension. A national prospective study. Ann.
Intern. Med. 1987;107:216 223.
[10] Galie N, Hoeper MM, Humbert M, et al. Guidelines for the diagnosis and treatment of pulmonary
hypertension: The Task Force for the Diagnosis and Treatment of Pulmonary Hypertension of the European
Society of Cardiology (ESC) and the European Respiratory Society (ERS), endorsed by the Internat. Eur. Heart
J. 2009;30:2493 2537.
[11] Currie PJ, Seward JB, Chan KL, et al. Continuous wave Doppler determination of right ventricular pressure: a
simultaneous Doppler-catheterization study in 127 patients. J. Am. Coll. Cardiol. 1985;6:750 756.
[12] Berger M, Haimowitz A, Van Tosh A, et al. Quantitative assessment of pulmonary hypertension in patients
with tricuspid regurgitation using continuous wave Doppler ultrasound. J. Am. Coll. Cardiol. 1985;6:359 365.
[13] Fisher MR, Forfia PR, Chamera E, et al. Accuracy of Doppler Echocardiography in the Hemodynamic
Assessment of Pulmonary Hypertension. Am. J. Respir. Crit. Care Med. 2009;179:615 621.
[14] Parasuraman S, Walker S, Loudon B, et al. Assessment of pulmonary artery pressure by echocardiography A
[15] Kiely DG, Cargill RI, Struthers AD, et al. Cardiopulmonary effects of endothelin-1 in man. Cardiovasc. Res.
1997;33:378 386.
[16] Ommen SR, Nishimura R a, Appleton CP, et al. Clinical Utility of Doppler Echocardiography and Tissue Doppler
I E L V F P A C “ D
-Catheterization Study. Circulation. 2000;102:1788 1794.
[17] Nanthakumar K, Graham AT, Robinson TI, et al. Contrast echocardiography for detection of pulmonary
arteriovenous malformations. Am. Heart J. 2001;141:243 246.
[18] Attaran RR, Ata I, Kudithipudi V, et al. Protocol for optimal detection and exclusion of a patent foramen ovale
using transthoracic echocardiography with agitated saline microbubbles. Echocardiography. 2006;23:616
622.
[19] Silvestry FE, Cohen MS, Armsby LB, et al. Guidelines for the Echocardiographic Assessment of Atrial Septal
Defect and Patent Foramen Ovale: From the American Society of Echocardiography and Society for Cardiac
Angiography and Interventions. J. Am. Soc. Echocardiogr. 2015;28:910 958.
[20] B M N JB M M EANM P P
imaging with ventilation/perfusion single photon emission tomography. Eur. J. Nucl. Med. Mol. Imaging.
2009;36:1356 1370.
[21] Johns CS, Swift AJ, Rajaram S, et al. Lung perfusion: MRI vs. SPECT for screening in suspected chronic
thromboembolic pulmonary hypertension. J. Magn. Reson. Imaging. 2017;
[22] Johns CS, Swift AJ, Hughes PJC, et al. Pulmonary MR angiography and perfusion imaging A review of
methods and applications. Eur. J. Radiol. 2017;86:361 370.
[23] Rajaram S, Swift AJ, Telfer A, et al. 3D contrast-enhanced lung perfusion MRI is an effective screening tool for
chronic thromboembolic pulmonary hypertension: results from the ASPIRE Registry. Thorax. 2013;68:677
678.
[24] Hagan G, Southwood M, Treacy C, et al. (18)FDG PET imaging can quantify increased cellular metabolism in
pulmonary arterial hypertension: A proof-of-principle study. Pulm. Circ. 2011;1:448 455.
[25] Fang W, Zhao L, Xiong C-M, et al. Comparison of 18F-FDG uptake by right ventricular myocardium in
idiopathic pulmonary arterial hypertension and pulmonary arterial hypertension associated with congenital
heart disease. Pulm. Circ. 2012;2:365 372.
[26] Zhao L, Ashek A, Wang L, et al. Heterogeneity in Lung 18FDG Uptake in pulmonary arterial hypertension:
Potential of dynamic 18FDG Positron emission tomography with kinetic analysis as a bridging biomarker for
pulmonary vascular remodeling targeted treatments. Circulation. 2013;128:1214 1224.
[27] Tatebe S, Fukumoto Y, Oikawa-Wakayama M, et al. Enhanced [18F]fluorodeoxyglucose accumulation in the
preliminary observational study. Eur. Heart J. Cardiovasc. Imaging. 2014;15:666 672.
[28] Schlosser T, Nensa F, Mahabadi A a, et al. Hybrid MRI/PET of the heart: a new complementary imaging
technique for simultaneous acquisition of MRI and PET data. Heart. 2013;99:351 352.
[29] Rajaram S, Swift AJ, Davies C, et al. Primary pulmonary artery sarcoma and coexisting chronic
thromboembolic pulmonary hypertension. Am. J. Respir. Crit. Care Med. 2013;188:e7-8.
[30] David S, Hoeper MM, Vogel-Claussen J, et al. Pulmonary Arterial Sarcoma Presenting as Acute Pulmonary
Embolism. Am. J. Respir. Crit. Care Med. 2017;196:523.
[31] Rajaram S, Swift AJ, Condliffe R, et al. CT features of pulmonary arterial hypertension and its major subtypes:
a systematic CT evaluation of 292 patients from the ASPIRE Registry. Thorax. 2015;70:382 387.
[32] Tan RT, Kuzo R, Goodman LR, et al. Utility of CT Scan Evaluation for Predicting Pulmonary Hypertension in
Patients With Parenchymal Lung Disease. Chest. 1998;113:1250 1256.
[33] Edwards PD, Bull RK, Coulden R. CT measurement of main pulmonary artery diameter. Br. J. Radiol.
1998;71:1018 1020.
[34] Ramjug S, Hussain N, Hurdman J, et al. Idiopathic and Systemic Sclerosis-Associated Pulmonary Arterial
Hypertension. Chest. 2017;152:92 102.
[35] Condliffe R, Kiely DG, Peacock AJ, et al. Connective tissue disease-associated pulmonary arterial hypertension
in the modern treatment era. Am. J. Respir. Crit. Care Med. 2009;179:151 157.
[36] Sheehan R, Perloff JK, Fishbein MC, et al. Pulmonary neovascularity: A distinctive radiographic finding in
Eisenmenger syndrome. Circulation. 2005;112:2778 2785.
[37] Dong C, Zhou M, Liu D, et al. Diagnostic accuracy of computed tomography for chronic thromboembolic
pulmonary hypertension: a systematic review and meta-analysis. PLoS One. 2015;10:e0126985.
[38] Reichelt A, Hoeper MM, Galanski M, et al. Chronic thromboembolic pulmonary hypertension: evaluation with
64-detector row CT versus digital substraction angiography. Eur. J. Radiol. 2009;71:49 54.
[39] Tunariu N, Gibbs SJR, Win Z, et al. Ventilation-perfusion scintigraphy is more sensitive than multidetector
CTPA in detecting chronic thromboembolic pulmonary disease as a treatable cause of pulmonary
hypertension. J. Nucl. Med. 2007;48:680 684.
[40] Baque-Juston MC, Wells AU, Hansell DM. Pericardial thickening or effusion in patients with pulmonary artery
hypertension: a CT study. Am. J. Roentgenol. 1999;172:361 364.
[41] Groves A., Win T, Charman S., et al. Semi-quantitative assessment of tricuspid regurgitation on
contrast-enhanced multidetector CT. Clin. Radiol. 2004;59:715 719.
[42] Horton MR, Tuder RM. Primary pulmonary arterial hypertension presenting as diffuse micronodules on CT.
[43] Resten A, Maître S, Humbert M, et al. Pulmonary Arterial Hypertension: Thin-Section CT Predictors of
Epoprostenol Therapy Failure. Radiology. 2002;222:782 788.
[44] Revel M-P, Faivre J-B, Remy-Jardin M, et al. Pulmonary Hypertension: ECG-gated 64-Section CT Angiographic
Evaluation of New Functional Parameters as Diagnostic Criteria. Radiology. 2009;250:558 566.
[45] David S, Hoeper MM, Vogel-Claussen J, et al. Pulmonary Arterial Sarcoma Presenting as Acute Pulmonary
Embolism. Am. J. Respir. Crit. Care Med. 2017;
[46] Thieme SF, Graute V, Nikolaou K, et al. Dual Energy CT lung perfusion imaging--correlation with SPECT/CT.
Eur. J. Radiol. 2012;81:360 365.
[47] Johnson TRC, Krauss B, Sedlmair M, et al. Material differentiation by dual energy CT: initial experience. Eur.
Radiol. 2007;17:1510 1517.
[48] Chandra N, Langan DA. Gemstone Detector: Dual Energy Imaging via Fast kVp Switching. In: Johnson T, Fink C,
Schönberg SO, et al., editors. Dual Energy CT Clin. Pract. Berlin, Heidelberg: Springer Berlin Heidelberg; 2011.
p. 35 41.
[49] Fornaro J, Leschka S, Hibbeln D, et al. Dual- and multi-energy CT: approach to functional imaging. Insights
Imaging. 2011;2:149 159.
[50] Ohana M, Jeung MY, Labani A, et al. Thoracic dual energy CT: acquisition protocols, current applications and
future developments. Diagn. Interv. Imaging. 2014;95:1017 1026.
[51] Ameli-Renani S, Rahman F, Nair A, et al. Dual-Energy CT for Imaging of Pulmonary Hypertension: Challenges
and Opportunities. Radiographics. 2013;34:1769 1790.
[52] Hoey ETD, Mirsadraee S, Pepke-Zaba J, et al. Dual-energy CT angiography for assessment of regional
pulmonary perfusion in patients with chronic thromboembolic pulmonary hypertension: Initial experience.
Am. J. Roentgenol. 2011;196:524 532.
[53] Remy-Jardin M, Faivre J-B, Pontana F, et al. Thoracic applications of dual energy. Radiol. Clin. North Am.
2010;48:193 205.
[54] Ruzsics B, Lee H, Zwerner PL, et al. Dual-energy CT of the heart for diagnosing coronary artery stenosis and
myocardial ischemia-initial experience. Eur. Radiol. 2008;18:2414 2424.
[55] Swift AJ, Capener D, Johns CS, et al. Magnetic Resonance Imaging in the Prognostic Evaluation of Patients
with Pulmonary Arterial Hypertension. Am. J. Respir. Crit. Care Med. 2017;
[56] Swift AJ, Rajaram S, Hurdman J, et al. Noninvasive Estimation of PA Pressure, Flow, and Resistance With CMR
Imaging. JACC Cardiovasc. Imaging. 2013;6:1036 1047.
[57] Swift AJ, Rajaram S, Capener D, et al. Longitudinal and transverse right ventricular function in pulmonary
2015;5:000 000.
[58] van Wolferen SA, Marcus JT, Boonstra A, et al. Prognostic value of right ventricular mass, volume, and
function in idiopathic pulmonary arterial hypertension. Eur. Heart J. 2007;28:1250 1257.
[59] van de Veerdonk MC, Kind T, Marcus JT, et al. Progressive Right Ventricular Dysfunction in Patients With
Pulmonary Arterial Hypertension Responding to Therapy. J. Am. Coll. Cardiol. 2011;58:2511 2519.
[60] Mauritz G-J, Marcus JT, Boonstra A, et al. Non-invasive stroke volume assessment in patients with pulmonary
arterial hypertension: left-sided data mandatory. J. Cardiovasc. Magn. Reson. 2008;10:51.
[61] Jaspers K, Freling HG, van Wijk K, et al. Improving the reproducibility of MR-derived left ventricular volume
and function measurements with a semi-automatic threshold-based segmentation algorithm. Int. J.
Cardiovasc. Imaging. 2013;29:617 623.
[62] Saba TS, Foster J, Cockburn M, et al. Ventricular mass index using magnetic resonance imaging accurately
estimates pulmonary artery pressure. Eur. Respir. J. 2002;20:1519 1524.
[63] Roeleveld RJ, Marcus JT, Faes TJC, et al. Interventricular Septal Configuration at MR Imaging and Pulmonary
Arterial Pressure in Pulmonary Hypertension. Radiology. 2005;234:710 717.
[64] Reiter G, Reiter U, Kovacs G, et al. Counter-clockwise vortical blood flow in the main pulmonary artery in a
p
imaging case report. BMC Med. Imaging. 2016;16:45.
[65] Reiter G, Reiter U, Kovacs G, et al. Blood flow vortices along the main pulmonary artery measured with MR
imaging for diagnosis of pulmonary hypertension. Radiology. 2015;275:71 79.
[66] Reiter G, Reiter U, Kovacs G, et al. Magnetic Resonance-Derived 3-Dimensional Blood Flow Patterns in the
Main Pulmonary Artery as a Marker of Pulmonary Hypertension and a Measure of Elevated Mean Pulmonary
Arterial Pressure. Circ. Cardiovasc. Imaging. 2008;1:23 30.
[67] Rajaram S, Swift AJ, Capener D, et al. Diagnostic accuracy of contrast-enhanced MR angiography and
unenhanced proton MR imaging compared with CT pulmonary angiography in chronic thromboembolic
pulmonary hypertension. Eur. Radiol. 2012;22:310 317.
[68] Wild JM, Marshall H, Bock M, et al. MRI of the lung (1/3): Methods. Insights Imaging. 2012;3:345 353.
[69] Ohno Y, Hatabu H, Murase K, et al. Quantitative assessment of regional pulmonary perfusion in the entire
lung using three-dimensional ultrafast dynamic contrast-enhanced magnetic resonance imaging: Preliminary
experience in 40 subjects. J. Magn. Reson. Imaging. 2004;20:353 365.
[70] Risse F. MR Perfusion of the Lung. Kauczor H-U, editor. MRI Lung. Berlin, Heidelberg: Springer Berlin
Heidelberg; 2009.
2004;52:296 299.
[72] Alexandre J, Saloux E, Dugué AE, et al. Scar extent evaluated by late gadolinium enhancement CMR: a
powerful predictor of long term appropriate ICD therapy in patients with coronary artery disease. J.
Cardiovasc. Magn. Reson. 2013;15:12.
[73] Swift AJ, Rajaram S, Capener D, et al. LGE patterns in pulmonary hypertension do not impact overall
mortality. JACC. Cardiovasc. Imaging. 2014;7:1209 1217.
[74] Blyth KG, Groenning BA, Martin TN, et al. Contrast enhanced-cardiovascular magnetic resonance imaging in
patients with pulmonary hypertension. Eur. Heart J. 2005;26:1993 1999.
[75] Spruijt OA, Vissers L, Bogaard H-J, et al. Increased native T1-values at the interventricular insertion regions in
precapillary pulmonary hypertension. Int. J. Cardiovasc. Imaging. 2016;32:451 459.
[76] Jellis CL, Yingchoncharoen T, Gai N, et al. Correlation between right ventricular T1 mapping and right
ventricular dysfunction in non-ischemic cardiomyopathy. Int. J. Cardiovasc. Imaging. 2017;0:0.
[77] Auger WR, Peter Fedullo, Peterson K. Chronic Major-Vessel Thomboembolic Pulmonary Artery Obstruction:
Appearance at Anglography. Radiology. 1992;182:393 398.
[78] Ogo T. Balloon pulmonary angioplasty for inoperable chronic thromboembolic pulmonary hypertension. Curr.
Opin. Pulm. Med. 2015;21:p425 31.
[79] Andreassen AK, Ragnarsson A, Gude E, et al. Balloon pulmonary angioplasty in patients with inoperable
chronic thromboembolic pulmonary hypertension. Heart. 2013;99:1415 1420.
[80] Kataoka M, Inami T, Hayashida K, et al. Percutaneous transluminal pulmonary angioplasty for the treatment
of chronic thromboembolic pulmonary hypertension. Circ. Cardiovasc. Interv. 2012;5:756 762.
[81] Fukui S, Ogo T, Morita Y, et al. Right ventricular reverse remodelling after balloon pulmonary angioplasty. Eur.
Respir. J. 2014;43:1394 1402.
[82] Quadery S, Billings C, Wild J, et al. Chronic thrombo-embolic pulmonary hypertension: Long-term outcomes in
operated and non-operated patients. Eur. Respir. J. 2016;48.
[83] Jorge E, Baptista R, Calisto J, et al. Optical coherence tomography of the pulmonary arteries: A systematic
review. J. Cardiol. 2016;67:6 14.
[84] Dai Z, Fukumoto Y, Tatebe S, et al. OCT Imaging for the Management of Pulmonary Hypertension. JACC
Cardiovasc. Imaging. 2014;7:843 845.
[85] Hou J, Qi H, Zhang M, et al. Pulmonary vascular changes in pulmonary hypertension: optical coherence
tomography findings. Circ. Cardiovasc. Imaging. 2010;3:344 345.
[86] Dai Z, Sugimura K, Fukumoto Y, et al. Visualization of Complete Regression of Pulmonary Arterial Remodeling
2773.
[87] Tatebe S, Fukumoto Y, Sugimura K, et al. Optical Coherence Tomography as a Novel Diagnostic Tool for Distal
Type Chronic Thromboembolic Pulmonary Hypertension. Circ. J. 2010;74:1742 1744.
[88] Hong C, Wang W, Zhong N, et al. Visualization of Peripheral Pulmonary Artery Red Thrombi Utilizing Optical
Coherence Tomography. Korean J. Radiol. 2013;14:854.
[89] D A GE B RJ, Ayres SM, et al. Survival in patients with primary pulmonary hypertension. Results from
a national prospective registry. Ann. Intern. Med. 1991;115:343 349.
[90] McLaughlin V V., Presberg KW, Doyle RL, et al. Prognosis of Pulmonary Arterial Hypertension*. Chest.
2004;126:78S 92S.
[91] Miyamoto S, Nagaya N, Satoh T, et al. Clinical correlates and prognostic significance of six-minute walk test in
patients with primary pulmonary hypertension. Comparison with cardiopulmonary exercise testing. Am. J.
Respir. Crit. Care Med. 2000;161:487 492.
[92] Sitbon O, Humbert M, Nunes H, et al. Long-term intravenous epoprostenol infusion in primary pulmonary
hypertension. J. Am. Coll. Cardiol. 2002;40:780 788.
[93] Billings CG, Hurdman JA, Condliffe R, et al. Incremental shuttle walk test distance and autonomic dysfunction
predict survival in pulmonary arterial hypertension. J. Heart Lung Transplant. 2017;36:871 879.
[94] Rubin LJ. The 6-minute walk test in pulmonary arterial hypertension: how far is enough? Am. J. Respir. Crit.
Care Med. 2012;186:396 397.
[95] D ‘ K M“ “ -minute walk test in pulmonary arterial hypertension. Anatol. J. Cardiol.
2015;15:249 254.
[96] Forfia PR, Fisher MR, Mathai SC, et al. Tricuspid Annular Displacement Predicts Survival in Pulmonary
Hypertension. Am. J. Respir. Crit. Care Med. 2006;174:1034 1041.
[97] Tei C, Dujardin KS, Hodge DO, et al. Doppler echocardiographic index for assessment of global right
ventricular function. J. Am. Soc. Echocardiogr. 9:838 847.
[98] Yeo TC, Dujardin KS, Tei C, et al. Value of a Doppler-Derived index combining systolic and diastolic time
intervals in predicting outcome in primary pulmonary hypertension. Am. J. Cardiol. 1998;81:1157 1161.
[99] Raymond RJ, Hinderliter AL, Willis PW, et al. Echocardiographic predictors of adverse outcomes in primary
pulmonary hypertension. J. Am. Coll. Cardiol. 2002;39:1214 1219.
[100] Nagaya N, Nishikimi T, Uematsu M, et al. Plasma brain natriuretic peptide as a prognostic indicator in patients
with primary pulmonary hypertension. Circulation. 2000;102:865 870.
[101] van Wolferen SA, van de Veerdonk MC, Mauritz G-J, et al. Clinically Significant Change in Stroke Volume in
[102] Peacock AJ, Vonk Noordegraaf A. Cardiac magnetic resonance imaging in pulmonary arterial hypertension.
Eur Respir Rev. 2013;22:526 534.
[103] Swift AJ, Rajaram S, Campbell MJ, et al. Prognostic Value of Cardiovascular Magnetic Resonance Imaging
Measurements Corrected for Age and Sex in Idiopathic Pulmonary Arterial Hypertension. Circ. Cardiovasc.
Imaging. 2014;7:100 106.
[104] Baggen VJM, Leiner T, Post MC, et al. Cardiac magnetic resonance findings predicting mortality in patients
with pulmonary arterial hypertension: a systematic review and meta-analysis. Eur. Radiol. 2016;26:3771
3780.
[105] Simonneau G, Rubin LJ, Galiè N, et al. Addition of sildenafil to long-term intravenous epoprostenol therapy in
patients with pulmonary arterial hypertension: a randomized trial. Ann. Intern. Med. 2008;149:521 530.
[106] Barst RJ, Rubin LJ, Long WA, et al. A comparison of continuous intravenous epoprostenol (prostacyclin) with
conventional therapy for primary pulmonary hypertension. N. Engl. J. Med. 1996;334:296 301.
[107] Billings C, Hurdman J, Condliffe R, et al. S121 The Utility Of The Incremental Shuttle Walking Test In
Pulmonary Hypertension: Results From The Aspire Registry. Thorax. 2014;69:A65 A65.
[108] Leuchte HH, Holzapfel M, Baumgartner RA, et al. Characterization of Brain Natriuretic Peptide in Long-term
Follow-up of Pulmonary Arterial Hypertension. Chest. 2005;128:2368 2374.
[109] Casserly B, Klinger JR. Brain natriuretic peptide in pulmonary arterial hypertension: biomarker and potential
therapeutic agent. Drug Des. Devel. Ther. 2009;3:269 287.
[110] van de Veerdonk MC, Marcus JT, Westerhof N, et al. Signs of Right Ventricular Deterioration in Clinically
Stable Patients With Pulmonary Arterial Hypertension. Chest. 2015;147:1063 1071.
[111] van Wolferen SA, van de Veerdonk MC, Mauritz G-J, et al. Clinically Significant Change in Stroke Volume in
Pulmonary Hypertension. Chest. 2011;139:1003 1009.
[112] Mazurek JA, Vaidya A, Mathai SC, et al. Follow-up tricuspid annular plane systolic excursion predicts survival
in pulmonary arterial hypertension. Pulm. Circ. 2017;7:361 371.
[113] Wright LM, Dwyer N, Celermajer D, et al. Follow-Up of Pulmonary Hypertension With Echocardiography. JACC
Cardiovasc. Imaging. 2016;9:733 746.
[114] B E D A A D A M E phy in Pulmonary Arterial Hypertension: from Diagnosis
to Prognosis. J. Am. Soc. Echocardiogr. 2013;26:1 14.
[115] Yorke J, Corris P, Gaine S, et al. emPHasis-10: development of a health-related quality of life measure in
pulmonary hypertension. Eur. Respir. J. 2014;43:1106 1113.
[116] Dawes TJW, de Marvao A, Shi W, et al. Machine Learning of Three-dimensional Right Ventricular Motion
2017;283:381 390.
[117] Lungu A, Wild JM, Capener D, et al. MRI model-based non-invasive differential diagnosis in pulmonary
hypertension. J. Biomech. 2014;47:2941 2947.
[118] Roeleveld RJ, Marcus JT, Boonstra A, et al. A comparison of noninvasive MRI-based methods of estimating
pulmonary artery pressure in pulmonary hypertension. J. Magn. Reson. Imaging. 2005;22:67 72.
[119] Sanz J, Kuschnir P, Rius T, et al. Pulmonary arterial hypertension: noninvasive detection with phase-contrast
MR imaging. Radiology. 2007;243:70 79.
[120] Gan CT-J, Lankhaar J-W, Westerhof N, et al. Noninvasively assessed pulmonary artery stiffness predicts
mortality in pulmonary arterial hypertension. Chest. 2007;132:1906 1912.
[121] García-Alvarez A, Fernández-Friera L, Mirelis JG, et al. Non-invasive estimation of pulmonary vascular
resistance with cardiac magnetic resonance. Eur. Heart J. 2011;32:2438 2445.
[122] Swift AJ, Rajaram S, Condliffe R, et al. Diagnostic accuracy of cardiovascular magnetic resonance imaging of
right ventricular morphology and function in the assessment of suspected pulmonary hypertension results
from the ASPIRE registry. J. Cardiovasc. Magn. Reson. 2012;14:40.
[123] Moral S, Fernández-Friera L, Stevens G, et al. New index alpha improves detection of pulmonary hypertension
in comparison with other cardiac magnetic resonance indices. Int. J. Cardiol. 2012;161:25 30.
[124] Johns CS, Rajaram S, Capener DA, et al. Non-invasive methods for estimating mPAP in COPD using
cardiovascular magnetic resonance imaging. Eur. Radiol. 2017;
[125] Zhang Z, Wang M, Yang Z, et al. Noninvasive prediction of pulmonary artery pressure and vascular resistance
by using cardiac magnetic resonance indices. Int. J. Cardiol. 2017;227:915 922.
[126] van de Veerdonk MC, Kind T, Marcus JT, et al. Progressive right ventricular dysfunction in patients with
pulmonary arterial hypertension responding to therapy. J. Am. Coll. Cardiol. 2011;58:2511 2519.
[127] van Wolferen SA, Marcus JT, Boonstra A, et al. Prognostic value of right ventricular mass, volume, and
function in idiopathic pulmonary arterial hypertension. Eur. Heart J. 2007;28:1250 1257.
[128] Swift AJ, Rajaram S, Condliffe R, et al. Pulmonary artery relative area change detects mild elevations in
pulmonary vascular resistance and predicts adverse outcome in pulmonary hypertension. Invest. Radiol.
2012;47:571 577.
[129] Hagger D, Condliffe R, Woodhouse N, et al. Ventricular mass index correlates with pulmonary artery pressure
and predicts survival in suspected systemic sclerosis-associated pulmonary arterial hypertension.
Rheumatology (Oxford). 2009;48:1137 1142.
[130] Rajaram S, Swift AJ, Capener D, et al. Comparison of the diagnostic utility of cardiac magnetic resonance
hypertension in patients with connective tissue disease. J. Rheumatol. 2012;39:1265 1274.
[131] Freed BH, Gomberg-Maitland M, Chandra S, et al. Late gadolinium enhancement cardiovascular magnetic
resonance predicts clinical worsening in patients with pulmonary hypertension. J. Cardiovasc. Magn. Reson.
2012;14:11.
[132] Swift AJ, Telfer A, Rajaram S, et al. Dynamic Contrast Enhanced Magnetic Resonance Imaging in Patients with