EUROPEAN COAL AND STEEL COMMUNITY
COMMISSION OF THE EUROPEAN COMMUNITIES
Financial Report
for the year 1972
No 18
1·-1-EUROPEAN COAL AND STEEL COMMUNITY
COMMISSION OF THE EUROPEAN COMMUNITIES Franco Maria Malfatti
Sicco L. Mansholt Raymond Barre Wilhelm Haferkamp Carlo Scarascia Mugnozza Albert Coppe
Jean-Fran~ois Deniau Altiero Spinelli Albert Borschette Ralf Dahrendorf
President 1
Vice-President 2
Vice-President Vice-President Vice-President 3
Member Member Member Member Member
Fabrizio Gillet, Director-General of the "Credit and Investments" Department.
The figures in this report and in the attached ECSC balance sheet and expenditure account, together with the main features of loans contracted, are expressed in units of account of the European Monetary Agreement (EMA). All such amounts are the equivalent of sums in national currencies computed at the following rates of exchange, as declared to the International Monetary Fund at 31 December 1972.
1 EMA unit =
us
$ 1.08571DM 3.66
BFr. 50.-FFr. 5.55419 Lit. 625.-LFr. 50.-Fl. 3.62 SFr. 4.0841
CONTENTS
Page
I - Short outline of the growth in investments by the Community coal
and steel industries 7
II - Borrowing operations by the ECSC 11
III - Loans and guarantees 13
IV - Changes in reserves and provisions, management of liquid assets 21
ANNEXES:
I - Main characteristics of loans contracted to 31 December 1972 24
II - Balance sheet at 31 December 1972 27
LUXEMBOURG, JULY 1973
This financial report covers the year 1972, the twentieth year of the European Coal and Steel Community's existence and the eighteenth year of its borrowing and lending operations.
I - SHORT OUTLINE
OF THE GROWTH IN INVESTMENTS IN THE COAL AND STEEL INDUSTRIES
In order to guide the parties concerned and help the Community in its own courses of action, the ECSC Treaty provides for the following instruments, in addition to the general objectives which describe the broad outlines of investment policy: - the annual survey of investment conducted directly among enterprises and the
survey of investment financing conducted among professional associations of employers and workers;
- prior notification by enterprises of investment programmes in excess of certain estimated costs and the giving of reasoned opinions on these programmes . 1
The details below, collected by the Commission from enterprises or their employers' and workers' associations, relate to capital expenditure, methods of financing and recent trends in the readiness of enterprises to embark on new programmes.
(a) Capital expenditure by enterprises
During the year covered by this report, Community crude steel production rose by 9. 7 million tonnes from 103.4 million tonnes in 1971 to 112.1 million in 1972. At the same time, coal production continued to decrease, totalling 145.7 million tonnes as compared with 158.6 million in 1971.
Capital expenditure in the Community coal and steel industries in 1972 can as yet be estimated only on the basis of the forecasts supplied. to the Commission by ECSC enterprises on 1 January 1972.2
TABLE 1
Capital expenditure in the ECSC industries from 1954 to 1972
(in million units of account}
Actual expenditures
Sector
1954-1959
(annual 1960 1961 1962 1963 1964 1965 1966 1967 1968 1969 1970
average)
Coal industry 327 268 283 267 250 235 219 189 159 150 101 108 Briquette and
low-tern-perature brown coal
coke plants 5 6 4 6 9 8 8 4 5 4 4 2
Iron-ore mines 39 43 52 47 28 24 25 17 16 21 20 21
Iron and steel industry 581 775 1123 1 230 1480 1 315 932 848 730 802 1039 1 706
- -
- -
- -
- -
- -
- -- -
- -
-Total 952 1092 1462 1 550 1 767 1 582 1184 1 058 910 977 1164 1 837
(b) ~ecent trends
For the iron and steel industry as a whole, estimated expenditure as declared by enterprises in respect of their main investment programmes-not to be confused with actual expenditure recorded in the accounts for the same years-fell from 3 000 million on average for 1969 and 1970 to 669 million in 1971. In 1972 the total rallied somewhat, reflecting the readiness of enterprises to invest, to 806 million units of account.
Programmes submitted for the coal industry totalled 131 million units of account in 1972 as compared with 193 million in 1971.
The following two tables illustrate movements since 1959 in total planned expenditure for investment programmes submitted, on the one hand, and in the average FOB prices for exports of iron and steel (Treaty) products per tonne on the other hand. They reflect to close relation between readiness to invest and the prevailing economic climate (cf. also figure 2).
TABLE 2
Planned expenditure for programmes declared
(jn million units of account}
1959 1960 1 1961 1962 1963 1964 1965 1966 1967 1968 1 1969 1 1970 1 1971 1972
503 11 80811 371
I
553 131 501 509 338 697 6691~
84813 9941 669 1 8068
1971 1972
136 142
7 9
26 21 2 266 2 628
- -
FIGURE 1
INVESTMENTS IN THE STEEL INDUSTRY OF THE COMMUNITY
In units of account
150
145
-
Averago price per ton (fob) of exports of steel products covered by the Treaty140 Amounts of programmes declared
135
130
~
125
J
\
I
\
J\
\
1
~
~
1
/
120 115~
,
\
'~
110
I
\
\
/
~
1
/
_j
'
v
'
~
j1
\
I
I
" '
'
r,(
~ 105\
/
""'
I
'
In million units of account
'
~
\
\
\
. /
lI
I
I
J
1
1
1-1
/
/
_w
/
l
V
FIGURE 2
INVESTMENTS OF THE COMMUNITY STEEL INDUSTRY
In million units of account
4000
3800
3600
3400 ,_ f - - - - Amounts of programmes declared
3200 ·- t - - Actual capital expenditure
3000
2800
(1)
2600
,.,
2400
.l
II
,'
I
I
\
J
j
l
,
\
~
'
I
I
v
...~
I
_
/
\
..,
)
~
'\
I
~~
/
\
~
'
~IY
v
\
"""''lI ~r
v
I
1
\
~/
'
\
,,.
/
""'
2200
2000
1800
t600 1400
1200
1000
800
600
400
200
0
1959 1960 1961 1962 1963 1964 1965 1966 1967 1968 1969 1970 1971 1972
[image:9.569.15.532.44.788.2]TABLE 3
Average FOB prices per tonne for exports of (Treaty) iron and steel products
(in units of account)
1959 1960 1961 1962 1963 1964 1965 1966 1967 1968 1969 1970 1971 1972
113 129 118 113 108 114 108 106 105 105 117 147 134 135
[image:10.567.85.446.135.178.2]I I - BORROWING OPERATIONS BY THE ECSC
The downward trend in interest rates which began at the end of 1970 generally persisted during 1971. It came to a halt in 1972, and at the end of the year rates were again tending upwards on a number of markets.
In view of the marked rise in the number of loan applications received in the year, the Commission tried to make the most of the favourable conditions prevailing on the world market and on most national markets during the greater part of the year. It thus floated eleven loans to a total value equivalent to 229.99 million units of account (against 102.33 million in 1971).
The loans floated or contracted during 1972 had the following characteristics:
(1) 50 million SFr. : Private 12-year loan at 6 1/4% from a Swiss bank. (12 242 599 u.a.) Repayable in 8 more or less equal annual investments
from 1977.
(2) 20 000 million Lit. (32 000 000 u.a.)
: 15-year debenture loan floated at 94.50% on the Italian market. The bonds bear 7% interest payable half-yearly. The loan will be repaid in 10 equal annual investments from 1978. It is quoted on the Milan and Rome stock exchanges.
(3) 300 million LFr.: Private 12-year loan at 6 3/4% from a Luxembourg
(6 000 000 u.a.) bank. Repayable in more or less equal annual instalments
from I976.
(4) 150 million FFr.: 15-year debenture loan floated at 99% on the inter-national market. The bonds bear 7 1/4% interest payable annually. The loan will be repaid in 10 equal annual instalments from 1978. It is quoted on the Luxembourg stock exchange.
(5)
(27 006 638 u.a.)
IOO million DM : (27 322 41)4 u.a.)
15-year debenture loan floated at 99.50% on the German market. The bonds bear 6 1/2% interest payable annually. The loan will be repaid in 10 equal annual instalments from 1978. It is quoted on the five stock exchanges of the Federal Republic.
(6) 20 000 million Lit. : Private 15-year loan at 7% from an Italian bank. Re-(32 000 000 u.a.) payable in 10 equal annual instalments from 1978.
(7) 400 million LFr. : I 5-year debenture loan floated at 99% on the Luxembourg
(8 000 000 u.a.) market. The bonds bear 6 3/4% interest payable annually.
The loan will be repaid in 10 equal annual instalments from 1978. It is listed on the Luxembourg stock exchange.
(8) 150 million DM : 15-year debenture loan floated at par on the German (40 983 607 u.a.) market. The bonds bear 7% interest payable annually. The loan will be repaid in 10 equal annual instalments from 1979. It is quoted on the five stock exchanges of the Federal Republic.
(9) 30 million US $: Private I 5-year loan on the world market, at 7%. Re-(27 63I 688 u.a.) payable in 10 annual instalments from I978. It is listed
on the Luxembourg stock exchange.
(10) 60 million FFr.: Private 15-year loan floated at 7.50% interest on the (lO 802 656 u.a.) international market. Repayable m lO ·equal annual
instalments from 1979.
(11) 300 million LFr.: Private 15-year loan at 6.75% interest from a Luxem-(6 000 000 u.a.) bourg bank. Repayable in 10 equal annual instalments
from. 1979.
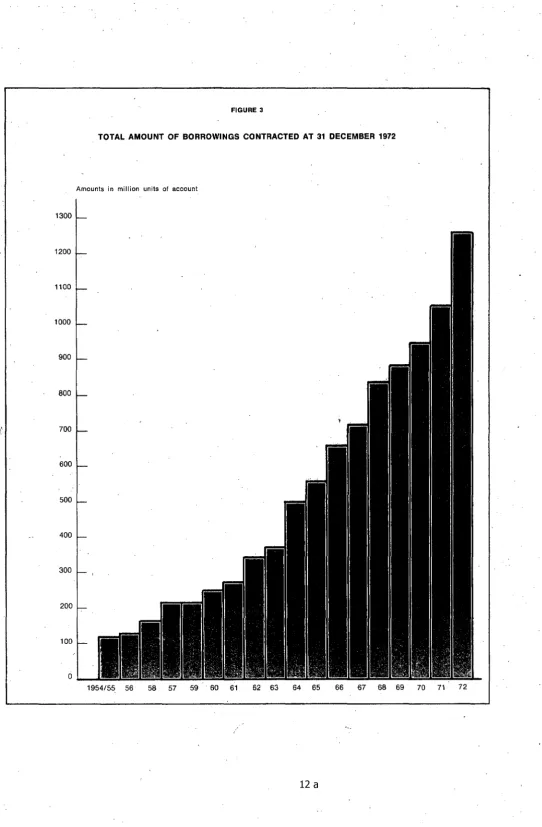
Including operations in 1972, the total value of loans contracted by the ECSC from its inception up to 31 December 1972 was equivalent to I 258.21 million u.a. The following table shows the loan position at 31 December 1972.
TABLE 4 1
(in million units of account)
Currency Total Repayments Balance·
borrowed borrowed outstanding ·
us s
373.03 2 148.80 224.23DM 315.84 70.66 245.18
Lit. 184.- 9.60 174.40
FFr. 91.82 6.75 85.07
Fl. 57.39 28.05 29.34
SFr. 56.63 18.37 38.26
BFr. 55.40 5.33 50.07
LFr. 54.10 6.32 47.78
:E 50.- -
50.-units of
account 20.- 1.30 18.70
1 258.21 295.18 963.03
1 The main characteristics of loans contracted by the ECSC to 31 December 1972, and the definitions of 1E (European
FIGURE 3
TOTAL AMOUNT OF BORROWINGS CONTRACTED AT 31 DECEMBER 1972
Amounts in million units ol account
1300 1200 1100 1000 900 800 700 600 500 400 300 200 100
1954/55 56 58 57 59 60 61 62 63 64 65 66 67 68 69 70 71 72
Ill - LOANS AND GUARANTEES
Funds available to the Commission in 1972 for lending to enterprises totalled 235.76 million units of account, broken down as follows:
(1) Borrowed funds
- available at beginning of year - product of loans floated in 1972 - premature repayments
(2) Own funds
- repayments of earlier loans
45.29 185.56 0.25
4.66
231.10
4.66 235.76 As in 1971, these funds were used for loans to industry under Article 54 of the Treaty, for redevelopment and reconversion projects approved under Article 56. and the building of workers' housing. The loans to industry and those for redevel-opment and reconversion projects were disbursed wholly from borrowed funds and the housing loans from the ECSC's own resources, except for a sum of 0.92 million units of account drawn from borrowed funds.
In the same period, total loans rose to 188.50 units of account (as against 112.19 million units of account in 1971).
The funds available at 31 December 1972 permitted substantial disbursements to be made in the first quarter of 1973 for a number of loans approved in the last few months of 1972.
TABLE 5
Loans paid out in 1972
(In million units of· account)
Ger- Nether- Luxem-
Commu-Sector many Belgium France Italy lands bourg nity
(F. Rep.)
I - Coal industry 7.61
-
- - - - 7.61Iron and steel industry 43.37 15.33 41.09 24.29 9.56
-
133.58Generating plants - - 7.06 -
-
-
7.06- -
, _Total 50.98 15-33 48.15 24.29 9.50 - 148.25 II - Industrial redevelopment
and reconversion 18.66 - 12.43
-
1.31-
32.40 III - Workers' housing 2.26 1.20 2.66 1.44-
0.29 7.85[image:14.568.69.488.428.763.2]
1. Industrial loans (Article 54)
1972 was marked by a considerable increase in the loans granted for industrial programmes, as provided for in Article 54 of the ECSC Treaty. This increase applied both absolutely and as a percentage of total lending.
Loans of this type disbursed in the course of the year totalled 148.25 million units of account (as against 66.99 million units of account in 1971).
The normal interest rate of 8 1/4%, fixed in March 1970, was reduced to 7 3/4% as from 1 March 1972 and then to 7 1/2% as from 13 July 1972.
Pursuant, however, to a decision by the Commission published in the Official Journal of the European Communities on 18 June 1970, certain loans are eligible for a reduced rate of interest for the financing of investment which is deemed to be of particular advantage to the Community.
In 1972 this preferential rate was reduced from 5 1/2% to 4 3/4% and then to 4 1/2%; it is fixed at 3 points below the normal rate.
Loans to industry which may be granted by the Commission at the reduced rate must be intended either:
- for investment resulting from government measures in the interests of safety and health (nuisance control, for example), particularly when the cost of such investments imposes an excessively unequal burden on the existing installations of similar enterprises in the various regions;
- for investment of a multinational nature which, conforming to the criteria laid down by the Commission as regards structures, would help to promote the Community integration of ECSC enterprises, on condition that projects of this nature are still subject to tax, legal or administrative disadvantages;
- for investment having as its object the elimination of bottlenecks affecting an entire ECSC industry and which fall within the framework of the general objec-tives and Community policies laid down for the sectors in question;
- for investment having as its object the establishment of research or vocational training centres within the ECSC field.
The loans to industry disbursed in 1972 were earmarked for financing the following programmes:
In the coal-mining industry:
- Pithead power plant using low-grade products of the coal-mining industry: Charbonnages de France, Paris (Houilleres du Bassin de Lorraine), Charbonnages de France, Paris (Houilleres du Bassin de Blanzy);
- Modernization of coking plant:
Ruhrkohle Aktiengesellschaft, Essen (coking plant near Oberhausen, Essen and Dortmund).
In the iron and steel industry:
- Establishment of coking capacities:
14
August Thyssen-Hiitte A.G., Duisburg-Hamborn (Duisburg-Hamborn works); Sidmar Maritieme Staalnijverheid, Ghent;
Societe Dunkerquoise de Cokefaction S.A. Paris (Dunkerque works);
Societe Marseillaise de Cokefaction "Marcoke" S.A. Paris (Fos-sur-Mer works); Italsider S.p.A., Genoa (Taranto works);
:___ Production of pig-iron and steel:
Fried. Krupp Hiittenwerke A.G., Bochum (Rheinhausen works); Mannesmann A.G., Dusseldorf (Huckingen works);
Fabbrica Italiana Ferrotubi S.p.A., Milan (Trigoso works). - Manufacture of long products:
Stahlwerke Roehling-Burbach GmbH, Volklingen/Saar (Burbach works); S.A. Cockerill-Ougree-Providence et Esperance-Longdoz, Seraing-Liege (Mar-chienne and Athus works);
S.A. Usines Metallurgiques de St. Eloi, Thy-le-Chateau;
Wendel-Sidelor S.A., Hayange (St. Jacques rolling mill in Hayange). - Manufacture of flat products:
A.G. der Dillinger Hiittenwerke, Dillingen/Saar; Rasselstein A.G., Neuwied/Rhine;
Stahlwerke Bochum A.G., Bochum.
- Comprehensive programmes in coastal works: Italsider S.p.A., Genoa (Taranto works);
Solmer-Societe Lorraine et Meriodionale de Laminage Continu, Paris (Fos-sur-Mer works).
Manufacture of high-carbon steels and special steels:
Compagnie des Forges de Chatillon-Commentry-Biache S.A., Paris (Isbergues works); .
Pechiney-Ugine-Kuhlmann, Paris (Fos-sur-Mer works).
-Some of these loans were eligible for the reduced rate of interest. As in 1971, the Commission continued to encourage the establishment of coking capacity to com-pensate for current or imminent closures. The same financing facilities were granted to multinational projects which helped to promote the· Community integration of ECSC enterprises. For the first time, a decision was taken by the Commission to grant a reduced-rate loan to an investment programme for environmental protection.
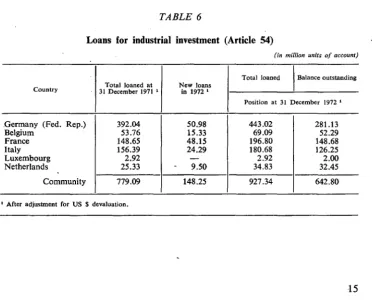
TABLE 6
Loans for industrial investment (Article 54)
(in million units of account)
Total loaned
I
Balance outstanding Country 31 December 1971 Total loaned at 1 New loans in 1972 1Position at 31 December 1972 1
.Germany (Fed. Rep.) 392.04 50.98 443.02 281.13
Belgium 53.76 15.33 69.09 52.29
France 148.65 48.15 196.80 148.68
Italy 156.39 24.29 180.68 126.25
Luxembourg 2.92 - 2.92 2.00
Netherlands 25.33 •· 9.50 34.83 32.45
Community 779.09 148.25 927.34 642.80
[image:16.568.92.465.432.735.2]2. Loans for industrial redevelopment and reconversion (Article 56)
Financing of redevelopment and reconversion projects decreased slightly in 1972. Loans disbursed totalled 32.40 million units of account (as against 44.69 million units of account in 1971).
Redevelopment and reconversion loans may enjoy special terms, as described above. The annual interest payable on them is 4 1/2% for all or part of the loan granted. This preferential rate is given for the first five years of the loan, with special regard to the number of jobs which will be created. The normal rate of 7 1/2% is payable from the sixth year. As in the previous year, redevelopment and reconversion projects were financed out of borrowed funds.
In accordance with the undertakings given by the new industries or other bodies receiving loans, a proportion of the new jobs created is reserved in the first instance for workers made redundant by industries falling within the scope of the ECSC Treaty. Applications for redevelopment and reconversion loans are submitted to the Com-mission, under the terms of the Treaty, by the Government of the Member Country concerned. The geographical distribution of loans granted largely complies with national policies for the redevelopment of mining, and sometimes steel, areas in decline. ECSC financial aid for redevelopment and reconversion in Germany has concentrated mainly in the Ruhr Basin, where loans granted are helping to improve the under-diversified nature formerly characteristic of the structure of this basin. In the Netherlands, this aid has centred on Limburg province and is now drawing to a close with the completion of redevelopment in the area. In France, where coal resources are spread over several areas of varying size, the loans were more widely distributed.
The Commission made 16 loans for industrial redevelopment and reconversion, to the following recipients, grouped by region:
Germany (Fed. Rep.)
- North Rhine-Westphalia Ceramic ware, glass, lime and stone
-Saar
France
- Northern region
- Rhone-Alpes region
Netherlands
- Limburg province
- Erste Deutsche Floatglass GmbH & Co. Chemicals
- Schering A.G., Berlin and Bergkamen (Berg-kamen works);
- Veba-Chemie A.G., GelsenkirchenjBuer; Mechanical engineering
- GEA Luftkiihlergesellschaft Happel GmbH & Co (Wanne-Eickel works);
- W. Schlafhorst & Co., Monchengladbach (Ubach-Palenberg works);
Motor vehicle manufacture
- A. Ehrenreich & Co., Diisseldorf/Oberkassel; - Hackforth & Co., Wanne-Eickel;
Paper, graphic industries
- Fritz Peters & Co., K.G., Kapellen, Kreis Moers ( Gelsenkirchen works);
Iron and steelworks
- Stahlwerke Bochum A.G., Bochum
- Fried. Krupp H-iittenwerke A.G., Bochum (Rheinhausen works).
Iron and steelworks
- A.G. des Dillinger Hiittenwerke, Dillingen. Motor vehicle manufacture
- S.A. Simca-Nord, Paris (Valenciennes works); - Chausson-Carosserie S.A., Asnieres-sur-Seine
(Maubeuge works); Motor vehicle manufacture
- Automobiles M. Berliet, Lyon (Andrezieux- · Boutheon works).
Textiles and clothing
- N.V. Ornatex, Kerkrade;
Table 7 below summarises these types of loans both by country and by industry.
TABLE 7
Loans for industrial redevelopment and reconversion (Article 56)
A - Breakdown by country
Country 31 December 1971 Total loaned at 1
Germany (Fed. Rep.) 66.07
Belgium 33.98
France 41.81.
Italy 26.37
Luxembourg
-Netherlands 25.13
Community 193.36
1 After adjustment for US $ devaluation.
B - Breakdown by industry
Type
Motor vehicle manufacture Chemicals
Iron and steel works Non-ferrous metals Industrial estates Power stations Rubber
Electrical equipment Paper and· printing Mechanical engineering
Articles of cast iron, steel and other metals Ceramic ware, glass, lime and stone Textiles and clothing
Conversion of plastics Aeronautical engineering Foodstuff industries Steel construction Transport
Joinery and furniture manufacture Miscellaneous
New loans in 1972
18.66
-12.43 -1.31 32.40 Total(in million units of accounts)
Total loaned
I
Balance outstandingSituation at 31 December 1972 1
84.73 33.98 54.24 26.37 -26.44 225.76 Amount (in units of ace.)
49.89 34.17 22.02 21.93 21.80 17.52 15.88 7.36 6.81 5.78 5.65 5.63 2.45 1.76 1.60 1.15 1.09 0.94 0.89 1.45 225.77 80.81 29.12 51.58 18.51 -22.95 202.97 % 22.10 15.13 9.75 9.71 9.66 7.76 7.03 3.26 3.02 2.56 2.50 2.49 1.09 0.78 0.71 0.51 0.48 0.42 0.40 0.64 100.00
3. Loans for housing (Article 54, 2)
1972 saw a continuation in the policy of financing housing. These loans are generally granted from the ECSC's own funds at a rate of 1% and on a long term basis. As a rule they are furnished in the currency of the country concerned to avoid any exchange risks to the recipients. They are sometimes combined with loans granted
[image:19.568.91.486.148.663.2]either by financial establishment~ or by the ECSC at the normal rate from borrowed funds.
Own resources paid out by the Commission in 1971 and 1972 for the implementation of the 7th ECSC housing programme totalled 13 million unitS: of account, of which 1.6million were allotted to the experimental programme for renovating old accommoda-tion. In connection with contracts concluded within this programme, 5 million units · of account were paid out in 1972, depending on the stage of construction reached in the projects, as part of the normal programme, and 0.64 million units of account were paid out as part of the experimental programme. To fulfill earlier commitments under the 6th programme, a total of 1.29 million units of account was made available to the recipients.
The loans disbursed at a rate of 1% thus totalled 6.93 million units of account in 1972 (as against 0.52 million units of account in 1971), which was supplemented by a total of 0.92 million units of account from borrowed funds, at the normal rate applicable at the time the contract was concluded.
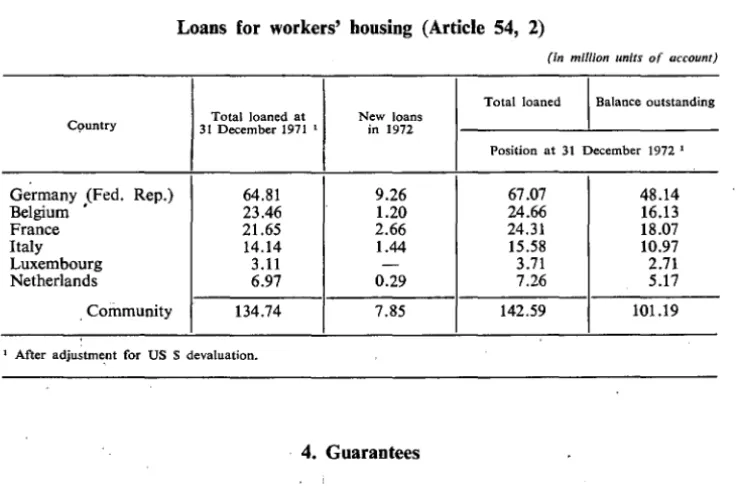
TABLE 8
Loans for workers' housing (Article 54, 2)
(In million units of account)
Total loaned
I
Balance outstanding C9untry 31 December 1971 Total loaned at 1 New loans in 1972Position at 31 December 1972 1
Germany (Fed. Rep.) 64.81 9.26 67.07 48.14
Belgium ' 23.46 1.20 24.66 16.13
France 21.65 2.66 24.31 18.07
Italy 14.14 1.44 15.58 10.97
Luxembourg 3.11 - 3.71 2.71
Netherlands 6.97 0.29 7.26 5.17
. Community 134.74 7.85 142.59 101.19
1 After adjustment for US $ devaluation.
4. Guarantees
The ECSC Treaty provides that the Commission may also facilitate the implemen-tation of enterprises' investment programmes by guaranteeing loans obtained by them from outside sources.
[image:20.568.90.458.302.545.2]This kind of objective is clearly not exclusive, since the Treaty gave the Commission the task of assisting the financing of investment by enterprises by this method as well as by the granting of loans. The risks involved in the use of this method could not, however, be borne by the joint assets of the ECSC unless it were impossible to finance certain investment projects by other means, either at national or Com-munity level, or unless the general interest recommended that these projects be completed in the shortest possible time and at minimum expense.
The Commission charged for such guarantees has been kept so low that its effect on these operations has been extremely small. No new requests for guarantees were received in 1972. As a result, regular and accelerated repayments on loans previously granted, to a total of 48.53 million units of account, reduced the remaining commit-ment to 24.14 million units of account at 31 December 1972.
5. Overall survey of direct lending operations and guarantees (1954-1972)
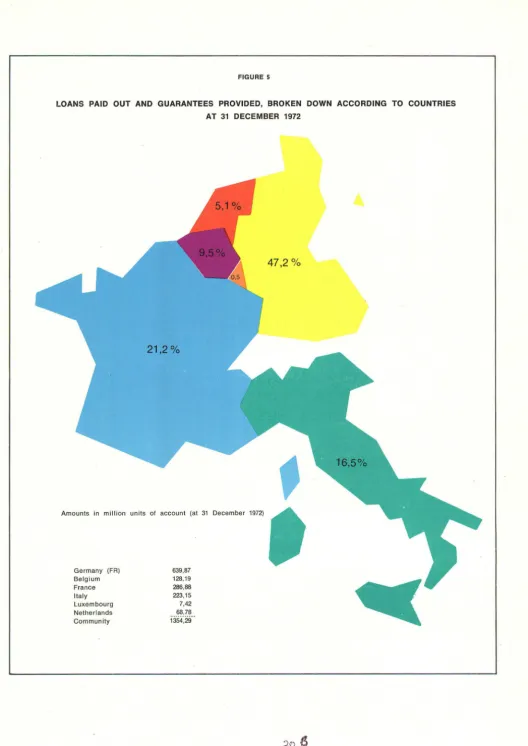
From the start of its financing activities to 31 December 1972, the ECSC granted loans to a total of 1 305.76 million units of account: 1 192.98 million from borrowed funds and 112.78 million from its own resources.
Including guarantees furnished over the same period, the total amount of ECSC financial.assistance was 1 354.29 million units of account (as against 1196.15 million to the end of 1971).
Table 9 below gives a detailed breakdown of this assistance by sector and by country. TABLE 9
Loans paid out and guarantees granted up to 31 December 1972 by investment category and country
(initial amounts) 1
(in million units of account)
Loans
Total from
I
fromI
Guaranteesloans %
borrowed own Total +
funds resources guarantees
A - Type of investment
Coal industry 290.39 - 290.39
-
290.39 2I.44Iron-ore mines 28.IO
-
28.IO-
28.IO 2.07Iron and steel industry 601.94 - 601.94 48.23 650.17 4S.OI Industrial redevelopment
and reconversion 2I8.75 7.02 225.77 - 225.77 16.67 Workers' housing 46.89 95.69 I42.58 - I42.58 I0.53
Miscellaneous 6.91 10.07 I6.98 0.30 I7.28 1.28
Total I I92.98 112.78 1 305.76 48.53 I 354.29 100.00
B -Country
Germany (Fed. Rep.) 540.93 6I.12 602.05 37.82 639.87 47.25
Belgium 123.62 4.57 128.I9 - 128.I9 9.46
France 250.67 25.80 276.47 I0.41 286.88 2I.l8
Italy 213.97 8.88 222.85 0.30 223.I5 I6.48
Luxembourg 4.62 2.80 7.42 - 7.42 0.55
Netherlands 59.I7 9.61 68.78
-
68.78 5.08Community 1 I92.98 112.78 1 305.76 48.53 1 354.29 100.00
1 After adjustment for US S devaluation.
[image:21.568.91.476.389.790.2]1400
1300
1200
1100
1000
900
800
700
600
500
400
300
200
100
FIGURE 4
LOANS PAID OUT AT 31 DECEMBER 1972, BROKEN DOWN ACCORDING TO SECTORS
Amounts in million units of account
Readaptation and industrial redevelopment and reconversion
[image:22.568.15.552.18.673.2]FIGURE 5
LOANS PAID OUT AND GUARANTEES PROVIDED, BROKEN DOWN ACCORDING TO COUNTRIES AT 31 DECEMBER 1972
21,2%
Amounts in million units of account (at 31 December 1972)
Germany (FR) Belgium France Italy Luxembourg Netherlands Community
639,87 128,19 286,88 223,15 7,42
___ 68,7_8 __
1354,29
IV - CHANGES IN RESERVES AND PROVISIONS, MANAGEMENT OF LIQUID ASSETS
Table 10 below shows the changes in ECSC reserves and provisions between 31 December 1971 and 31 December 1972.
TABLE 10
Changes in reserves and provisions
I - a) Guarantee Fund b) Special Reserve II - Pension Funds III - Provisions
a) for readaptation b) for research c) assistance (Art. 56) d) assistance (Art. 54) IV - Other provisions
Total V - Unallocated balance
Grand Total
Position at 31 December
1971 100.00 87.00 25.65 67.05 23.05 9.98 3.03 14.57 330.33 0.71 331.04
(in million units of account)
Changes in 1972
-+
0.21+
0.67+
3.15+
0.52+
3.51+
3.08+
11.14- 0.52
+
10.62Position at 31 December
1972 100.00 87.00 25.86 67.72 26.20 10.50 6.54 17.65 341.47 0.19 341.66
As the table shows, the surplus of revenue over expenditure, amounting to 10.62 million units of account, plus a sum of 0.52 million units of account taken from the unallocated balance, was allocated to provisions and pension funds.
Revenue consisted mainly of:
(a) the levy, which has been fixed at the rate of 0.29% since 1 January 1972 (as against 0.30% in 1971).
Income from the levy totalled 47.21 million units of account in 1972 1 as against
37.77 million in 1971.
This increase of 9.44 million units of account is due, on the one hand, to the marked economic recovery in the iron and steel sector and, on the other, to the increase in all the average values used as the basis of assessment.
(b) income from the management of liquid assets.
Whilst their objective is an optimal yield on the assets of the ECSC, these activities have to take into account a number of restricting factors, viz.:
[image:24.564.73.449.181.409.2]- the need for security. For this reason all short-term. deposits are made with ·first-rate banks and longer-term investments are in government and other public
bonds;
- the social aspects of certain financial assistance, for example loans for the construction of workers' housing which the ECSC grants out of its own funds at a reduced rate of interest considerably lower than the rates current on money markets.
Revenue from interest on funds invested totalled some 14.8 million units of account in 1972 as against 16 million in 1971. This reduction in revenue was due to the lowering of rates in the money markets of the Member States. An increase in the liquid assets available on these markets had already been noted towards the end of 1971, and this led to a reduction in interest rates in the first nine months of 1972. Interest earned and revenue from the levy are complementary sources of funds; together they have been used to finance outright aid (readaptation, technical research, aid to coke and coking coal, etc.) and reduced rate loans, in accordance with the social, regional and industrial objectives of the Community.
The financial actiVltles reviewed in this report were made possible by the active assistance of banking groups and ECSC agents in the various Member States, to whom the Commission expresses its sincere gratitude. At the same time it wishes to thank the Bank for International Settlements in Basle for its continued and efficient cooperation as a depository for transactions under the 'Act of Pledge.' 1
1 A contract of surety concluded by the ECSC at the start of its operations in favour of its fund
raisers in order to provide access to the international market. The Act of Pledge governs all loans contracted before 1961, when the ECSC obtained the consent of its lenders to issue its loan stock without special surety.
ANNEXES
I. MAIN CHARACTERISTICS OF LOANS CONTRACTED TO 31 DECEMBER 1972.
II. BALANCE SHEET AT 31 DECEMBER 1972.
Annex I
MAIN CHARACTERISTICS OF LOANS
Initial Amount
Year Interest Term Balance outstanding
of % p.a. (years)
I
equivalent in EMA of account
at 31 December 1972 issue in currency of Joan (in EMA units of account)
1954 37/s 25
us$
1 00 000 000 92105 626 38 039 6241957 51/2 18 25 000 000 23 026 407 5 526 338
1957 5 5 10 000 000 9 210 563
-1958 5 20 35 000000 32236 969 13171105
1958 41/2 5 15 000000 13 815 844
-1960 53/s 20 25 000 000 23 026407 12 388 207
1960 43/4-5 3-5 10 000 000 9 210 563
-1962 51/4 20 25 000000 23 026407 15 427 692
1964 51/4 20 30000000 27 631 688 22 105 350
1966 61/2 20 15 000 000 13 815 844 12 894 788
1966 61/2 20 20 000000 18 421125 17 177 699
1967 61/2 20 25 000000 23 026407 23 026 407
1967 65/s 20 20000 000 18 421125 18421125
1971 73/4 15 20000 000 18 421 125 18 421125
1972 7 16 (*) 30 000 000 27 631 688 27 631 688
373 027 788 224 231 148 1955 33/4 25 DM 50 000 000 13 561 202 5 435 738
1957 41/.l 20 2 977 450 813 511 264 391
1964 53/4 12 100 000 000 27 322404 12 295 082
1964 51
/2 15 100000 000 27 322 404 15 983 607
1964 53/4 12 30000 000 8 196 722 3 278 689
1965 51/2 18 150 000000 40983 607 34 699 454
1965 51/2 5 23 000000 6284153
-1967 63/4 5 30 000000 8 196 722
-1968 61/2-67 /s 10 120 000000 32 786 885 24 590164
1968 61
/4 13 60 000 000 16 393 443 14 754 098
1969 61 /4 15 40000 000 10 928 961 10 928 961 1969 61/2 13 50 000 000 13 661 202 13 661 202 1969 63/4 15 50000000 13 661 202 13 661 202
1971 71/z 15 100 000 000 27 322 404 27 322 404 1972 61/2 15 100000 000 27 322404 27 322404
1972 7 16 150 000000 40 983 607 40 983 607
315 840 833 245 181 003 1963 51/2 20 Lit. 15 000 000 000 24000000 17 600000
1966 6 20 15 000 000 000 24 000000 22 400 000
1966 6 20 15 000 000 000 24000000 22400000
1968 6 20 15 000 000 000 24000000 24 000000
1968 6 20 15 000 000 000 24000000 24 000000
1972 7 15 20 000 000 000 32 000 000 32 000000 1972 7 15 20 000 000 000 32 000 000 32 000 000
184000000 174 400000
1957 31/z 25 BFr 200 000.000 4 000000 2 044 000
1957 31/2 25 20 000000 400000 204400
1962 51/4 20 300000000 6 000000 4 200000
1963 51/2 20 300000000 6 000000 4 620 000
1968 63
/4 15 750 000000 15 000000 15 000000
1970 83
/4 20 500000000 10 000 000 10 000 000
1971 73/4 15 700 000 000 14 000 000 14 000 000
55 400 000 50 068 400
1970 8 15 ll 1 50000000 50000000 50000 000
1964 5 20 FFr 150 000 000 27 006 638 20254 978 1971 81/2 18 150 000 000 27 006 638 27 006 638 1972 71/4 15 150 000 000 27 006 638 27 006 638 1972 71/2 16
* 60000 000 10 802 656 10 802 656
91 822 570 85 070910 Carry
forward 1 070 091 191 828 951 461
CONTRACTED TO 31 DECEMBER 1972
Initial Amount
Year Interest Term Balance outstanding
of % p.a. (years)
I
equivalent in EMA of account
at 31 December 1972 issue in currency of loan (in EMA units of account)
Brought
forward 1 070 091191 828 951 461 1961 41/2 20 Fl. 50 000000 13 812155 8 259 668
1961 41/2 5 10000 000 2 762 431
-1962 43/4 25 6 000000 1 657 459 994 475
1962 43/4 20 25 000 000 6 906077 4 627 072
1962 41/2 5 20 000000 5 524 862
-1963 41/2 5 10000000 2 762 431
-1963 45fg 30 1 750 000 483 425 339 227
1964 53/4 20 25 000 000 6 906 077 5 538 674 1965 53/4 20 40 000000 11 049 724 9 585 635
1967 63/s 5 20000 000 5 524 862
-57 389 503 29 344 752
1957 31/2 25 LFr 5 000000 100000
-1957 53/s 25 100 000 000 2 000 000 1 222 245 1961 51/4 25 100 000 000 2 000000 1 553 340
1961 5 25 100000000 2 000000 1 544 111
1962 43/4 15 300000 000 6 000 000 3 000 000
1962 51/s 25 250 000 000 5 000 000 4 058 157
1964 53/s 20 150000000 3 000000 2 400000
1971 61/2 8 150 000000 3 000000 3 000 000
1971 7 15 250000 000 5 000 000 5 000 000
1971 73/4 12 300000 000 6000 000 6 000000
1972 63/4 14 300000 000 6 000 000 6 000 000 1972 63/4 17 400 000000 8 000 000 8 000 000 1972 61/4 18
*
300000 000 6 000000 6000 00054100000 47 777 853
1956 41/4 18 SFr 50000000 12 242 600 2 142 455
1961 51/4 5 9 000000 2 203 668
-1961 41/2 5 2 290000 560 711
-1962 41/2 18 60 000000 14 691119 9 181 950
1969 51/2 18 60000 000 14 691 119 14691119
1972 61/4 12 50000 000 12 242 599 12 242 599
56 631 816 38 258 123 1966 53/4 20 u.a. 2 20 000000 20 000000 18 700 000
1 258 212 510 963 032 189
1 The European Monetary Unit CI!D is a unit of account, the value of which is fixed invariably at DM.3.66 or Bfr. 50 or Ffr. 5.55419
or Lit. 625 or Lfr. 50 or Fl. 3.62 depending on the choice of the holder.
1 At present, this unit of account has the same value as that used by the former European Payments Union, as defined in Article
Annex II
BALANCE SHEET OF THE EUROPEAN COAL AND STEEL COMMUNITY AT 31 DECEMBER 1972
ASSETS
I. Disbursed loans
II. Cash and banks
III. Short and medium term invest-ments
IV. Portfolio
v.
Real EstateVI. Recoverable issuing costs
VII. Miscellanea us
VIII. Accrued income
Suspense accounts
I. Amount due on bonds
II. Liability of enterprises under guarantees
958 433 510.17
195 261 248.79
27 149 488.91
54 504 754.50
120 141.62
17 580 346.64
28 486 476.65
25661159.34
I 307 197 126.62
44 434 343.31
24 137 367.89
Auditor's Note
I. Borrowings II. Reserves
A. Guarantee fund
B. Special Reserve ~II. Provisions
A. Financial Aid
B. Other provisions IV. Former Pension Fund
V. Miscellaneous VI. Accrued liabilities VII. Unallocated balance
Suspense accounts
I. Amount payable on bonds II. ECSC's liabilities under
guarantees
100 000 000.-
87000000.-110 614 973.10 18 008 491.15
44 434 343.31
24 137 367.89
LIABILITIES
918 597 846.03
187 000
000.-128 623 464.25
25 859 894.93
24 538 493.28
22 396 878.88
180 549.25
1 307 197 126.62
European Coal and Steel Community For the Commission of the European Communities
F. GILLET
Director General of Credit and Investments
G. MINES
Director
Borrowings and Liquid Assets
Notes to tbe Balance Sbeet at 31 December 1972
ASSETS
I. Disbursed loans
A. Loans from borrowed funds - in US dollars
- in (W.) German marks - in Italian lire
- in Belgian francs - in Dutch guilders - in French francs - in units of account - in Swiss francs - in Luxembourg francs - in EMA units
B. Other loans
- from the Special Fund for the financing of workers' housing projects
- from the Social Fund for industrial redevelopment and reconversion
- from funds allocated for readaptation
- from funds allocated for technical research - miscellaneous
IV. Portfolio
Equivalent in u.a.
196 599 460.26 204 197 396.54 169 056 324.81
49108400.-29 344 751.41 73 840 037.87. 18 700000.-38 258 122.98 40 177 853.16
50000000.-74 283 693.15
3 399 620.79
394 762.41
2 308 795.49 . 8 764 291.30
Total investments amount to 54 504 754.50 units of account.
V. Real Estate
869 282 347.03
89 151 163.14
This item includes property owned by the ECSC. This consists of:
1. A building in Paris (in co-ownership with the other two European Communities); 2. A building in London held by th~ Community on long-lease tenure; and 3. A building in Washington, the purchase price of which has been written off by
VI. Recoverable issuing costs
The figure of 17 580 346.64 units of account represents the portion of issuing costs on current loans which has not yet been written off. Issuing costs are recovered in annual instalments throughout the term of the Icians.
VII. Miscellaneous
This entry of 28 486 476.65 units of account consists of:
1. 3 884 505.52 units of account due from debtors subject to the ECSC levy; 2. 986 484.55 units of account due from debtors various;
3. 23 615 489.58 units of account, funds earmarked for the payment of overdue coupons and drawn bonds.
VIII. Accrued income
This item consists of:
t
25 661 159.34 units of account, interest and fees receivable but not yet due on 31 December 1972.2. 3 991 698.36 units of account, ECSC levy claimed over the month of December and falling due after 31 December 1972.
LIABILITIES
I. Loans
- in US dollars
- in (W.) German marks - in Italian lire
- in Dutch guilders - in Belgian francs - in Swiss francs - in French francs - in units of account - in Luxembourg francs - in EMA units
III. Provisions
A. Financial assistance
1. For readaptation
Equivalent in u.a. 196 599 460.26 245 181 003.11 174 400 000.-29 344 751.40 50 068 400.-38 258 122.97 74 268 255.13 18 700 000.-41777853.16
50000000.-· - commitments entered into for outright grants
2. For technical and economic research
- commitments entered into for outright grants
3. Assistance under Art. 56 ·
4. Assistance under Art. 54
B. Other provisions
918 597 846.03
67 718 337.64 26 197 013.98 10 502 914 72
IV. Former ECSC Pension Fund
This item totals 26 859 894.93 units of account. From 5 March 1968 commitments
for the payment of ECSC pensions were transferred to the Member States.
V. Miscellaneous
Of the total, a sum of 23 615 624.31 units of account refers to bonds and coupons due and commissions payable on them. The remainder of 922 868.97 units of account refers to miscellaneous credit-accounts at the end of the business year.
VI. Accrued liabilities
This item comprises interest and fees payable but not yet due on 31 December 1972, totalling 22 396 878.88 units of account.
VII. Unallocated balance
The sum of 180 549.25 units of account under this heading represents unallocated excess of income over expenditure.
Annex ill
EUROPEAN COAL AND STEEL COMMUNITY REVENUE
AND EXPENDITURE FROM 1 JANUARY 1972 TO 31 DECEMBER 1972
(including Revenue and Expenditure in connection with Borrowing and Lending Operations)
EXPENDITURE
A. Servicing of loans and guarantees
B. Budgetary expenditure
- Administrative expenditure
- Expenditure for research
- Expenditure for readaptation
- Assistance to coke
C. Other expenditure
- Financial expenses
- Assistance under Art. 56 - Assistance under Art. 54
- Miscellaneous
D. Excess of revenue over expenditure
Transferred to unallocated balance Excess balance
New allocations for various provisions:
- Pension Fund .
- Financial Assistance
- Other Funds
18 000 000.-11 638 789.78 14 518 629.26 1 700
800.-278 725.06 2 462 908.78 850 337.12 1 530 067.71
533 345.25 10 618 304.17
208 449.32 7 498 452.34 3 444 747.76
Auditor's Note
57 601 597.71
45 858 219.04
5 122 038.67
10 618 304.17
119 200 159.59
11 151 649.42
11 151 649.42
A. Servicing of loans and guarantees B. Levy income
C. Other revenue
- Interest on deposits and port-folio investments
- Miscellaneous
14 770 266.28 290 947.26
REVENUE
56 930 056.28
47 208 889.77
15 061 213.54
119 200 159.59
European Coal and Steel Community
for the Commission of the European Communities
F. GILLET G. MINES
Director General Director ,
of Credit and Investments Borrowings and Liquid Assets
Notes to the Statement of ECSC Revenue and Expenditure for the period 1 January 1972 to 31 December 1972 (units of account)
EXPENDITURES
A. Expenditures on the servicing of loans and guarantees totalling 57 601 597.71 units of account is broken down as follows:
Interest on borrowed funds Fees to agent banks Miscellaneous
Repayment of recoverable issuing costs
REVENUES
53 177 636.94 951 072.93 421 558.45 3 051 329.39
B. Revenues from the servicing of loans and guarantees totalling 56 930 056.28 units of account is broken down as follows:
Interest on loans Guarantee fees Miscellaneous
52 145 340.32 121 949.46