Rochester Institute of Technology
RIT Scholar Works
Theses
Thesis/Dissertation Collections
2004
Clarifying Meal Planning Information
John D. Tran
Follow this and additional works at:
http://scholarworks.rit.edu/theses
This Thesis is brought to you for free and open access by the Thesis/Dissertation Collections at RIT Scholar Works. It has been accepted for inclusion
in Theses by an authorized administrator of RIT Scholar Works. For more information, please contact
Recommended Citation
Graduate
Graphic Design MFA Program
School
ofDesign
Rochester Institute
ofTechnology
College
ofImaging
Arts
andScience
A Thesis
submittedto theFaculty
oftheCollege
ofImaging
Arts
andSciences
in candidacy
for
thedegree
ofMaster
ofFine Arts
Clarifying
Meal
Planning
Information
John D. Tran
Chief Advisor
Associate Advisor
Chairperson
MFA Candidate
Approvals
Bruce
Ian Meader
Associate
Professor
Sc
hool
of Des
ign
Bruce Ian Meader
S
igna
ture
Professor Deborah Beardslee
Associate
Professor
Sch
ool of D
esign
Deborah Beardslee
S
i
gna
ture
Professor Barbra Cerio-Iocco
Associate
Professor
Coll
ege
of Applied
Science and Tec
hnology
Barbra Ceria-Iocca
S
i
gna
tur
e
Patti J. Lachance
Ass
ociate Professor
Sch
ool
of D
es
ign
Patti J Lachance
S
ignature
Date
Dat
e
I
,
John
D.
Tran,
h
e
r
e
by grant permi
ss
ion to the
Wallace Memorial Library,
of th
e
Roc
hester In
s
titute
of Technology
to reprodu
ce m
y
th
esis
in
whole
or in part. An
y r
e
production
will
not he
for comm
e
r
c
ial u
se
or for profit.
John Tran
Acknowledgements
Dedication
This
thesis
is
dedicated
to
my
motherfor her
unconditionallove,
and eternal
inspiration.
Thank
youfor
showing
mehow
to
appreciatethe
good andbad
aspects oflife.
Special Thanks
A
very
specialthanks
tomy
thesisadvisorsBruce Ian
Meader,
Deborah
Beardslee,
andBarbra Cerio-Iocco for
taking
thisjourney
with me.
Special
thanks tomy
fanuly
for
theirnever-ending
support,
Table
of
Contents
5
Project
Definition
8
Precedents
12
Research
33
Synthesis
37
Ideation
51
Intermediate
Evaluation
55
Implementation
59
Dissemination
60
Retrospective
Evaluation
62
Conclusion
64
Glossary
ofTerms
66
Bibliography
68
Appendices
Appendix A: Final Design Application
Appendix B: User Needs
Survey
Appendix
C: Literature Evaluation
Survey
Appendix
D:
Consumption
Survey
Appendix E: Color Correlation
Survey
Appendix
F: Intermediate
Evaluation
Survey
Project
Definition
Situation
It
was a son'slove for his
motherthat
generatedideas
todrive
this thesisfrom
conceptionto
completion.His
motherwasdiagnosed
withType 2
diabetes in
the
summer of2003.
To
combatthisdisease,
his
motherhad
to
restructureher eating habits.
Changing
eating
habits is
adifficult
taskin itself. Not
being
ableto
understand theinformation
that shouldhelp
one undergothismetamorphosis makesthis taskalmost
impossible.
Being
a native of
Vietnam,
his
motherhas
very
limited English
skills,
which addedto
theconfusionthatsurfacedfrom
trying
to
comprehendthemealplanning literature
thatwas giventoher
afterdiagnosis.
A diagnosed diabetic
must overcomedenial
toimprove
or maintaintheir
health. Denial
canbe
eliminatedby
enlightenmentthroughinformation.
This
newly
gainedknowledge
should comfortdiabetics. If
thisinformation
is
not presentedin
a mannerthathelps diabetics
accept and managethis
disease,
confusion will result.Confusion
can senddiabetics
back
toa state ofdenial
and can alsodirectly
affect adiabetic's health
status.Problem
Statement
The literature
that
is
readUy
made avaUabletodiabetics
afterdiagnosis
is limited
andinundated
with communicationflaws. This leaves
thenewly
diagnosed
person withvery
few
sourcesfor information
and a plethora of sourcesthat areconfusing
andfrustrating. The free
literature
usedtohelp
diabetics
with theirmealplanning
process containsseveral communication
flaws. Because
this materialis
free,
printing
expenseis
a significantissue. In
an attempt toreach all possibleusers,
somemeal
planning
systemstry
toincorporate
toomuchinformation into
each piece.When
information
overloadoccurs,
users are presented with toomany
facts,
whichcan resultin
confusion and misunderstanding.This is
alsotruewhenthereis insufficient
information,
whichis
anotherproblem with current meal
planning
systems.In
an alternative approach tocut cost ofmanufacturing,
some materialslack imperative information
due
toproductionissues.
Including
moreinformation
would resultin using
more materials such as paper and
ink,
increasing
thecost of production.This
situation alsofosters
confusion anddoes
not meetintended
Problem
Definition
Profit
is
another problem that also plagues current mealplanning
systems.
There
arefew
mealplanning
systemsthat
arefree
orinexpensive.
Another
problem existsin inadequate definition
ofthe
intended
user.Most
mealplanning
systems are eithertoogeneralortoo
specific.Materials
that
aretoo
general callfor
more userinteraction
andthereforesubjectto
human
misinterpretation and error.Systems
thataretoo specificcommunicate
only
to
a certainaudience;
thiscreatesanunnecessary
distinction
among
health
consciousindividuals. Current
mealplanning
systems often suffer
from
variousdesign
problems;
typography,
content,
organization and structure.
To
resolvetheseproblem,
s a new structured mealplanning
systemwas
designed
to
help
clarify
nutrition managementfor
various users.This
simplified mealplanning
systemdoes
notdiscriminate
with respecttopotential users.
This
thesis
focuses
onthe needs ofType 2
diabetics;
however,
the
general public can also use thefinal
application.Potential
usersinclude
dieters,
obeseindividuals,
heart
attackvictims,
and evenindividuals
who strive
for
healthy
eating
habits. This is
achievedthrougha simple substitution of nutrition measurement values.For
example,
caloriescan
be
substitutedfor
carbohydrates or grams offats,
based
ontheneeds ofthe user.This
system wUlhelp
clarify
information
for
various users throughorganization,
as well as combatdiet
trendsandfads
throughmeasurementsubstitution.
Diet
trendsarebased
on current popularmeasurement units.
Through
substitution,
units canbe
changedin
this
system withoutaffecting
meal planning.A
simplified system mustbe
generatedtoease the stressdiabetics
experience
during
their mealplanning
process.This
will providecomfort, ease,
and clarification of essentialinformation. This
system will promotelonger,
healthier
lives for
diabetics,
as well as mentalease,
satisfaction,
and personal well-being.This
mealplanning
structurewillalso act asa platform
for
other mealplanning
systemsdesigned
Problem Definition
Communication
Goals
togainknowledge
ofType 2 diabetes
andthe
importance
of nutrition managementtounderstand
the
nutritional needs ofthose
afflicted withType 2 diabetes
to
develop
aninexpensive,
diabetic
meal
planning
systemthatwillclarify
information
and promotebetter health
Visual Communication
Goals
toserve as a meal
planning
aidfor diabetics
toalleviate stress and
clarify
confusion thatmay
exist withindiabetic
mealplanning
to
help
diabetics feel
more comfortablewiththis
disease
throughcontrolling
nutritionalintake
to
help
the
families
andfriends
ofthose
diagnosed
with
diabetes
understanddiabetic
mealplanning
to
incorporate
systemsthinking
anddata
organization toclarify
mealplanning
information
Precedents
Design Precedents
Massimo Vignelli
Massimo Vignelli
redesignedthe
subway
map
for
theNYC
Transit Authority.
The
newmap
was releasedto
thepublic onAugust
9,
1972. Some
ofVignelli's
work
includes
graphicdesign,
architecturalgraphics,
interior,
furniture
andconsumer product
designs. The
Dady
News
noted onAugust
6, 1972,
"
In
orderto
stressthe transit
routesthemselves,
the
geographicalfeatures
of
the
city
arefaded into
the
background in
mutedgrays,
beiges
and whites.Landmarks
such asthe
East River
are suggestedsymbolically."
Vignelli's
New York
City
subway
map
helped
thedesigner
ofthis
thesisstudy
understand
the
importance
ofsimplifying information.
Including
large
amountsof
text
was notnecessary in
thissituation.Information
withinthe
map
was simplifiedby
using
smallblocks
oftexts,
ratherthansentences.When
possible,
smallerblocks
oftextwere simplifiedusing
abbreviations.The
purpose ofthismap
wasto
help
userstravelmentally
to afinal
destination.
In presenting
the
public withonly
the
essentialinformation,
ambiguity
and confusion werelessened.
Color
wassuccessfully
usedtohighlight
as well asdistinguish
trainroutesfrom
one another.Color
also separatedimportant
foreground information
from
secondary
background information. This
system also stressedthe
importance
ofcolor-coding
detailed information
in
a simplifiedmanner,
whdetaking
into
considerationtheneeds of users.This
aspectof
design
wouldbe
aninfluence
onthedesigner's final
thesisapplication.With
respectto
monumentalfeatures,
such asgeography,
buildings
and other manmade structuresthat
did
notinfluence
communicationgoals,
Vignelli
used symbolism as ato
include
thesefeatures. The
thesis
candidate
learned
that
information
couldbe
condensed withoutaltering
communicationgoalsthrough the useofsymbolism.Design
features did
nothave
tobe literal but
couldbe
symbolic and stillhave
thesame communicative value.The
strengths ofthisprecedenthelped
thedesigner
ofthis thesis
study
realize
different
methods ofclarifying
information.
One
specific strengthis Vignelli's
method ofdistinguishing
imperative information from
superfluous
information.
Another is Vignelli's
answer topresenting
information
in
a mannerthatdid
notinterfere
withthe
communicationgoals of each
design feature.
By limiting
variables,
including
typographic
factors,
colors andshapes,
detailed information
was simplifiedin
a morecomprehensible manner.
Vignelli's NYC Transit
Authority Subway Map
is
astrong
exampleofhow
complexinformation
canbe
presentedwithoutPrecedents
Richard
Saul
Wurman
Richard
Saul Wurman's 1985
publication,
Medical
Access,
illustrates
the
needto
develop
medicalliterature
that
effectively
communicates common medical practices.Wurman
also authored otherhealth
relatedpublications
including
Heart Disease
&
Cardiovascular
Health,
Diagnostic Tests for Men
andDiagnostic Tests for Women. The
textin
Medical Access
wasasimportant
asthegraphicimagery
included.
The
use of
illustrations,
charts, graphs,
as well as wise color andtypographicdecisions
makethispublication aninfluential
andinnovative
publication
withinthe medical anddesign
professions.The
content ofthis
particularprecedentis
relevantto theoutside contentofthis thesis.
Both
ofthesefocus
on medical andhealth
relatedissues.
The designer
ofthis thesisstudy
used this publication toinfluence
and
limit his design decisions. This
publicationhelped
the
designer
focus
on theimportance
ofinformation.
This
pretense was usedtoconsider: which colorsto
incorporate,
whatinformation
toinclude
and which pictograms
to
implement.
The designer
focused
on aspectsof possible
design implementations
thatwouldhelp
rather thanhinder
information
goals such astheplacement ofimportant
textand methodsof
information
organization.Medical Access
presentsdetaUed
medicalinformation
thatcommunicatestomore thanone audience.
This helped
thedesigner
ofthis thesisstudy
realizethepossibility
topresentdetailed
medicalinformation
toa wide audience with
clarity,
efficiency
and simplicity.Medical Access helped
the thesiscandidate understandthe
serious natureof
clarifying
medicalinformation.
This
is
important
tomedicalissues
because
in
some circumstances comprehension ofthis
information
couldmean
the
difference between life
anddeath. This helped
the thesiscandidate realize
the
impact design
couldhave
onthelives
ofits intended
users.Design
does
servethepurpose ofmaking information aesthetically
pleasing,
but design
also servesthe
needs of people.Good design
Precedents
10Diabetes Precedents
Diabetes Meal
Planning
Made
Easy
American
Diabetes
Association
1996
Hope
Warsaw,
in
association withthe
American Diabetes
Association,
published
Diabetes Meal
Planning
Made
Easy
in 1996. This
publicationfocuses
onthe nutritional needs of peoplediagnosed
withdiabetes.
This
pubbcationincludes:
information
aboutType 1
andType 2
diabetes,
facts
about eachdifferent food
group,
an extended menu of availablefoods for
mealplanning,
sample mealplans,
detaded
nutritional valuesfor
eachfood,
and suggested servingsfor
various users.Due
to thelarge
amount oftext
in
thispublication,
illustrations
and graphics arelimited
which makesthispublication
visually
bland.
Monotonous
pages oftextdo
not engagethe
readeror strengthenaccessibility
andunderstanding.This
publicationhelped
the thesiscandidate understandthevastamountof
information
to
be
accommodatedin
mealplanning
systems.All
sixfood
groups,
food
kinds,
nutritional measurements andserving
amounts shouldbe included. This
information
is
imperative
because
without thisdata,
it
would servelittle
purpose to the user.From
thispublication, the
designer
was ableto
decipher
whatkind
of mealplanning information
mustbe included
in
thefinal
application.The designer
ofthis
thesisstudy
was alsoableto
envision allthepossibleusers after
reviewing
theinformation in
thispublication.The
possible targetaudience wasdetermined
afterviewing
thelarge
menu selectionincluded in
thisbook. The large
menu selection accommodatedvarious
lifestyles
andbackgrounds.
Along
with thefact
thatdiabetes
does
notdiscriminate,
thedesigner
considered whatkinds
offood
to
include in
thefinal
application.These foods
shouldsatisfy
the
needsof various
users,
including
those
ranging in
ethnicbackground
and agealsothosewithstrict
dietary
restrictions and consumption preferences.In
reviewing
Diabetes Meal
Planning
Made
Easy,
thedesigner
ofthisthesis
study
experienced severalinstances
ofinformation
overload.This helped
the
designer
understandand sympathize with meal plan users.Attention
focused
oninformation
that
wassuperfluous,
whichincluded
themultitudeof nutrition measurements.
This
unnecessary
information
merely
consumesPrecedents
PortionPak
Michelle R. Saari
1995
Michelle R. Saari developed
a meal managementtoolfor
children calledPortionPak,
afterher daughter
wasdiagnosed
withdiabetes in
theearly
1990s. This
system uses acolor-coding
system anddlustrations
for
the
majority
ofthe
foods described. The
color-coding
system madeit
easy
todistinguish
eachcategory
offood
and associateindividual
foods
withtheirrespective groups.
The illustrations
weredesigned in
a mannerthat
spokedirectly
to chddren,
showing foods
withfaces
and otherhuman
characteristics.
The
only
adultusing
this system wouldbe
theparentof
the
diabetic
child.Each food
was shown on a single page.This
increases
the
book's
width andweight,
creating
size andportabdity
problems.This is
a systemthat
wouldbe
usedprimardy
athome.
This
publicationhelped
the
designer define
problems withportability
and privacy.
Size
and weightissues
concerning
thismealplanning
systemmade
it
difficult
tobe
portable.This
wasa concern ofthis
thesisbecause
portabdity
willenhance mealplanning,
giving
the
usermorefreedom.
The designer determined
that
if
PortionPak
was usedin
a publicsetting,
privacy
could notbe
maintained.The
purpose ofthis
thesisis
toimprove
thequality
oflife
oftheuser.This
canbe
achievedby
giving
the
user morefreedom
and more choices.Portabdity
dictates
wherea user can and cannotperform meal
planning
tasks.This
publicationhelped
thedesigner
realizedesign's
abdity
toconstrain users as well as provide morefreedom
PortionPak
also stressedtheimportance
ofconsidering
all possibleusers,
which
includes
a range ofages,
both
genders,
and all races.This
mealplanning
system wasdesigned
only
for
children.This
excludes usersof other ages.
The designer
wasintroduced
tothe
possible problemsthatcome with
having
potential usersfrom
allfacets
oflife.
Considering
all possible users and
implementing
design
principles thatwould reachall potential users was essential.
The designer
understoodhow color-coding
could enhance mealplanning
by
aiding
andpromoting
recognition and categorization of eachindividual
food
group.The
imagery
and use of color withinPortionPak is
targeted
12
Research
Library
Research
The designer
compiled alist
of possible research terms with respectto
his
thesis
topic.Terms
were generatedthrougha series ofbrainstorming
sessions.Brainstorming
allowedthedesigner
toconsider words and topicsthat
are notgenerally
associated with mealplanning
systems.This
process resultedin
alarge list
of words thatwouldensure sufficient,divergent
research.
These
termshelped
thedesigner find
publications associated with each word.Terms
weregroupedinto
sevenmaincategories,
nutrition,meal
planning,
diet
andmedicine, consumption,
information
organization,symbols and
icons,
andtheories.Within
thesevengroups,
termsweregrouped againbased
on simdar contentandfocus. These
categories were usedtoorganize research
information.
Nutrition
nutritioninformation
nutrientinformation
nutritiveinformation
nutrimentalinformation
nourishmentinformation
nutritionalclarity
nutritional clarifications nutritional refinements nutritionalconfusion nutritionalquestions nutrition explanation nutritiondefinitions
nutritionaldefinitions
nutritiondescriptions
nutritiondesign
nutrition patterns nutrition systems nutritionalanalyzing
nutritionformulations
nutritionaldelineation
nutritional rationalizationsnutritional
break
down
nutritionalsimplificationdeputative
nutrition nutritional managementMeal
Planning
mealplanning
curative meal
planning
diabetic
mealplanning
healthful
mealplanning
healthy
mealplanning
salubriousmealplanning
salutary
mealplanning
Research
13Diet
andMedicine
euphoriahealth issues
healthiness
healthy
eating
healthy
life
styleshealthy living
healthy
mealplanning
nutritionalstamina
nutritional well
being
vitality
eating
disorders
gluttonous
behavior
heart
attackkidney
disorder
obesity
over
eating
stroke
diabetes
diabetes
statisticsdiabetic
carediabetic
needsdiabetic
mealplanning
diet
diet
alternativesdiet
patternsdiet
resolutionsholistic
medicinemedical
design
medical
diagnosis
dietitians
Research
Symbols
andIcons
characterindicia
marks markings motif pictograms reminders representations signsstamp
symbols tokenindication
methods notionalinterpretations
relationalinklings
representationalcues representationalclues significant symbols suggestive symbols symbol notations symbolic representations emblemdesign
gesturedesign
icon
design
indexical
design
notiondesign
symboldesign
Theories
determinate
methodselucidating
techniqueshuman
distinguishing
methodsResearch
15Diabetes
In solving
any problem,
it is imperative
to understand and uncover as much as possible abouttheexisting issue.
The designer
researched allknown facts
concerning Type 1
andType 2 diabetes. This
information
helped
the
designer
answerthesequestions:What issues
neededtobe
addressed?Who is
the
primary
audience? andHow
willtheseissues
be
approached?According
to
theAmerican Diabetes Association
publication,
Diabetes
A
to
Z,
Type
2
diabetics
arefaced
withmany
debilitating
physicalissues.
Those
affectedby
Type
2
diabetes have
vision,
balance,
andmobility
problems.Research
alsofound
thatdiabetes is
adisease
thatdoes
notdiscriminate.
Diabetes
affects peoplefrom
all walks oflife,
affecting
allraces,
allages,
and
both
genders.In
theU.S.
alone,
diabetes
affects an estimatedfifteen
millionpeople,
andninety
five
percent ofthosepeople arediagnosed
withType 2 diabetes.
This
study
is
important
because it
focused
thedesigner's
attention on all possible users ofthe
final
application.The designer
must consider usersfrom
variouslifestyles
andbackgrounds,
as well as other communicationconsiderations,
including
physicalinabilities,
culturalbarriers,
societalissues,
andvarying
comprehensionlevels. This
information
madethedesigner
aware ofthesensitivity
ofthis
issue.
He
realizedtheneed tocommunicateimportant
and sometimeslife-saving
information
in
a clearand concisemanner,
andtheneed to
be
sensitiveto thevarious needs oftheuser.Consumption
The designer felt it
was alsoimportant
tostudy
the
consumptiontrends
ofAmericans. Information
accessedfrom The Food Institute's Demographics
of
Consumer Food
Spending,
along
withSenauer, Asp,
andKinsey's Food
Trends
andtheChanging
Consumer,
helped
the
designer
understand whichfoods
weremostwidely
consumedby
Americans
and possibletrends
for
thecoming
years.This
information
is important
because it
wouldbe
usedtogenerate pictogramsthataidin
theprocess ofvisually
distinguishing
eachfood
group.This is
essential whenconsidering
potential users.These
usersResearch
16Color
Influenced
by
the
organizationaleffects of color usein Michelle R. Saari's
PortionPak,
thedesigner focused his
attentionon color studies.According
toTheory
andPractice
of
Color
by
Frans
Gerritsen,
color canbe
a powerful method ofcommunication.The designer learned
thatcoloris
associative,symbolic,
andhas
the
ability
to
generate emotional responses.It is
alsoimportant
for
thedesigner
to
know
that
older people experiencea progressive
loss
of coloracuity
withblue
and orange.Studies
showthatblues,
greens and violetsbecome
moredifficult
todiscriminate
withage.This is
very
important
due
to thepotential users ofthisfinal
application,
older
individuals.
Other facts
about colorimportant
to this thesisinclude
color'simpressional
value.
Colors have
the
abdity
tosuggestideas
withoutbeing formally
symbolic.For
example,
greenhas
astrong
association withtheenvironment andnature,
and
blue has
an association withthesky.Personal
experience alsodetermines
each
individual's interpretation
of color.Research
concerning
coloris important
to this thesisbecause
it
helped
the
designer
understand thebenefits
anddrawbacks
of color.The designer
had
to consider possible color associations ofdifferent
users.Potential
usersvary in
age, gender,
andbackground. For
thisreason color should notbe
Research
Comparative Matrices
A
comparativematrix,
an organizationaltoolusedto
compare andcontrast,was
developed
toevaluate strengths and weaknesses of current mealplanning
systems.This
matrixhelped
thedesigner
understandthemainfocus
of each mealplanning
system.Brainstorming
was used togenerateterms that
wouldbe
usedin
the
comparative matrixto
representcontent.The designer
reviewed nine mealplanning
systems.Wurman's
Hatracks,
a
design
tool
whichinvolves organizing
andre-organizing information
in
five
possible waysalphabetical,
location,
time,
category,
andmagnitude,was usedto organizeterms.
Three
evaluation categories weredeveloped:
visual,
informational
and physical attributes.The
threematrices wouldlater
serve as atemplate
for
asurvey
toevaluate user needs.Visual Attributes
Matrix 1
The first
visual attributes matrixfocused
ontypography.The designer
feels
that
typographichierarchy,
including
legible
and readabletypography
shouldbe incorporated
within current mealplanning
systems.After
reviewing
the
literature,
thedesigner
evaluatedthe typographicfeatures
withineach piece.
This
matrix uncovered areas within current mealplanning
systems
that
couldbe
revised,
such astypographic
hierarchy
of mealplanning
information.
The
majority
ofthe
pieceshave legible
textand readabletype.The designer
also evaluatedthe
organizational structure ofinformation.
This information helped
thedesigner
see various ways oforganizing data.
The
majority
ofthemealplanning
systems usetheorder ofthefood
pyramidto
organizeinformation,
starting
withthe grains,
beans,
andstarchy
vegetablesgroup,
ending
withthefats,
sweets and alcohol group.Source Title
Typography
TypographicHieracrry
Ledglble Type Readable Type Organization Food Pyramid Arrangement Meal Order Arrangement Alphabetical ArrangementServing
ArrangementDiabetes Meal
Planning
MadeEasy
The Diabetic's Book
Good News
Eating
Plan for Type 2 DiabetesDiabetic's Guide to Health
andFitness
HandbookofDiabetes
Nutritional Management
Via Health Diabetes Exercise
Log
Advanced
Carbohydrate
Counting
Mayo Clinic Diet Manual
Research
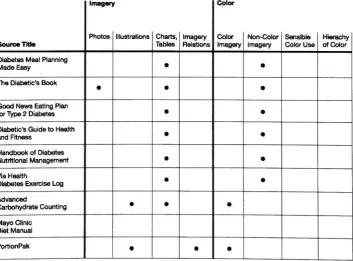
Visual
Attributes
Matrix 2
The
secondvisual attributes matrixfocused
on the use ofimagery
andcolor.The designer
evaluated each mealplanning
system'simagery,
based
onthe
inclusion
ofphotos,
Ulustrations,
charts andtables,
as well astype
andimage
relationships(images
that
relatedirectly
to
text).The designer felt
that
imagery
would aidthe mealplanning
processfor
potentialusers,
making
usersless dependent
ontext.The
importance
ofthis
matrixis
to
seeif
other mealplanning
systems also usedimagery
as away
to
enhance themealplanning
processfor its
users.The designer
found
that
all mealplanning
systems used someform
ofimagery.
The
majority
ofthe piecesused charts andtables,
whde photos andillustrations
were usedin
two
systems.This
matrix showedthat
only
one mealplanning
system usedimagery
that
directly
relatedtothe
text, for
example a picture of chicken nexttothe
word chicken.This is
another area wherethedesigner felt
improvements
couldbe
made.Color
wasalso evaluated withinthismatrix.Each
mealplanning
system was evaluatedfor its
use of colorimagery,
non-colorimagery,
sensible coloruse,
andhierarchy
of color.Two
mealplanning
systems usedcolorimagery,
whde six used non-colorimagery
such asgray
orblack
and whiteimages.
This
was another areathat thedesigner
couldimprove
uponbased
onthe
information
ofthismatrix.Color images
couldhelp
communicationby
making
information
more accessible througha visualgroup
system.Color images
would also makethesystems morevisually
interesting
and give users abreak from black
text. [image:19.521.153.507.406.667.2]Source Title Imager
Photos
f IllustrationsCharts,
TablesImagery
Relations
ColorColor
Imagery
Non-ColorImagery
Sensible
ColorUse
Hierachy
ofColor
Diabetes
MealPlanning
MadeEasy
Tne Diabetic's Book
Good
NewsEating
Plan
forType
2Diabetes
Diabetic'sGuide
toHealth
andFitnessHandbookof
Diabetes
Nutritional Management viaHealthDiabetes Exercise
Log
AdvancedCarbohydrate
Counting
MayoClinic
Research
19Informational Attributes
Matrix 1
The
first
informational
attributes matrixfocused
on threemainissues:
serving
information,
food group
information,
andtime.This data
was usefulto the
designer in
helping
him
see whatkind
ofinformation
is included
in
mealplanning
systems,
and whatinformation is
consideredimportant
according
to
current mealplanning
systems.With
respectto
serving
information,
themajority
ofthe
mealplanning
systems are clear when
presenting
food
group serving information
and meal
serving
clarity.The designer found
thatconfusionis
largely
due
to the
overwhelming
amount of contentin
certain systems.These
piecesinclude
toomuchinformation,
making
it
difficult
tounderstand.The designer
felt
this
was another areathat
couldbe improved
upon.With
respect tofood group
information,
all were successfulin
distinguishing
the
different food
groups.The
majority
have food kind
distinction,
for
examplevariations of apples and
bread. Most
tools alsoincluded
notation oftime,
for
examplemorning,
noon andevening
of numerical representations oftime.The designer felt
thatthese
factors
shouldbe
included
withincurrent mealplanning
systems.Source
Title
Serving
Information
Food
Group
Serving Clarity
Meal
Serving Clarity
Food
Group
Information
Food
Group
Distinction
Food Kind
Distinction
Time
Time
Notation
Diabetes Meal
Planning
Made
Easy
The Diabetic's Book
Good News
Eating
Plan
for Type 2 Diabetes
Diabetic's Guide
to Health
andFitness
Handbook
ofDiabetes
Nutritional Management
Via
Health
Diabetes Exercise
Log
Advanced
Carbohydrate
Counting
Mayo
Clinic
Diet
Manual
Research
211Informational
Attributes
Matrix 2
The
secondinformational
attributes matrix was usedtoreviewinformation
quantity
andlanguage. These
aretwoimportant issues
that
will affectthe
quality
of comprehension ofthe
users.Information
quantity
wasdivided into
three
categories:too
little
information,
sufficientinformation,
andtoo
muchinformation. Of
thepiecesreviewed,
only
one contains sufficientinformation
according
to
thedesigner.
The majority
ofthe mealplanning
tools
containtoo
muchinformation,
whdetwo
containtoolittle information.
Meal planning
tools
were also evaluatedfor
theirlanguage
clarity.According
to the
designer,
three
pieces were clearin
word and sentence structure.The designer
attributed word and sentenceclarity
to thesimplified useof
language. Words
and sentences were simplifiedtobe
easierto
understand.Long
sentences anddifficult
terminology
were not presentin
thesesystems.Source Title
Information
Quantity
Too Little
Information
Sufficient
Information
Too Much
Information
Langue
Word
Clarity
geSentence
Clarity
Diabetes
Meal
Planning
Made
Easy
The
Diabetic's
Book
Good News
Eating
Plan
for Type
2 Diabetes
Diabetic's
Guide
to Health
andFitness
Handbook
ofDiabetes
Nutritional Management
Via Health
Diabetes
Exercise
Log
Advanced
Carbohydrate
Counting
Mayo
Clinic
Diet Manual
Research
21Physical
Attributes
Matrix 1
The
first
physicalattributes matrix evaluatedthe
size andformat
of each meal
planning
system.The designer felt
that thiswasimportant
because
physicalfeatures
oftenlimit
the
content andportability
of
the
mealplanning
systems.Most
pieces reviewed weretoolarge
according
to
thedesigner's
criteria andfour
aremedium,
portablesizes.This
matrix shows arelationship between
size andinformation
quantity.Meal planning
systemsthat
arelarge
tend
tohave
toomuchinformation,
whde smaller mealplanning
systemstend
tohave
insufficient information.
This
wasimportant
tothe
designer
in selecting
an appropriate sizefor
the
final
application.The
mostwidely
usedformat
of mealplanning
systems reviewed werebooks.
The
otherformat
used wasfolded
pamphlets.This
information
wouldbe
usedlater
to
determine
preferableformat.
Source Title
Size
Large
Medium
(portable)
Small
(hand-held)
Form*
Card
itPamphlet
Book
Poster
Diabetes Meal
Planning
Made
Easy
eThe Diabetic's Book
Good News
Eating
Plan
for Type 2 Diabetes
Diabetic's
Guide to Health
and
Fitness
Handbook
ofDiabetes
Nutritional Management
Via Health
Diabetes Exercise
Log
Research
22Physical
Attributes
2
Matrix 2
The
secondphysical attributes matrix addressedissues
suchasportabdity,
movable
pieces,
and userinteraction. This
matrixwas usedin
the
samemanneras
the
others.The designer's intention
wastouncoverrelationshipsthat
existbetween
specific attributes of each mealplanning
system.This
matrix showed arelationship
between
size and portabdity.In
mostcases,
meal
planning
systemsthatarelarge in
size are not portable.In
oneinstance,
a medium size meal
planning
system was not portabledue
toits
weight.This
was animportant
observation.This helped
to
determine
notonly
sizeas an
issue affecting
portabdity,
but
also overall weight ofthe
application.The designer
reviewed each systemfor
theinclusion
of movable pieces.This is important
to thedesigner because he
wouldlater include
thisquestionin
a survey.This
would serve as anindicator
for
which mealplanning
systemsare
satisfying
the
needs of users.The final
physical attributefocused
on userinteraction,
whichis
divided into
high,
medium andlow.
The designer
estabhshedthatuser
interaction
wouldbe
considered physicalinvolvement
withtheartifact.
With
oneexception,
most pieces requiredlow
tomediuminteraction.
This information
would alsobe
related touser preferences.Source Title
Portal
Yes
liRty
No
Mova
Piece
Yes
ale BNo
User
Interac
High
Uon
Medium
Low
Diabetes Meal
Planning
Made
Easy
The Diabetic's
Book
e e
Good News
Eating
Plan
for
Type
2
Diabetes
Diabetic's
Guide
to Health
and
Fitness
eHandbook
ofDiabetes
Nutritional Management
Via Health
Diabetes Exercise
Log
Research
2MSurveys
Four
surveys weredesigned
anddisseminated
to
aidin
the
researchprocess.
Surveys focused
onuncovering
userneeds,
evaluating
currentmeal
planning
systems,
consumptiontrends,
and color correlationswithrespectto
food
groups.User Needs
Survey
This survey
was usedto
define
areas ofimportance
according
to
potentialusers.
The designer did
notdesign
thissurvey
toinclude
thegeneralpublic.Only
users who arecurrently
using
a mealplanning
system were askedto
participatein
this
survey.This information
wouldbe
used tohelp
the
designer
consider user needs whendesigning
thefinal
application.A
totalofthirty
five
patronsfrom The Diabetes Association
ofAmerica,
ViaHealth,
Gold's
Gym,
Mid-Town Athletic
Club,
andFlex
Gym
&Aerobics
completed
this
anonymous survey.Participants
were askedtoanswerYes, Somewhat,
orNo,
to theimportance
of each
factor,
including
privacy,
userinteraction,
information
organization,
ease of
understanding,
large
menuselection,
movable pieces andpages,
use ofcolor and
inclusion
ofimagery.
Participants
were askedtoindicate
a preferred
format,
whichincluded
four
choices:poster,
book,
pamphletand card.
The final
questionin
thissurvey
focused
onintended
use:a quick reference or
detaded
information
guide.Survey
Example
NutritionSurvey User Needs
PleasearcJe your preferences and needsbyanswering thefollowingquestions
Withrespecttoyour mealplanningsystems :
Is privacy important ? yes somewhat no
Isuserinteractionimportant? yes somewhat no
isinformation organeation importan!? yes somewhat no
Isease ofunderstandingimportant? yes somewhat no
Isalargemenu selectionimportant 7 yes somewhat no
win movable, individualpages or pieceshelp
your mealplanningprocess?
yes somewhat no
Willuseof color enhance your mealplanningprocessf
yes somewhat no
Willuse ofpictures and graphicshelp
your mealplanningprocess?
yes somewhat no
Withrespecttoyourindividualneeds
Whichformatwouldbest serve your mealplanningneeds?
poster book
pamphlet card/cards
It ismostlikelythatyou will use whichkindof mealplanningsystem?
quick reference guide
Research
21User Needs
Results
Importance
Is privacy
important ?
Is
userinteraction
important ?
Is information
organizationimportant
?
96% Yes
4
%
No
45
%
Yes
42%
No
13% Somewhat
100
%
Yes
Is
ease ofunderstanding
important
?
100
%
Yes
Is
alarge
menu selectionimportant
?
100
%
Yes
Preference
Wdl
movable,
individual
pagesor pieces
help
yourmeal
planning
process?
16
%
Yes
29
%
No
55
%
Somewhat
Wdl
theuse of colorenhance your
meal
planning
process?
71
%
Yes
29
%
No
Wdl
theuse of picturesand graphics
help
yourmeal
planning
process?
100
%
Yes
Use
Which format
wouldbest
serveyourmeal
planning
needs?
42
%
Book
32
%
Cards
26
%
Pamphlet
It is
mostlikely
that youwillusewhat
kind
of mealplanning
system?
77
%
Quick
Reference
Research
2.",Literature
Evaluation
Survey
The
secondsurvey
was usedtodefine
areas of neededimprovement
within current meal
planning
systemsaccording
tocurrent users.Once
again,
thedesigner did
notdesign
thissurvey
toinclude
the
general public.The
content ofthis twopagesurvey
wasdetermined
based
on research andWurman's Hatracks
asdiscussed
on page eighteen.Only
userscurrently
using
a mealplanning
system were askedtocompletethis
survey.This survey
was usedtodefine
problemareas within currentmeal
planning
systems,
andtouncover areas of neededimprovement.
A
totaloftwenty
patronsfrom The Diabetes Association
ofAmerica,
and
ViaHealth
completedthis anonymous survey.Participants
were askedto evaluatetheircurrent mealplanning
systemsby
answering
Yes,
orNo. Participants
responded toquestionsthatdiscussed:
serving
information,
food
group
information,
time,
language,
typography,
imagery,
portabdity
and clarity.Page
one ofthis
survey
is
shownbelow.
Page
twois
shown onthefollowing
page.Survey
Example
NutritionSurvey LiteratureEvaluation
PleasecircleYesorNolothefollowingquestions
ServingInformation
Doesyourmealplanningsystemclearlyexplain your requireddailyintakeof eachfoodgroup ?
Doesyour mealplanningsystemclearlyexplain
necessary servingamounts per meal?
Doesyour mealplanningsystemclearlyexplain
servingamountsforeachtypeoffood 7
Yes No
Yes No
Yes No
FoodGroupInformation
Canyouqurckty distinguish differentfoodgroups within yourmealplanningsystem7
Canyoueasily linkspecificfoods totheirrespectivefoodgroups within your mealplanningsystem?
Yes No
Yes No
Tme
Doesyour mealplanningsystemclearlyexplain
designated timesforyourmeals and snacks? Yes No
Language
Doesyour mealplanningsystem usewordsthatareeasy tounderstand? Isyour mealplanningsystem
written ina mannerthatiseasytounderstand?
Yes No
Research
2dSurvey
Example Page
2
NutritionSurvey LiteratureEvaluation e circleYesorNo tothefollowingquestions
Doe6your mealplanningsystem uselegible textandnumbers?
Doesyour mealplanningsystemcieaity highlight importam text, headings,orsub-headings 7
Doesyour mealplanningsystei pictures or graphicimagery?
Ifyour mealplanningsystem uses images, do theseimagesreatteto the text 7
Doesyour mealplanningsystem use mobile or portablepieces ?
Isyour mealplanningsystem designed inanorganizedmanner7
Research
27Literature
Evaluation Results
Serving
Information
Does
your mealplanning
system78
%
Yes
clearly
explain your required22
%
No
dady
intake
of eachfood
group
?
Does
your mealplanning
systemclearly
explainnecessary
serving
amounts per meal?
78
%
Yes
22
%
No
Does
your mealplanning
systemclearly
explainserving
amountsfor
eachtypeoffood ?
78
%
Yes
22
%
No
Food
Group
Information
Can
youquickly
distinguish
different
food
groups withinyour meal
planning
system?
78
%
Yes
22
%
No
Can
youeasdy
link
specificfoods
78
%
Yes
to theirrespective
food
groups22
%
No
within your meal
planning
system?
Time
Does
yourmealplanning
systemclearly
explaindesignated
timesfor
your meals and snacks
?
100
%
Yes
Language
Does
yourmealplanning
systemuse65
%
Yes
wordsthat are
easy
tounderstand?
35
%
No
Is
your mealplanning
system written65
%
Yes
Research
28Literature Evaluation Results
continuedTypography
Does
your mealplanning
systemuse
legible
text
and numbers?
57
%
Yes
43
%
No
Does
your mealplanning
systemclearly
highlight
important text,
headings
orsub-headings?
57
%
Yes
43
%
No
Imagery
Does
your mealplanning
systemuse pictures or graphic
imagery
?
100
%
Yes
If
your mealplanning
systemuses
image,
do
these
images
relateto the
text?
100
%
Yes
Portabdity
Is
yourmealplanning
systemportable
?
Does
your mealplanning
systemusemobde or portable pieces
?
84%
Yes
16
%
No
8% Yes
92% No
Clarity
Is
yourmealplanning
systemdesigned
in
an organized manner?
100
%
Yes
Is
your mealplanning
systemeasy
to
understand andfollow
?
81
%
Yes
Research
29Consumption
Survey
The
third
survey
was usedtoresearchthe
mostwidely
consumedfoods
withineachfood
group.Differing
from
the
previoussurvey,
thissurvey
wasdesigned
to
include
thegeneral public and was usedtorecordthe
consumption patternsof current andfuture
users.The
survey
results woulddictate
whichfoods
couldbe
usedtorepresent eachgroup visually
in
the
form
ofpictograms.A
total
ofsixty
patronsfrom The Diabetes Association
ofAmerica, ViaHealth,
Gold's
Gym,
Mid-Town Athletic
Club,
andFlex
Gym
&Aerobics
completedthis
anonymoussurvey.Individuals
from Marketplace
Mall,
Eastview
Mall,
Wegmans,
Tops,
JPMorgan
Chase,
and studentsfrom Rochester Institute
ofTechnology
andthe
University
ofRochester
also participatedin
this
survey.Participants
were askedtoindicate
the
mostwidely
consumedfoods from
eachfood
group
based
ontheir
individual
eating
habits. Participants
were askedto
include
foods from
eachfood
group, including:
thefats,
sweets,
alcoholgroup, the
milkgroup,
the meat,
fish
group, the
fruit
group,
the
vegetablesgroup,
andthe grains,
beans,
starchy
vegetables group.Results
ofthissurvey
are shown onthe
following
page.Survey
Example
NutritionSurvey Consumption Whichfoods doyou consumemost,fromeachgroup 7
Fats, Sweets, Alcohol
Mirk
Meat,Fish
Fruits
Vegetables
Research
30Consumption Results
Grains, Beans,
Starchy
Vegetables
Vegetables
Fruits
Meats,
Fish
MUk
Fats,
Sweets,
Alcohol
60
%
Bread
36
%
Broccoli
53
%
Apple
29%
Fish
95%
Milk
Research
31Color
Correlations
Survey
The fourth
andfinal
survey
was usedto
researchexisting
correlationsbetween
color andfood
groups.Similar
to the third survey, this
survey
was
designed
to
include
the
general public.This
survey
was usedto
recordcolorrelationships.
This data
wouldhelp
the
designer
chooseappropriate colors
that
would aidin
the
organizationof nutritioninformation
withinthis
mealplanning
system.A
total
ofsixty
patronsfrom The Diabetes Association
ofAmerica,
ViaHealth,
Gold's
Gym,
Mid-Town Athletic
Club,
Flex
Gym
&Aerobics
completed
this
anonymoussurvey.Individuals from Marketplace
Mall,
Eastview
Mall, Wegmans, Tops,
JPMorgan
Chase,
and studentsfrom
Rochester Institute
ofTechnology
andthe
University
ofRochester
also participated
in
this
survey.Participants
were askedto
link
colors tofood
groups.Food
groupsinclude:
the
fats,
sweets,
alcoholgroup,
the
milkgroup, the
meat,
fish
group,
thefruits
group, the
vegetablesgroup,
andthegrainsbeans,
andstarchy
vegetablesgroup.Colors included:
red, orange, yellow, green,
blue,
purple,
black
and white.A
visualexample ofthis
surveyis shownbelow.
Survey
results,
are shown onthe
following
page.Survey
Example
NutritionSurvey
Color Correlations Peasecheckthecolorthatrelatestoeachfoodgroup ?
Fats,Sweets,Alcohol red green black orange blue white yellow purple
Milk red green black
orange blue white yellow purple
Meat,Fish red green black orange blue white yellow purple
Fruits red green black
orange blue white yellow purple
vegetables red green black orange blue white yellow purple
Research
32Color
Correlation Results
Grains, Beans,
Starchy
Vegetables
36
%
Yellow
Vegetables
93
%
Green
Fruits
40
%
Orange
Meats,
Fish
59
%
Red
MUk
90%
White
33
Synthesis
Data
Organization
To
logically
organize all researchinformation,
the
designer
employedWurman's Hatracks.
Research information
was rankedin
order ofimportance based
on content.Primary
information
is
considered mostimportant,
followed
by
secondary information.
Tertiary
information
is
stillconsideredimportant,
but
not essential whenimplementing
thefinal
thesis
application.This step
was essentialin
organizing
usefulinformation
for
the
development
ofthe
final
application ofthis thesis.Research
concerning Type 2
diabetes,
color, consumption,
information
gainedfrom
the
comparative matrices andsurvey
results were evaluated and organizedbased
on order ofimportance.
From
previousexperience,
it
wasimportant for
the
designer
to
rememberthat
avoiding information
overloadin
the
final design
application was animportant
consideration.Primary
Information
Effects
ofdiabetes
Diabetic
needsPossible
usersNeeds
of possible usersEvaluation
of currentliterature
Food
group information
Food information
Secondary
Information
Effects
of colorConsumption
statisticsPictogram
information
Synthesis
34Design
Approach Chart
Information from
the
surveysdictated
thecontentthatwouldbe included
in
the
designer's final
application as well asits
physicalformat.The designer
developed
adesign
approachchart,
based
onthe
information
from
the
surveys.This information
was usedto
help
the
designer brainstorm
and sketch possibledesign
solutionsfor information
organization,
content presentation and order.This
chart was also usedto
help
the
designer
consider use of colors andthe
design
ofpictograms.User
Evaluation
Design Approach
Chart
Attribute
Serving
Information
Possible Approach
Remove
unimportantdata
Organize
serving
data
Food
Group
Info
Emphasize important headings
Restructure food
group
data
Use
colorfor
emphasisTime
Based
onsurvey,
n/aLanguage
Use different
wordsSimplify
text
Limit
text
Rearrange
text
Reconstruct
sentencesSimplify
sentencesTypography
Typographic
hierarchy
Use legible
typefaces
Change
size oftype
Change spacing
oftype
Imagery
Based
onsurvey,
n/aPortabdity
Use
portable piecesUse
portable pagesClarity
Revise language
Synthesis
35User
Needs
Design
Approach Chart
Attribute
Privacy
Possible Approach
Change
sizeofformat
Portable
sizeandformat
Different
fold
methodsInconspicuous
coverDate
planner similaritiesCheck book
simUaritiesUser
Interaction
Flexibility
of mealplanning
More
food
choicesMore
physicalactivity
Information Organization
Alphabetical
organizationNumerical
organizationFood
group
organizationMeal
time
organizationTypographic
hierarchy
Vary
typeface
Vary
type
sizeRevise
text
placementUse
rulesUse
gridlinesUse
columnsEase
ofUnderstanding
Clarify
language
Simplify
terms
Delete
unnecessary
data
Relate
textto
imagery
Relate
colortodata
Food group
organizationServing
data
organizationLarge Menu Selection
Include
morefood
choicesInclude
variations offoods
Include
rarefood
choicesUse
several sourcesResearch
cookbooksSynthesis
36User Needs
Attribute
Design
Approach Chart
Movable Pages
/
Pieces
Possible Approach
Portable
menuPortable
pagesMovable
pictogramsColor
Colored
pictogramsColored
rulesColored
textColored borders
Color-
coded menuLimit
color paletteImagery
Pictograms
Photographs
Illustrations
Drawings
Examples
of specificfoods
Examples
of whole mealHighlight
certainfoods
Format
Book
preferenceCard
preferenceBooklet
of cards?Durabdity
Quick Reference
Limit
textinformation
Typographic
hierarchy
Headings
Color incorporation
37
Content
Ideat
ion
User
needsThe designer
looked
to the
newinformation discovered from
thesurveysin
orderto
help develop
content andintegrate
this
into
the
application.Based
onthe
information from
the
user needssurvey
from
pagetwenty
five,
participants
felt
that
ease ofunderstanding
and alarge
menu selection wereextremely important. The
majority
ofthose surveyed statedthat this
mealplanning
system would mostlikely
be
usedas a quickreferenceguide.
Text Information
In
an attempttoavoid an extraneous amount ofinformation
andto
servethe
needs ofthe
potentialusers,
the
designer had
to
simplify
the
language.
Information
was explainedusing
simplewords,
and superfluous contentsuch as
unnecessary
nutrition measurements were eliminated.The designer
replaced
the
varying
nutrition measurement values such asfat, fiber,
and proteincontent,
with oneunit,
thecalorie.The designer
concludedthat
anindividual
using
a specific mealplanning
process wouldonly
useone unit of measurement.The
addition of other units of measurements couldbe helpful
to
a wideraudience,
but
could alsolead
toconfusion.Research found
thatusers would mostlikely
have
vision problems.Eliminating
unnecessary
information
wouldrequireless
visualeffortfrom
the
user andhelp
unify
foods
withtheirrespective nutritional value.Users
wouldhave
to
readless
eliminating
information
overload.This
toolIdeation
38Design
Format
Based
onthe
survey
results,
the
designer
selectedaformat
thatwould
satisfy
themajority
of people surveyed.Users
stated a slight preferencefor
abook format
over a cardformat. Users
also statedthat
privacy
was animportant
factor.
Taking
this
information
into
consideration,
the
designer determined
a sizethatincorporated
both
format
characteristics,
a smallhand-held book
of cardsthat satisfiedsize andprivacy
preferences.The designer
was awarethat
serving
the
needs ofthe
user was essentialto
developing
this
new meal
planning
system.Portable Book
This
portablefour
by
eightinches
book format
uses a spiralbinding
but
other versionsof
this
format
will also usea metal
ring binding.
Cards
This
twoby
three
inches
format is
simdarto the
shapeof conventional
playing
cards.Card Booklet
This format is
a mixtureof
the two
previousformats.
These
cards arethesamesizeIdeation
39Lolor
Based
onthe
survey
results,
the
designer
selected colorsthat
wouldsatisfy
the
majority
of people surveyed.Users
statedthat
the
useof colorwould aidmealplanning.
Based
onthe
majority
ofvotes,
yellowwould represent
the
grains,
beans,
andstarchy
vegetables group.Green
wouldrepresentthe
vegetablesgroup.Orange
would representthe
fruits
group.Red
would representthe
meat andfish
group.White
would represent
the
milkgroup.Purple
would representthe
fats,
sweets,
and alcoholgroup.Color
wouldbe incorporated into
this
application with atypographic
rule,
which wouldhighlight
the text
of eachdesignated food
group.A
rule was chosen asthe
focal
pointfor
color ratherthanthe text
because
the
ruleextendsbeyond
the
text, has
moremass,
andis
therefore
more visible.
An
exampleis
shownbelow. This
wouldhelp
distinguish
different
food
groups and alsohelp
thoseusing
this
system as a quickreference guide.
Pages
canbe quickly
found
withthisvisual system.Colored
text
would makeit
harder for
userstoread.The
addition of coloras recommended