2
About the author
Jon Andrews is Director for School System and Performance and Deputy Head of Research at the Education Policy Institute. Prior to this, Jon worked in the Department for Education from 2003 to 2016. Jon is the principal author of EPI’s ‘The Performance of Local Authorities and Multi Academy Trusts’ report and has co-authored reports on grammar and faith schools, school funding, the disadvantage gap, and world class standards.
Rebecca Johnes, Senior Researcher. Rebecca is principal author of EPI’s report, Entries to Arts Subjects at Key Stage 4, and co-authored reports on grammar and faith schools. Before joining EPI, she worked in schools in both Japan and the UK, and also for a social integration charity, The Challenge.
Acknowledgements
Natalie Perera is Executive Director and Head of Research at the Education Policy Institute. Natalie worked in the Department for Education from 2002 to 2014, where she led on a number of reforms, including childcare and early years provision and the design of a new national funding formula for schools. Between 2014 and 2015, Natalie worked in the Deputy Prime Minister’s Office. Natalie is the principal author of the EPI’s Annual Report on
Education in England and Implications of the National Funding Formula for Schools.
About the Education Policy Institute
The Education Policy Institute is an independent, impartial, and evidence-based research institute that aims to promote high quality education outcomes, regardless of social background.
Education can have a transformational effect on the lives of young people. Through our research, we provide insights, commentary, and critiques about education policy in England
– shedding light on what is working and where further progress needs to be made. Our research and analysis spans a young person's journey from the early years through to higher education and entry to the labour market. Because good mental health is vital to learning, we also have a dedicated mental health team which considers the challenges, interventions, and opportunities for supporting young people's wellbeing.
Our core research areas include: ▪ Accountability and Inspection ▪ Benchmarking English Education ▪ Curriculum and Qualifications
▪ Disadvantaged, SEND, and Vulnerable Children ▪ Early Years Development
▪ School Funding
▪ School Performance and Leadership ▪ Teacher Supply and Quality
▪ Children and Young People’s Mental Health
3
This publication includes analysis of the National Pupil Database (NPD):
https://www.gov.uk/government/collections/national-pupil-database
The Department for Education is responsible for the collation and management of the NPD and is the Data Controller of NPD data. Any inferences or conclusions derived from the NPD in this publication are the responsibility of the Education Policy Institute and not the Department for Education.
Published November 2017, Education Policy Institute.
5
Contents
Contents ...5
Foreword ...7
Executive summary ...8
Introduction ... 12
Part 1: Access to free schools ... 13
Background ... 13
Free school governance ... 14
Regional variation in free school openers ... 14
Free school places by small geographical areas ... 15
Location by need for new places ... 16
Location by quality of existing provision ... 18
Location by the need for new places and better schools ... 19
Summary ... 20
Part 2: The characteristics of free school pupils and their local communities ... 22
Background ... 22
Descriptive statistics ... 22
Pupils from white British backgrounds ... 24
Disadvantaged pupils ... 27
Summary ... 30
Part 3: School choice and preferences... 32
Background ... 32
Propensity for free schools to be first preference ... 33
Applications to nearest school ... 35
Schools within reasonable travel distance ... 38
Summary ... 39
Part 4: Performance of free schools ... 41
Background ... 41
Ofsted grades ... 41
Attainment and progress ... 44
Summary ... 54
Conclusion ... 56
Annex 1: Estimating the number of school places in small area geographies... 58
6
School places in small area geographies ... 59
Demand for new places in small area geographies ... 59
Quality of school places in small area geographies ... 59
Annex 2: Identifying a group of similar pupils ... 60
7
Foreword
The Education Policy Institute is an independent, impartial, and evidence-based research institute which aims to promote high quality education outcomes for all, through analysis that both informs and influences the policy debate in England and internationally.
Over recent decades there has been significant reform of the structure of the schools system in England - not least with the introduction and scaling up of the academies programme. Since 2010, the government has introduced a free schools programme in which new schools can be established outside local government control and oversight, with central government funding both the capital and revenue costs. This programme is estimated to cost almost £10bn in capital terms alone by 2021.
The champions of free schools claim that they have multiple benefits, including: enabling more educational innovation; raising standards for children attending the schools; increasing competitive pressures in the wider school system and so improving standards in other schools; responding more effectively to parental preferences; and even cutting the capital costs of delivering new school places.
The critics of free schools argue that these schools: are not raising standards, but may lower them, for example through the employment of unqualified teachers; are often unpopular with parents and so have spare capacity; are largely focused in a small part of the country (namely London and the South East); are increasing social segregation in the schools system; and are diverting capital which could be used more efficiently either to create additional school places or to improve the state of existing school buildings.
Until now, there has been remarkably little detailed and impartial assessment of this major programme of educational reform. Of course, this is in part because the programme is relatively new, and there has been an absence of sufficient data on which to base sound conclusions. What this has meant is that much of the debate about free schools has so far relied upon small data sets, anecdotal reports and a large measure of fairly partisan and ideologically-driven hunches.
This EPI report seeks to provide some of the first detailed, impartial, and quantitative assessments of the outcomes of the programme - using data on parental preferences, attainment and progress, inspection outcomes, and access measures. The conclusions are necessarily tentative at this early stage, but provide some challenges to the assumptions of free schools critics and champions alike.
In this report, we have not sought to provide a value for money assessment of the free schools programme. We have not compared the costs of delivering this programme with a
‘counterfactual’ costs model. Nonetheless, the results of this report will be of great interest to all those interested in education reform. As ever, we welcome comment on the analysis and conclusions of this report.
Rt. Hon. David Laws
8
Executive summary
Free schools are a growing part of the school system. The first schools opened in September 2011 and by the end of the 2016/17 academic year there were 347 open free schools; they are found in every region of England.
Access to free schools
Free schools still represent just 2 per cent of all state-funded schools and two-thirds of areas in England are not within a reasonable travel distance of either a primary or
secondary free school.1 This relative sparsity in free school provision is important to keep in mind when considering their impact on the education system – in terms of expansion of school places, the effect on school choice, and on pupil outcomes.
The Department for Education argues that free schools are being set up in areas that are most in need of new places due to insufficient capacity. The analysis presented here supports the claim that free school growth has been greatest in the areas most in need of new school places, but we also find significant numbers in areas where there is already an excess number of places. Secondary free schools have added 76 places per 1,000 pupils in areas with greatest need, but have also added nearly 20 places per 1,000 pupils in areas with sufficient capacity.2 However, this is also true for other new schools that opened over the same period. Overall, it is the expansion of existing schools that has generated the largest number of new school places within the system and this is more closely linked with need. A stated aim of the free schools programme has been to target expansion in areas where there is a shortage of high quality provision. To date, the free schools programme, particularly at secondary level, has been less successful in addressing areas of underperformance (even after controlling for the need for places). Amongst the top performing areas, an additional 8.9 primary school places per 1,000 pupils were created in free schools. In areas in the bottom fifth there were an additional 8.7 places. At secondary level, free school places were slightly more likely to be established in areas with existing high-quality provision (31.6 places per 1,000 pupils in high performing areas and 25.2 places per 1,000 in low performing areas).
Given the regional bias in the location of free schools – with many of these early openers operating in high-performing London – this may be addressed by focusing the programme in lower performing regions in the future (whilst recognising that this needs to be balanced against the expected demand for new places in London and the South East and that the free schools programme is demand led).
The characteristics of free school pupils and their local communities
Pupils in free schools are more likely to have a first language other than English than pupils in other state-funded schools and much less likely to be from white British backgrounds. In primary free schools 39.4 per cent of pupils have a first language other than English
compared to 20.6 per cent of pupils nationally (equivalent figures for secondary schools are
1 Defined by lower layer super output areas.
9
24.9 and 16.2 per cent). In primary free schools 33.0 per cent of pupils are recorded as white British compared to 67.2 per cent of pupils nationally (equivalent figures for secondary schools are 44.9 and 69.5 per cent).
Pupils in primary free schools are slightly less likely to have special educational needs and disabilities than pupils in other state-funded schools, though the proportions at secondary free schools are similar to other state-funded schools.
Whilst their supporters have said that free schools are being set up in areas of high disadvantage, opponents have argued that they are socially selective. Whilst the analysis here supports the claim that a large number of free school places have been created in areas of high disadvantage, the free school meal rates do not reflect higher levels of disadvantage and are in fact in line with national averages. For example, 15 per cent of primary free school places are in the most disadvantaged tenth of areas and 8 per cent are in the least disadvantaged areas. However, the proportion of pupils who attend free schools that are eligible for free school meals is 13.3 per cent versus 14.7 per cent in all schools. Our analysis of reception aged pupils shows that in the most disadvantaged areas 32 per cent of children are eligible for free school meals, but this falls to 24 per cent in free schools. This suggests that free schools are not necessarily attracting disadvantaged pupils in the proportions that might be expected given the communities that they serve. This is particularly the case for primary free schools.
School choice and preferences
The assertion that free schools are popular with parents does not, as yet, appear to be supported by the available data, at least in comparison to other school types. At primary level, just over a third of preferences to free schools were as a first preference. This was the lowest of any school type. This is partly a London effect, however outside of London the prevalence of first preferences for free schools was still lower than for any other school type, but not far behind the rates seen for community schools and voluntary aided schools. There was no such London effect for secondary free schools. These were well behind other school types in and out of London – for example, 28.9 per cent of preferences to secondary free schools in London were first preferences; the next lowest was voluntary aided schools at 39.6 per cent.
In general, free schools have not yet established themselves as the preferred local school. Nationally, half of pupils attend their nearest school. Where the nearest school is a free school, just 22 per cent of pupils at both primary and secondary level attend that school. However, some context is required for these statistics. Free schools can be set up precisely because groups want to offer something different from what is available from other local schools. That being the case, these schools may never expect to be the ‘default’ local school
10
whose nearest secondary school was a free school which had been open for four years, 34 per cent applied to it as their first preference; for pupils whose nearest secondary school which had been open for one year, or which was a new free school, the equivalent figure was 14 per cent.
Whilst in most cases these rates remain lower than those of other schools, this analysis does suggest that pupil applications and numbers on roll may be lower in the first years of opening and then improve. This has implications when considering the short and long-term viability of a free school.
The performance of free schools
There is insufficient data to reach robust conclusions on the effectiveness – good or bad –
of free schools in terms of Ofsted outcomes and pupil attainment and progress. Both present a mixed picture and both currently have serious limitations as to the extent to which they can be taken to be a measure of the effectiveness of the programme.
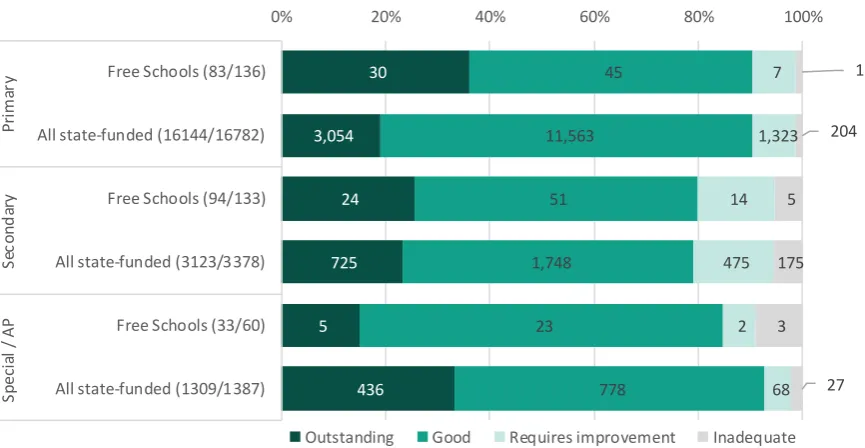
Primary free schools have a similar propensity to be good or outstanding as other school types but the proportion that are rated as outstanding is nearly double that of all state-funded primary schools. However, Ofsted outcomes suggest little difference between secondary free schools and other state-funded schools. They are equally likely to be rated as good or outstanding with free schools marginally ahead when considering outstanding. Special and alternative provision free schools are much less likely than other state-funded special and alternative provision schools to be rated as outstanding.
Large numbers of free schools are yet to be inspected. Those that have been inspected have often had an inspection whilst growing (i.e. before they have all year groups in place) and these inspections will reflect the quality of provision at that point, rather than when they are fully established. Historic data suggests that Ofsted outcomes for new openers are more volatile than those for established schools. Over time we may see a different profile of Ofsted grades for free schools. In particular, the more recent openers have, on average, achieved higher grades than the early adopters.
Attainment and progress in free schools at the end of primary (Key Stage 2) is relatively poor but these statistics are derived from a small number of schools which are likely to be atypical of the programme as a whole – almost half are former independent schools rather than new provision.3 The results at the end of Key Stage 1 are good and derived from a larger number of schools, but come with the caveat that they do not control for level of
development on entry to the school or other pupil characteristics.
In 2017, the 54 free schools that had pupils at the end of Key Stage 4 achieved an average Progress 8 score of +0.10. Amongst the major school groups this was the joint highest Progress 8 score alongside converter academies.4 This means that, on average, pupils
3As such they are not ‘new schools’ in the way that free schools more generally are. Furthermore, as independent schools they would not have had to take part in National Curriculum assessments (though some independent schools do).
11
achieve a tenth of a grade higher in each subject than pupils with similar prior attainment nationally.
Progress 8 measures do not control for the different profile of pupil characteristics seen in free schools. Of particular significance is the higher proportion of pupils for whom English was not their first language that is seen in free schools. This is because these pupils, on average, tend to make more progress than pupils with similar prior attainment nationally. It may be this effect that is being observed rather than a free schools effect.
An initial ‘similar pupils’ analysis was only possible on the 2016 data which covers only a small number of schools. It is important that this type of analysis is carried out on later cohorts and at other key stages before commenting on the effectiveness of free schools. In addition this report has made no attempt to scrutinise participation, attainment and destinations post-16.
Conclusion
Since their introduction in 2011, free schools have often been a divisive issue within the education system. The analysis presented in this report demonstrates strengths and weaknesses in the arguments on both sides of that debate.
Free schools are contributing to the supply of new school places and are more likely to have been set up in areas with the greatest need for places. But they have also been set up where there was already an excess in school places which may ultimately lead to inefficiencies in the school system. The programme has also been less successful in setting up free schools in areas where greater quality school places are needed.
Free schools do not appear to be initially popular with parents, although there is some evidence that this may change over time once they are established. Free schools are more prevalent in areas of high deprivation, but their intake of disadvantaged pupils is only average, suggesting that the pupils that attend free schools are not fully representative of the areas that they serve.
12
Introduction
Free schools in England were introduced in 2010 by the Coalition Government, and were based on a similar concept in Sweden and the 'charter school' model adopted by parts of the United States and Canada.
The Academies Act 2010 enshrined free schools in law, giving parents, local communities, charities, universities, religious groups and other organisations the power to set up new, state-funded free schools. The first 24 free schools opened in September 2011 and there were 347 free schools in operation during the 2016/17 academic year.
Free schools are a type of academy and as such operate outside of the control of local authorities and have the same freedoms, including to set teachers' pay and conditions, to set term dates and the length of school days and are exempt from delivering the National Curriculum. Free schools are state-funded (they receive funding directly from the Department for Education), not-for-profit schools.
This report analyses the coverage of free schools across England, considers whether they have helped to add capacity to areas in need of additional school places or higher quality school places, looks at whether they are popular with parents, their demographic composition and, finally, emerging findings of their impact on pupils' attainment and progress.
The report does not analyse data in relation to post-16 performance or student destinations. Nor does it attempt to make an assessment of whether the free schools programme provides value for money.
13
Part 1: Access to free schools
Background
The Department for Education states that “proposers of free schools are required to demonstrate parental demand [and] whether there is either a need for additional school places or a need for additional high-quality school places in the local area.”5In their 2017 review of capital funding for schools, the National Audit Office concluded that “free schools often meet a demographic need for new school places, but they are also creating spare
capacity, which may have implications for schools’ financial sustainability.”6
The first free schools opened in September 2011. This first wave of openers comprised a total of 24 schools: 7 secondary free schools and 17 primary schools. The first special, alternative provision and 16-19 were opened the following year. After relatively fast expansion in the second and third year the pace of openers has slowed. By the start of the 2016/17 academic year, there were 345 free schools, educating around 83,000 pupils. A further two schools opened during the 2016/17 academic year bringing the total to 347. Figure 1.1: Number of open free schools and number of pupils by year open7
This table excludes the eight free schools that were recorded as closed by the end of the 2016/17 academic year.8
In this section, we consider the extent to which the Department for Education’s conditions
have been met by the schools that have been opened between September 2011 and May 2016. When considering the geographic coverage of free schools it should be remembered
5Department for Education, Mainstream free schools: assessing the need for a new school, March 2015
https://www.gov.uk/government/publications/mainstream-free-schools-assessing-the-need-for-a-new-school
6 National Audit Office, Department for Education: Capital funding for schools, February 2017 https://www.nao.org.uk/wp-content/uploads/2017/02/Capital-funding-for-schools.pdf
7 A further two free schools opened during the 2016/17 academic year bringing the total to 347. 8 These schools have not all fully closed. A school may be reported as closed on Edubase because it has re-opened under a different name or governance arrangement.
Free schools Free schools - 16-19
Free schools - special
Free schools - alternative provision
Number of free schools Sep-11 24 0 0 0
Sep-12 70 1 3 5
Sep-13 143 6 8 18
Sep-14 198 14 11 29
Sep-15 237 16 19 32
Sep-16 269 18 23 35
Number of pupils in free schools
Sep-11 3,900 0 0 0
Sep-12 10,100 0 0 200
Sep-13 21,800 500 200 500
Sep-14 38,100 1,900 400 800
Sep-15 55,900 3,200 700 1,000
14
that the programme is ‘demand led’ in that it relies on groups applying to the Department for Education rather than the Department directing where a school should be located.
Free school governance
Free schools are a type of academy, and as with converter and sponsored academies, are overseen by an academy trust (either a single-or multi-academy trust). The Department for Education categorises academy trusts by the number of pupils that attend a trusts’s schools:
▪ <1,200 pupils: starter trusts;
▪ 1,200 – 5,000 pupils: established trusts; ▪ 5,000 – 12,000 pupils: national trusts; and ▪ 12,000+ pupils: system leader trusts.
Of the 347 free schools open by the end of the 2016/17 academic year, 138 (40 per cent) were in single-academy trusts (see Figure 1.2). This means that the prevalence of ‘stand
-alone’ free schools is higher than that of converter academies and much higher than that of
sponsored academies.
However, free schools are twice as likely as converter academies to be in large national, or system leader, trusts. These characteristics are likely to reflect the different routes by which a free school may arise.
Figure 1.2: Governance of free schools that were open by the end of the 2016/17 academic year
Regional variation in free school openers
Whilst growth in the number of free schools has been steady since the inception of the free schools programme, they still represent less than 2 per cent of all state-funded schools and many areas of the country have no free school places at all.
Free schools are now found in all regions of England, however, of the 347 free schools open by the end of the 2016/17 year, 124 were in London. This was over three times that in the next three regions (the South East, North West and the East of England). By contrast, the North East had just 9 free schools. Figure 1.4 demonstrates that this is not just a case of different sized regions. London accounts for 12 per cent of all state-funded schools but 36 per cent of free schools, the North East has 5 per cent of all state-funded schools but 3 per cent of free schools.
1341
104
138
7
38
1044
306
76
9
5 1804
784
70
16
4 289
307
36
3
1 96
386
27
0% 10% 20% 30% 40% 50% 60% 70% 80% 90% 100%
Converter academies
Sponsored academies
Free schools
Studio schools
University technical colleges
15
Figure 1.3: Number of free schools by end of the 2016/17 academic year by region
Figure 1.4: The percentage of all state-funded schools and all free schools that were in each region at the end of the 2016/17 academic year
Free school places by small geographical areas
We now estimate the number of free school places that are available in each small area in England to illustrate the current reach of free schools.
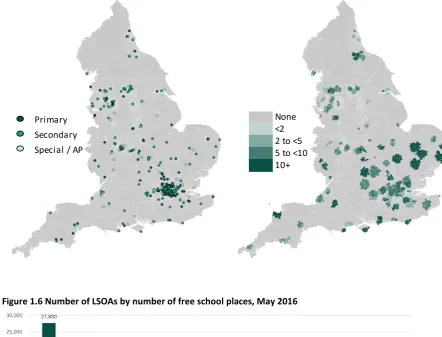
We calculate a proxy catchment area for each open free school by identifying the lower layer super output areas (LSOAs) that are within a reasonable travel distance of the school.9 The total number of places in the school is then divided equally between each of these LSOAs. Repeating for each free school gives a total number of free school places in each area and adopting the same approach across all schools provides a proxy pupil count in each area. This enables us to produce a measure of relative free school density for each LSOA in England.10 Figure 1.5 maps the location of free schools in England (left) and the relative density of free school places (right). It illustrates the high density of free school places in London, the South East, the East of England and the urban areas of the North West. But large areas of the country are currently untouched by the growth of free schools. In fact, nearly two-thirds of all LSOAs in England have no free school places at either primary or secondary level. This
9 LSOAs are small geographic areas with a population of between 1,000 and 1,500. A reasonable travel distance is the distance travelled to school by up to 90 per cent of pupils at schools of the same phase and area type nationally. Further details are provided in Annex 1.
10 School capacity data are taken from the School Capacity Survey from May 2016. This covers mainstream free schools only and excludes any free school opened after that point.
124
40 39 38 34
23 22 18
9 0 20 40 60 80 100 120 140 London South East North West East of England West Midlands Yorkshire and the Humber South West East Midlands North East
12% 15% 15% 12% 11% 10% 11% 9%
5% 36%
12% 11% 11% 10%
7% 6% 5%
3% 0% 5% 10% 15% 20% 25% 30% 35% 40%
London South East North West East of England West Midlands Yorkshire and the Humber
South West East Midlands
North East
16
[image:16.595.70.513.138.475.2]increases to three quarters in the North East and four-fifths in the East Midlands, whilst around one-sixth of LSOAs have at least 10 places (Figure 1.6).
Figure 1.5: The location of free schools by end of the 2016/17 academic year and the relative density of free school places in primary and secondary schools (May 2016)11,12
Figure 1.6 Number of LSOAs by number of free school places, May 2016
Location by need for new places
Using a similar approach to identifying the reach of free schools used above, we calculate the number of school places, and number of pupils, at LSOA level towards the end of the
2010/11 academic year and apply projected growth in numbers between 2011 and 2016 derived from local authority estimates.13
11 The school capacity dataset does not include special and alternative provision schools and therefore they are excluded from the density analysis.
12Contains National Statistics data © Crown copyright and database right 2016. Contains OS data © Crown copyright and database right 2016
13 The methodology is set out in full in Annex 1.
27,800
100 1,200
2,400
1,300 20,800
700
3,500 4,600 3,300
19,500
500
2,600 4,500
5,700
0 5,000 10,000 15,000 20,000 25,000 30,000
No free school places <2 2 to <5 5 to <10 10+
Primary Secondary Any mainstream Primary
Secondary Special / AP
17
For each LSOA we are then able to calculate a modelled estimate of how full local schools are (number of pupils on roll divided by number of places) for spring 2016 – we call this the
school ‘occupancy rate’. This is what we estimate would have been the position if there had been no changes in the number of places available in local schools – through closures, expansion of existing schools, or new provision including free schools. LSOAs are then grouped by this rate and we examine how the number of places has changed through these three routes (see Figure 1.7 and Figure 1.8).14
We find that:
▪ At both primary and secondary level, free school places have been created at a greater rate in areas that were estimated to experience a shortage in school places, suggesting some success at linking free school opening to areas in need of new school places. Primary free schools created just under 17 places per 1,000 pupils in areas where school occupancy was estimated to be between 105 and 110 per cent, whilst just under 4 places per 1,000 pupils were created in areas where occupancy was between 90 and 100 per cent. The equivalent figures at secondary level were 51 and 31 places.
▪ Free school places have been created in areas where there was already likely to be an excess in school places, particularly at secondary. However, this is not unique to free schools. There was also some expansion in other schools in areas where new school places may not have been needed. Secondary free schools created 20 new places per 1,000 pupils in areas where school occupancy was estimated to be between 80 and 90 per cent. Existing schools in these areas had a net change of 14 places per 1,000 pupils.
▪ At both primary and secondary level, changes in existing schools were more strongly associated with estimated need than free schools were. Growth in existing schools still made up the majority of additional places particularly at primary level (in areas in need of new places, the expansion of existing schools increased places at a rate eight times that of free schools).
14The occupancy rate is essentially “how full would schools have been without any changes in the
18
Figure 1.7: Change in number of school places per 1,000 pupils between 2011 and 2016 by estimated school occupancy rates at LSOA level - primary
Figure 1.8: Change in number of school places per 1,000 pupils between 2011 and 2016 by estimated school occupancy rates at LSOA level – secondary
Location by quality of existing provision
We now group LSOAs by the quality of school places at the end of the 2010/11 academic year. We choose this point as it reflects the position at the start of the free schools programme. The quality of places is defined according to the latest Ofsted rating of all schools within reach of the LSOA at that point.15
We find that:
▪ At primary level there is little relationship between the quality of existing provision and the establishment of new free school places. In LSOAs amongst the top fifth for Ofsted performance an additional 8.9 places per 1,000 pupils were created in free schools. In areas in the bottom fifth there were an additional 8.7 places per 1,000 pupils (Figure 1.9).
▪ At secondary level free school places were slightly more likely to be established in areas with existing high-quality provision. In LSOAs amongst the top fifth for Ofsted performance an additional 31.6 places per 1,000 pupils were created in free schools.
15 The methodology is set out in full in Annex 1.
+3.4
+38.2
+64.9
+94.8
+117.6
+163.6
+0.2
+1.9 +3.9 +9.2 +16.8
+20.3
+3.8 +3.3 +7.1 +7.9 +10.6
+16.5
-20 0 +20 +40 +60 +80 +100 +120 +140 +160 +180
<80% 80-90% 90-100% 100-105% 105-110% >=110% Existing schools (including closures) Free Schools Other New Schools
-95.4
-14.8
+26.4
+59.0
+93.3
+70.1
+19.5 +20.0 +31.2
+58.2 +51.2
+76.1
+28.7 +24.2 +22.8 +30.1 +25.6 +47.8
-150 -100 -50 0 +50 +100 +150
19
In areas in the bottom fifth there were an additional 25.2 places per 1,000 pupils (Figure 1.10).
It should be remembered that it is difficult to interpret this figure in isolation given that schools may be being set up due to the need for more school places, and the
disproportionately large number of free schools that have been set up in London where standards are generally higher than elsewhere.
Figure 1.9: Change in number of school places between 2011 and 2016 by quality of school places by LSOA - primary
Figure 1.10: Change in number of school places between 2011 and 2016 by quality of school places by LSOA – secondary
Location by the need for new places and better schools
We now examine the creation of capacity by free schools by both the estimated local capacity and the quality of provision. Each LSOA is categorised in the way set out above on both dimensions. The number of free school places per 1,000 pupils is then calculated. This analysis is set out in Figure 1.11 and Figure 1.12. Within these tables:
▪ If free schools are opening where additional places are needed, then the number of places should increase, moving left to right.
+90.1 +99.2 +95.0 +95.1 +92.8
+8.9
+9.7 +10.0 +11.7 +8.7
+5.5 +8.5 +10.7 +11.4 +9.1
-20 0 +20 +40 +60 +80 +100 +120
Top fifth 2 3 4 Bottom fifth
Existing schools (including closures) Free Schools Other New Schools
+30.6
+15.4
-5.6
-15.5
-20.3
+31.6 +31.1
+28.8
+25.0 +25.2
+23.2 +23.4 +26.0 +26.8 +25.3
-30 -20 -10 0 +10 +20 +30 +40
Top fifth 2 3 4 Bottom fifth
20
▪ If free schools are opening where standards are currently low, then the number of places should increase, moving top to bottom.
We find that the free schools programme has been reasonably successful in linking new places to areas of need. This is particularly true at primary level. However, it appears to have been less successful at introducing new places where standards, at the start of the
programme, were low.
Figure 1.11: Change in number of school places at LSOA level (per 1,000 pupils) between 2011 and 2016 by quality of school places and estimated school occupancy rates – primary
Figure 1.12: Change in number of school places at LSOA level (per 1,000 pupils) between 2011 and 2016 by quality of school places and estimated school occupancy rates – secondary
Summary
Free schools are a growing part of the school system. The first schools opened in September 2011 and by the end of the 2016/17 academic year there were 347 open free schools. They are found in every region of England.
However, they still represent just 2 per cent of all state-funded schools and we found that two-thirds of the country are not within a reasonable travel distance of any free school.16 This relative sparsity of free schools is important to keep in mind when considering their impact on the system – in terms of expansion of school places, the effect on school choice, and on pupil outcomes.
The analysis presented here supports the claim that free school growth has been greatest in the areas most in need of new school places, but we also find significant numbers in areas where there is already an excess of capacity. This is also true for other new schools opened over the same period. Overall, it is the expansion of existing schools that generates the most capacity within the system and this is more closely linked with need.
To date, the free schools programme, particularly at secondary level, has been less successful in addressing areas of underperformance (even after controlling for the need for places). Given the regional bias in the location of free schools – with many of these early openers
16 Defined by lower layer super output areas.
<80% 80-90% 90-100% 100-105% 105-110% >=110% Top fifth 0.0 0.2 1.7 5.6 16.5 20.2
2 0.0 0.5 5.1 7.7 13.5 20.3
3 0.0 0.9 3.6 9.5 15.9 22.4
4 0.0 2.5 3.4 13.2 19.3 23.4
Bottom fifth 0.5 4.1 5.0 9.2 19.5 14.3
Estimated school occupancy
Q
u
al
it
y
<80% 80-90% 90-100% 100-105% 105-110% >=110% Top fifth 9.5 19.1 30.8 48.4 49.2 83.5
2 33.3 18.5 27.4 70.9 65.3 64.6
3 19.2 17.5 36.0 61.1 61.9 41.5
4 19.7 18.7 31.5 58.0 22.4
-Bottom fifth 16.8 25.5 29.4 51.5 11.9
-Q
u
al
it
y
21
22
Part 2: The characteristics of free school pupils and their
local communities
Background
Information on the characteristics of pupils that attend free schools is, as with all state-funded schools, collected via the School Census. Amongst a range of data, the School Census records eligibility for free school meals, first language, ethnic group, and special educational needs and disabilities at an individual pupil level. This is then published by the Department for Education at a variety of levels from national aggregations to individual schools. We use this data to examine the characteristics of pupils that attend free schools and the areas served by free schools. In doing so we consider the extent to which free schools reflect their local communities.
Descriptive statistics
Department for Education statistics show that:
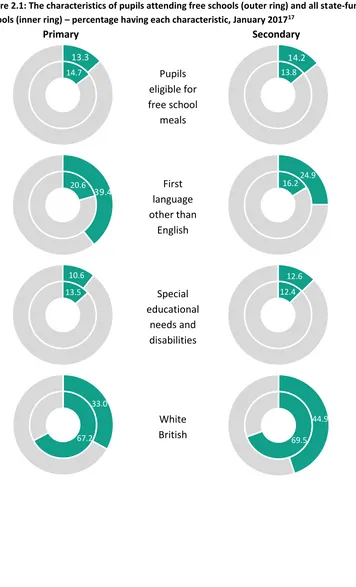
▪ Pupils in free schools have a similar propensity to be eligible for free school meals as pupils in other state-funded schools. In primary free schools 13.3 per cent of pupils are eligible for free school meals compared with 14.7 per cent of pupils nationally. In secondary free schools 14.2 per cent of pupils are eligible for free school meals compared with 13.8 per cent of pupils nationally.
▪ Pupils in free schools are more likely to have a first language other than English than pupils in other state-funded schools. In primary free schools 39.4 per cent of pupils have a first language that is other than English compared with 20.6 per cent of pupils nationally (equivalent figures for secondary schools are 24.9 and 16.2 per cent).
▪ Pupils in free schools are much less likely to be from white British backgrounds than pupils in other state-funded schools. In primary free schools 33.0 per cent of pupils are recorded as white British compared to 67.2 per cent of pupils nationally (equivalent figures for secondary schools are 44.9 and 69.5 per cent).
23
Figure 2.1: The characteristics of pupils attending free schools (outer ring) and all state-funded schools (inner ring) – percentage having each characteristic, January 201717
Primary Secondary
Pupils eligible for free school
meals
First language other than
English
Special educational
needs and disabilities
White British
17 Department for Education, Schools, pupils and their characteristics, June 2017
https://www.gov.uk/government/statistics/schools-pupils-and-their-characteristics-january-2017; and Department for Education, Special educational needs in England, July 2017
https://www.gov.uk/government/statistics/special-educational-needs-in-england-january-2017
14.7
13.3
13.8
14.2
20.6
39.4 16.2
24.9
13.5 10.6
12.4 12.6
67.2 33.0
24
Pupils from white British backgrounds
The statistics set out above show that the proportion of pupils from white British
backgrounds is much lower in free schools than across all state-funded schools particularly at primary. There is likely to be a close correlation with the similar results seen for first
language.
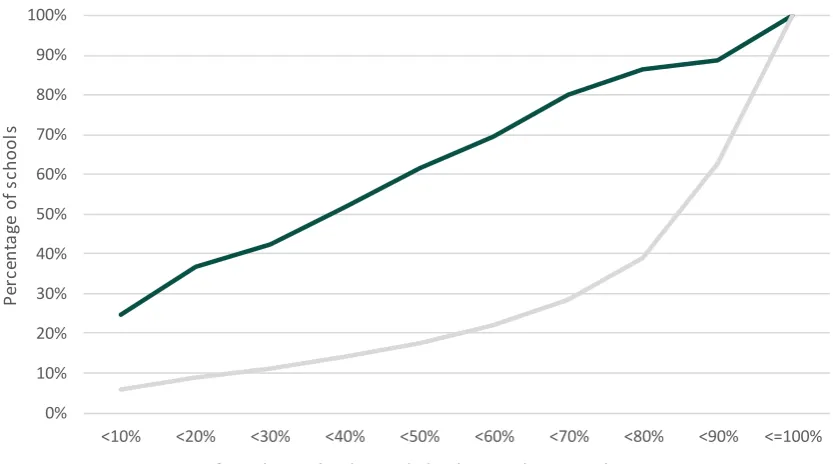
Figure 2.2 shows how the rates vary at school level. It shows that white British pupils are in a minority in around 60 per cent of primary free schools. Figure 2.3 shows that white British pupils are in a minority in just over half of secondary free schools. These figures require some context. As set out in Part 1, a disproportionate number of free schools have been set up in London. The demographic profile in the capital is very different from other regions of England. In fact, in the capital nearly three-quarters of school aged pupils are from non-white British backgrounds.
Figures 2.4 and 2.5 split the school distributions described previously by London and
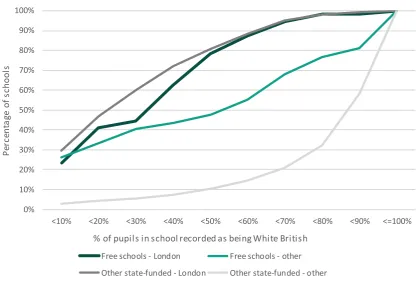
elsewhere. They show that the distribution of non-white British pupils between free schools in London is similar to other schools in the city. For example, in London’s primary free
schools, white British pupils are in the minority in four-fifths of schools – the same rate as seen in other state-funded primary schools.
Outside of London, free schools still tend to have higher proportions of non-white British pupils than other schools. In primary free schools outside of London, white British pupils were in the minority in 48 per cent of schools compared with 10 per cent in other schools. The equivalent figures for secondary were 33 per cent and 11 per cent.
25
Figure 2.2: Cumulative distribution of schools by proportion of pupils that are white British by type of school, January – 2017 primary
Figure 2.3: Cumulative distribution of schools by proportion of pupils that are white British by type of school, January – 2017 secondary
0% 10% 20% 30% 40% 50% 60% 70% 80% 90% 100%
<10% <20% <30% <40% <50% <60% <70% <80% <90% <=100%
P
er
ce
n
ta
ge
o
f
sc
h
o
o
ls
% of pupils in school recorded as being White British
Free schools - all Other state-funded - all
0% 10% 20% 30% 40% 50% 60% 70% 80% 90% 100%
<10% <20% <30% <40% <50% <60% <70% <80% <90% <=100%
P
er
ce
n
ta
ge
o
f
sc
h
o
o
ls
% of pupils in school recorded as being White British
[image:25.595.83.507.422.647.2]26
Figure 2.4: Cumulative distribution of schools by proportion of pupils that are white British by type of school and region, January – 2017 primary
Figure 2.5: Cumulative distribution of schools by proportion of pupils that are white British by type of school and region, January – 2017 secondary
0% 10% 20% 30% 40% 50% 60% 70% 80% 90% 100%
<10% <20% <30% <40% <50% <60% <70% <80% <90% <=100%
P
er
ce
n
ta
ge
o
f
sc
h
o
o
ls
% of pupils in school recorded as being White British Free schools - London Free schools - other
Other state-funded - London Other state-funded - other
0% 10% 20% 30% 40% 50% 60% 70% 80% 90% 100%
<10% <20% <30% <40% <50% <60% <70% <80% <90% <=100%
P
er
ce
n
ta
ge
o
f
sc
h
o
o
ls
% of pupils in school recorded as being White British Free schools - London Free schools - other
[image:26.595.84.499.425.689.2]27
Disadvantaged pupils
The Department for Education’s published statistics set out above suggest that the proportion of pupils from low income backgrounds is similar in free schools to all state-funded schools with, if anything, the proportion in primary schools being slightly lower. We examine this further by first considering how the creation of free school places relates to the local area. As set out above, we estimate the change in capacity in each LSOA from changes to existing schools, free schools, and other new schools. This is then broken down by the Income Deprivation Affecting Children Index (IDACI). IDACI measures the proportion of children in an area that live in low income families.
Figure 2.6 (primary) and Figure 2.7 (secondary) show the number of free school places created per 1,000 pupils in ten bands of IDACI scores where 1 is the most deprived and 10 the least deprived. They show that:
▪ At primary level, free school places have been created at a greater rate in areas of high deprivation than low deprivation. In the most deprived band, 13.3 places were created per 1,000 pupils; in the least deprived it was 8.7 (and in the second least deprived it was 5.7).
▪ The creation of other school places (through existing schools or other new schools) was also correlated with disadvantage in the local area. However, it was areas with slightly lower levels of disadvantage (but still above average) that saw the greatest increases.
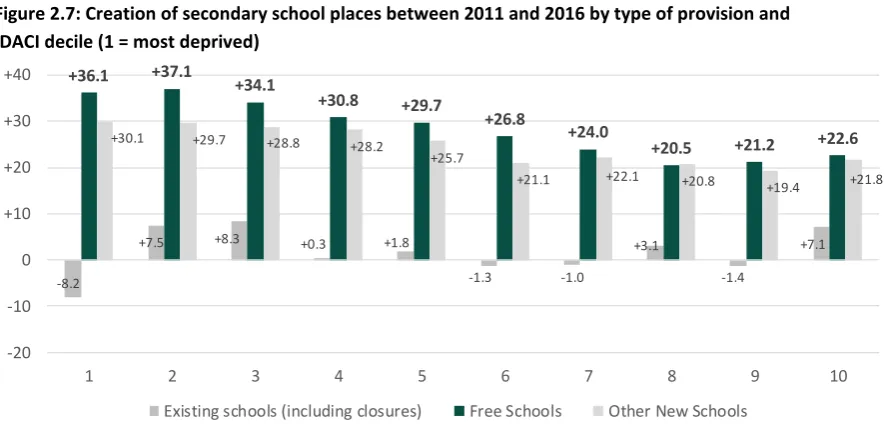
▪ At secondary level, free school places have been created at a greater rate in areas of high deprivation than areas of low deprivation. In the most deprived band, 36.1 places were created per 1,000 pupils; in the least deprived it was 22.6 (and in the second least deprived it was 21.2).
▪ The creation of places in other new schools was also strongly correlated with levels of disadvantage in the area. However, there was no such relationship for existing schools.
This supports the claim that free school places have been created in greater numbers in areas with higher levels of disadvantage. When we examine the total number of school places (not just the change between 2011 and 2016) we see a clear difference between free schools and all state-funded schools.
28
[image:28.595.75.519.268.480.2]Figure 2.6: Creation of primary school places between 2011 and 2016 by type of provision and IDACI decile (1 = most deprived)
Figure 2.7: Creation of secondary school places between 2011 and 2016 by type of provision and IDACI decile (1 = most deprived)
Figure 2.8: Distribution of primary school places in 2016 by type of provision and IDACI decile (1 = most deprived) +96.1 +103.9 +107.6 +102.1 +98.9 +90.5 +87.3 +83.7 +82.4 +85.9
+13.3 +14.0 +12.1 +10.4 +9.3 +8.3
+7.5 +7.1 +5.7 +8.7
+9.1 +10.1 +11.5 +10.0 +10.3 +9.0 +7.9 +7.6 +8.0 +7.1
-20 0 +20 +40 +60 +80 +100 +120
1 2 3 4 5 6 7 8 9 10
Existing schools (including closures) Free Schools Other New Schools
-8.2
+7.5 +8.3 +0.3 +1.8
-1.3 -1.0
+3.1
-1.4
+7.1
+36.1 +37.1 +34.1
+30.8 +29.7
+26.8
+24.0
+20.5 +21.2 +22.6
+30.1 +29.7 +28.8 +28.2
+25.7
+21.1 +22.1 +20.8 +19.4 +21.8
-20 -10 0 +10 +20 +30 +40
1 2 3 4 5 6 7 8 9 10
Existing schools (including closures) Free Schools Other New Schools
11% 11% 11% 11%
10% 10%
9% 9% 9% 9%
15% 16% 14% 11% 10% 8% 7% 7% 5% 8% 0% 2% 4% 6% 8% 10% 12% 14% 16% 18% 20%
1 2 3 4 5 6 7 8 9 10
29
Figure 2.9: Distribution of secondary school places in 2016 by type of provision and IDACI decile (1 = most deprived)
Given this distribution of places we might expect free schools to have higher levels of disadvantage than the national average, however this is not the case. This suggests that whilst free schools are being set up in more disadvantaged areas, they are not, yet, attracting a representative number of pupils from the most disadvantaged backgrounds.
We explore this further by examining the intakes of free schools during the 2015/16
academic year. We consider the proportion of pupils that are eligible for free school meals in free schools and other state-funded mainstream schools by the IDACI score of the pupil’s
home LSOA. Figure 2.10 shows this for pupils aged four at the start of the academic year (reception aged pupils) and Figure 2.11 shows this for pupils aged 11 at the start of the academic year (year 7 pupils).
Amongst pupils aged 4 that lived in the most deprived areas (the bottom tenth), 24 per cent of pupils in free schools were eligible for free school meals compared to 32 per cent in other schools. In the next ten per cent of areas, 17 per cent of pupils in free schools were eligible for free school meals compared with 23 per cent of pupils in other schools. In fact, with the exception of the least deprived areas, pupils in free schools were less likely to be eligible for free school meals than other pupils living in similar areas.
We find that of the 6,300 four-year-olds that were in free schools in 2015/16, 11.9 per cent were eligible for free school meals. If they were representative of the areas in which they lived then we estimate that this rate would increase to 16.1 per cent.
This picture is less clear for those aged 11 at the start of the academic year. Free school pupils resident in the most deprived areas are still less likely to be eligible for free school meals than other pupils in those areas. In the most deprived areas (the bottom tenth), 30 per cent of pupils in free schools were eligible for free school meals compared with 34 per cent of pupils in other schools. However, once you move beyond the bottom fifth of areas, the rate of free school meal eligibility in free schools matches that of other schools. In the least deprived half of areas, free school meal eligibility is actually higher than that in other areas.
We find that of the 10,800 11 year-olds that were in free schools in 2015/16, 17.0 per cent were eligible for free school meals (2 percentage points higher than the average of all 11
10% 11% 10% 10% 10% 10% 10% 10%
9% 9%
13% 14% 13%
11% 11%
9%
8%
7% 7% 8%
0% 2% 4% 6% 8% 10% 12% 14% 16% 18% 20%
1 2 3 4 5 6 7 8 9 10
30
year-olds). If they were representative of the areas in which they lived then we estimate that this rate would increase to 17.5 per cent.
Figure 2.10: Proportion of pupils aged 4 who were known to be eligible for free school meals in free schools and other state-funded mainstream schools by IDACI decile (1 = most deprived)
Figure 2.11: Proportion of pupils aged 11 who were known to be eligible for free school meals in free schools and other state-funded mainstream schools by IDACI decile (1 = most deprived)
Summary
Overall, pupils at free schools have a similar propensity to be eligible for free school meals or have special educational needs and disabilities as pupils at other state-funded schools. They are also far more likely to be from a non-white British background or have a first language that is other than English. The underlying patterns are more complex than these statistics convey.
There is partly a London effect in operation when looking at the composition of free schools. In terms of the proportion of pupils that are from non-white British backgrounds, free schools in London follow a similar distribution to other state-funded schools in the capital. Outside of London, the proportion of pupils from non-white British backgrounds in free schools is lower than in London, but higher than other schools outside of the capital. The relatively high number of pupils with a first language other than English will be an important
32% 23% 18% 14% 11% 9% 7% 5% 3% 2% 24% 17% 14% 11% 9% 5% 4%
2% 3% 2%
0% 5% 10% 15% 20% 25% 30% 35% 40%
1 2 3 4 5 6 7 8 9 10
Other schools Free schools
34% 26% 20% 16% 12% 9% 7% 5% 4% 2% 30% 24% 20% 16% 12% 12% 9% 7% 5% 4% 0% 5% 10% 15% 20% 25% 30% 35% 40%
1 2 3 4 5 6 7 8 9 10
31
consideration when examining the performance of free schools. We know that these pupils, on average, make more progress than those with English as their first language.
The analysis here supports the Department for Education’s claim that a large number of free
32
Part 3: School choice and preferences
Background
Since the beginning of the free schools programme, the Department for Education has frequently asserted that these schools are popular with parents. For example, as the first free schools opened in September 2011, the Department claimed that “15 of the 24 schools that were opening were oversubscribed with some seeing more than three applications for
one school place”.18 More recently, the beginning of the 2017/18 school year saw further
announcements on new free schools and that “free schools are popular with parents, deliver choice and innovation”.19
In this section we consider the extent to which those claims are supported by the
Department for Education’s own data through an exploration of pupil preferences collected through the school admissions process.
Applications to primary schools are made in the January of the preceding academic year and applications to secondary schools are made in October of the preceding academic year. Both are largely co-ordinated by the relevant local authority.20 Preferences are assessed against pre-determined admissions criteria set by the authority or individual school. When setting these criteria, all state-funded schools, including free schools, must comply with the School Admissions Code.21
Depending on the local authority, parents are able to express an ordered preference for between three and six schools – though parents may choose not to express a full set of preferences. This feature of the admissions process is crucial when considering the relative popularity of schools through preference data. It means that on average, each pupil expresses a preference for around 2.4 schools. So, any claim based on the ‘number of applications per place’ needs further context around the order of the preferences.
The analysis in this section relates to admissions to schools in the 2015/16 academic year. It is based on preference data at individual pupil level matched to the January School Census. This dataset allows us to see:
▪ Which pupils, who were in a state-funded secondary school in January 2016, submitted an application through a local authority co-ordinated scheme; ▪ The preferences expressed in that application (first preference school, second
preference etc.);
▪ The school that the pupil was offered through the local authority scheme; and
18 Department for Education, New free schools are a popular choice for parents, September 2011 https://www.gov.uk/government/news/new-free-schools-are-a-popular-choice-for-parents 19 Department for Education, Back to school for thousands of pupils as new free schools open, September 2017
https://www.gov.uk/government/news/back-to-school-for-thousands-of-pupils-as-new-free-schools-open
20 Free schools are able to opt-out of local authority co-ordination in their first year. 21 Department for Education, School admissions code, September 2015
33
▪ The school that the pupil was attending in January 2016.
Propensity for free schools to be first preference
We firstly consider the proportion of applications to each school type by the order of preference. Such an analysis provides an indication of the desirability of a particular school within parental preferences – whether the school is where they want their child to attend or whether it is in some senses a ‘fall-back’ option.
Across all primary schools, there were a total of 1.19 million preferences expressed across 506,000 pupils. 43 per cent were first preference.22 Of all preferences expressed for a primary free school, just over 35 per cent were a first preference. This was the lowest of any school type. Just under 37 per cent of applications to free schools were as a third preference or below, the highest of any school type (Figure 3.1). The rate of first preferences increases when considering schools outside of London (reflecting that applications in London are more likely to include multiple preferences). When considering schools outside of London, the proportion of preferences that were a first preference was still lower for free schools than for any other school, but was not far behind the equivalent figures for community schools and voluntary aided schools (Figure 3.2).
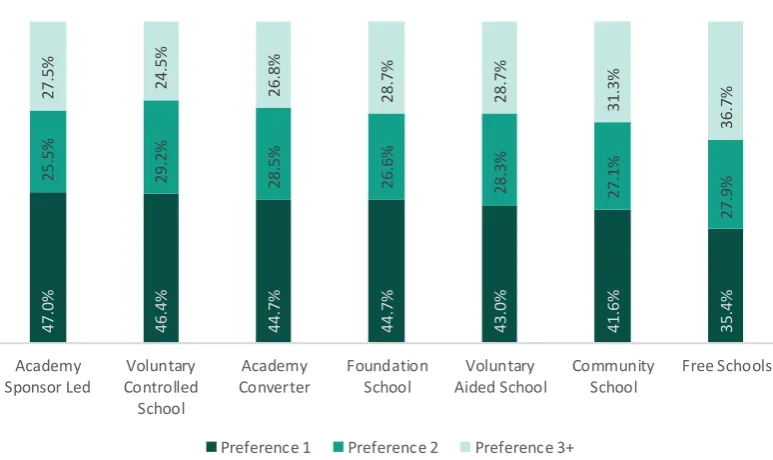
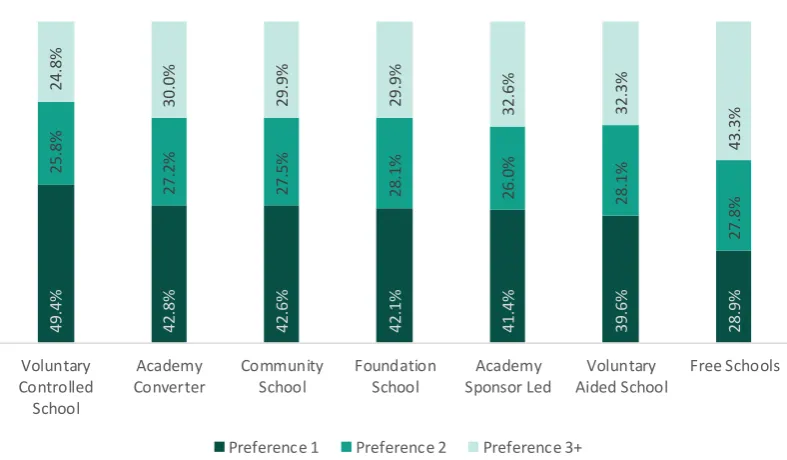
Across all secondary schools, there were a total of 1.16 million preferences expressed across 487,000 pupils. Just over 40 per cent were first preference.22 Of all preferences expressed for a secondary free school, just under 29 per cent were a first preference. This was the lowest of any school type. Just over 43 per cent of applications to free schools were as a third preference or below, the highest of any school type (Figure 3.3). The rate of first preferences increases slightly when considering schools outside of London (reflecting that applications in London are more likely to include multiple preferences), however free schools are still the lowest group in terms of the proportion of preferences that were first preference (Figure 3.4).
34
[image:34.595.87.474.78.308.2]Figure 3.1: Proportion of applications by order of preference – primary
Figure 3.2: Proportion of applications by order of preference – primary schools outside of London
4 7 .0 % 4 6 .4 % 4 4 .7 % 4 4 .7 % 4 3 .0 % 4 1 .6 % 3 5 .4 % 2 5 .5 % 2 9 .2 % 28 .5 % 2 6 .6 % 2 8 .3 % 2 7 .1 % 27 .9 % 2 7 .5 % 2 4 .5 % 2 6 .8 % 28 .7 % 2 8 .7 % 3 1 .3 % 36 .7 % Academy Sponsor Led Voluntary Controlled School Academy Converter Foundation School Voluntary Aided School Community School Free Schools
Preference 1 Preference 2 Preference 3+
50 .4 % 46 .6 % 4 7 .2 % 46 .9 % 45 .2 % 4 5 .2 % 41 .5 % 2 6 .0 % 2 9 .2 % 29 .4 % 27 .2 % 29 .9 % 28 .6 % 2 9 .8 % 2 3 .6 % 2 4 .2 % 2 3 .4 % 25 .9 % 24 .9 % 26 .2 % 2 8 .7 % Academy Sponsor Led Voluntary Controlled School Academy Converter Foundation School Voluntary Aided School Community School Free Schools
35
[image:35.595.83.477.78.308.2]Figure 3.3: Proportion of applications by order of preference – secondary
Figure 3.4: Proportion of applications by order of preference – secondary schools outside of London
Applications to nearest school
The school system in England is diverse, with a range of different school types – e.g.
community schools and academies – and schools with a variety of admission arrangements –
e.g. selection by academic ability or by faith. Despite this diversity, around half of pupils in England still attend their nearest school.
However, we find that this is significantly lower for free schools. At both primary and secondary level, where the nearest school is a free school, just over a fifth of pupils attend the school (Figures 3.5 and 3.6). This is the lowest of any school type.
This can potentially be interpreted in a number of ways. One way would be to conclude that
free schools have, in general, not yet established themselves as ‘the local school’ that
parents choose in the absence of a particularly strong preference for another school. The
4 9 .4 % 4 2 .8 % 4 2 .6 % 4 2 .1 % 4 1 .4 % 3 9 .6 % 2 8 .9 % 2 5 .8 % 2 7 .2 % 27 .5 % 28 .1 % 26 .0 % 2 8 .1 % 2 7 .8 % 2 4 .8 % 3 0 .0 % 2 9 .9 % 29 .9 % 32 .6 % 3 2 .3 % 4 3 .3 % Voluntary Controlled School Academy Converter Community School Foundation School Academy Sponsor Led Voluntary Aided School Free Schools
Preference 1 Preference 2 Preference 3+
5 5 .5 % 4 6 .8 % 48 .4 % 4 4 .6 % 4 7 .2 % 4 3 .2 % 32 .1 % 27 .5 % 28 .0 % 2 8 .9 % 2 8 .7 % 2 6 .8 % 29 .9 % 3 1 .3 % 1 7 .0 % 25 .2 % 2 2 .6 % 2 6 .7 % 26 .0 % 26 .9 % 3 6 .6 % Voluntary Controlled School Academy Converter Community School Foundation School Academy Sponsor Led Voluntary Aided School Free Schools
36
counter argument to this might be that a free school has been set up to offer a different type of education to that offered by current local schools and is not intended to become the first choice of the majority. Voluntary aided schools also have a relatively low proportion of local pupils attending. These predominantly have a religious designation, in other words they are likely to be offering a different type of school to other local schools.
The preference data also suggests that parents are more inclined to submit an application to a free school the longer it has been open. In 2015, primary free schools that had already been open for two or more years attracted applications from around 40 per cent of pupils for whom a free school was their nearest school. For those that had been open for one year this was 31 per cent and for those yet to open it was 22 per cent (Figure 3.7).
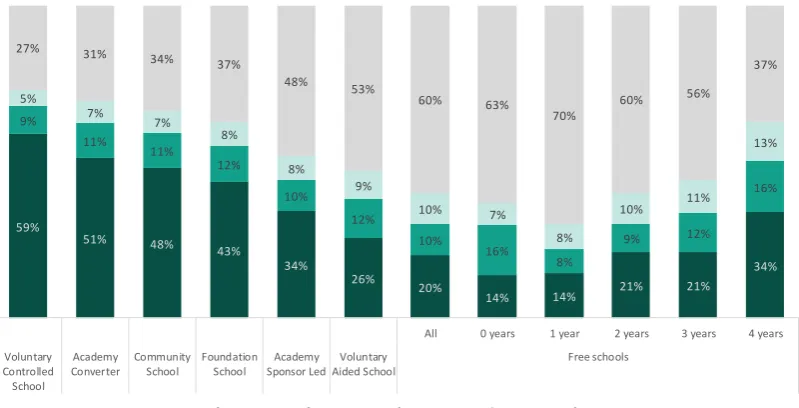
At secondary level the disparity between those open the longest and those yet to open was even greater (63 per cent versus 37 per cent, though those open two or three years were around 40 per cent). Furthermore, the increase in preferences is primarily driven by an increase in first preferences (Figure 3.8).
This analysis is based on a relatively small number of schools, particularly in the case of secondary free schools open for four years. It is not possible to track a particular group of schools over time with the data available (i.e. we cannot look at a school in its first year of opening, its second year etc).
However, this relationship should be monitored closely in future years. It suggests that some free schools may take several years to establish themselves within the local community and may experience lower applications in their earlier years which may then improve over time.
Figure 3.5: Proportion of pupils attending their nearest school by type of nearest school – primary
58.5%
52.1% 51.0% 50.0%
38.0%
33.4%
21.6%
Voluntary Controlled
School
Foundation School
Community School
Academy Converter
Academy Sponsor Led
Voluntary Aided School
37
Figure 3.6: Proportion of pupils attending their nearest school by type of nearest school – secondary
[image:37.595.82.482.515.719.2]Figure 3.7: Proportion of pupils that expressed a preference for their nearest school by school type and free school length of time open – primary
Figure 3.8: Proportion of pupils that expressed a preference for their nearest school by school type and free school length of time open – secondary
62.8% 52.9% 51.6% 48.3% 37.7% 26.1% 21.6% Voluntary Controlled School Academy Converter Community School Foundation School Academy Sponsor Led Voluntary Aided School Free Schools 55%
49% 48% 48%
33% 33%
19%
7% 13%
23% 22% 21%
10%
10% 10% 11%
8% 10%
10%
7% 8%
11% 12% 12%
5%
6% 5% 7%
6% 6%
8%
8%
10%
8% 6% 6%
30% 35% 36% 35%
53% 51%
64%
78% 69%
58% 61% 61%
All 0 years 1 year 2 years 3 years 4 years
Voluntary Controlled School Foundation School Academy Converter Community School Academy Sponsor Led Voluntary Aided School Free Schools
Preference 1 Preference 2 Preference 3+ Did not express preference
59% 51% 48% 43% 34% 26% 20%
14% 14% 21% 21%
34% 9% 11% 11% 12% 10% 12% 10% 16% 8% 9% 12% 16% 5% 7% 7% 8% 8% 9% 10% 7% 8% 10% 11% 13% 27% 31% 34% 37% 48% 53% 60% 63% 70% 60% 56% 37%
All 0 years 1 year 2 years 3 years 4 years
Voluntary Controlled School Academy Converter Community School Foundation School Academy Sponsor Led Voluntary Aided School Free schools
38
Schools within reasonable travel distance
Looking beyond pupils whose nearest school is a free school, we find that even amongst those who live within reasonable travel distance of a free school, pupils are less likely to express a preference for this school than they are for any other type of school. For this analysis, we define pupils who live within reasonable travel distance of a school as those who live within the distance travelled by 90 per cent of pupils nationally, split by location of the school (urban or rural), and by phase (primary or secondary).23 We then calculate the proportion of pupils in this defined area who expressed a preference for the school, compared to all pupils in the area who submitted an application for any school.
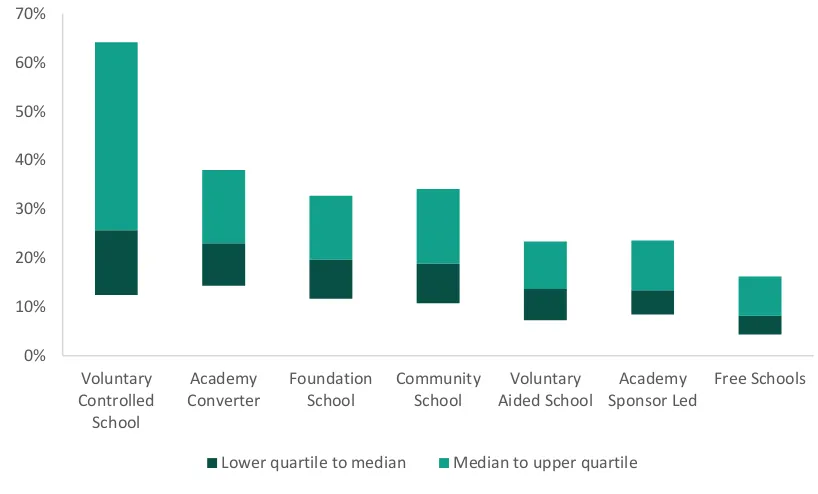
In the charts below, these school-level figures are grouped by school type in order to show for each category the lower quartile, median, and upper quartile of the proportion of pupils who applied to a school within reasonable travel distance. At both primary and secondary level, a lower proportion of pupils living within reasonable travel distance of a free school express a preference for this school (median is 6.6 per cent for primary and 8.2 per cent for secondary).
Figure 3.9: Proportion of pupils within a reasonable travel distance that applied to a school by school type, 2015 – primary
23 For further details see Annex 1.
0% 10% 20% 30% 40% 50% 60% 70%
Academy Converter
Foundation School
Voluntary Controlled School
Community School
Voluntary Aided School
Academy Sponsor Led
Free Schools
39
Figure 3.10: Proportion of pupils within a reasonable travel distance that applied to a school by school type, 2015 – secondary
Summary
The assertion that free schools are popular with parents does not, as yet, appear to be supported by the available data, at least in comparison to other school types. At primary level, just over a third of preferences to free schools were as a first preference. This was the lowest of any school type. This is though, distorted slightly by the prevalence of free schools in London where the effects are larger. Outside of London the prevalence of first preferences for free schools was still lower than for any other school type, but was not far behind the rates seen for community schools and voluntary aided schools. There was no such London effect for secondary free schools. These were well behind other school types in and out of London.
In general, free schools have not yet established themselves as the preferred local school. Nationally, half of pupils attend their nearest school. Where the nearest school is a free school, just 22 per cent of pupils at both primary and secondary level attend that school. However, some context is required for these statistics. Free schools can be set up precisely because groups want to offer something different from what is available from other local
schools. That being the case, these schools may never expect to be the ‘default’ local school
for many.
There is also some indication that patterns of applications and preferences may change over time. It is not unreasonable to assume that some schools will take time to establish the local reputation required in order to attract applications. The analysis presented here suggests that the longer a free school has been open, the greater the proportion of local pupils that will apply. This increase is seen in particular in the expression of first preferences.
Whilst in most cases these rates remain behind those of other schools this analysis does suggest that pupil applications and numbers on roll may be lower in the first years of
0% 10% 20% 30% 40% 50% 60% 70%
Voluntary Controlled School
Academy Converter
Foundation School
Community School
Voluntary Aided School
Academy Sponsor Led
Free Schools
40