Mathematical Reasoning
Evaluation report and executive summary
December 2018
Independent evaluators:
The Education Endowment Foundation (EEF) is an independent grant-making charity dedicated to breaking the link between family income and educational achievement, ensuring that children from all backgrounds can fulfil their potential and make the most of their talents.
The EEF aims to raise the attainment of children facing disadvantage by:
identifying promising educational innovations that address the needs of disadvantaged children in primary and secondary schools in England;
evaluating these innovations to extend and secure the evidence on what works and can be made to work at scale; and
encouraging schools, government, charities, and others to apply evidence and adopt innovations found to be effective.
The EEF was established in 2011 by the Sutton Trust as lead charity in partnership with Impetus Trust (now part of Impetus - Private Equity Foundation) and received a founding £125m grant from the Department for Education. This evaluation was co-funded by the Worshipful Company of Actuaries Together, the EEF and Sutton Trust are the government-designated What Works Centre for improving education outcomes for school-aged children.
For more information about the EEF or this report please contact: Danielle Mason
Head of Research
Education Endowment Foundation 9th Floor, Millbank Tower
21–24 Millbank SW1P 4QP
p: 020 7802 1679
About the evaluator
The project was independently evaluated by a NIESR-led team in partnership with NatCen who were responsible for the administration of assessments. The evaluation team included Lucy Stokes, Nathan Hudson-Sharp, Richard Dorsett, Heather Rolfe, Jake Anders, Anitha George, Jonathan Buzzeo and Naomi Munro-Lott. The NatCen team included Rakhee Patel, Lydia Marshall, Hannah Piggott, and Katie Drysdale.
The lead evaluator was Lucy Stokes. Contact details:
Lucy Stokes
National Institute of Economic and Social Research 2 Dean Trench Street
Smith Square London SW1P 3HE
Tel: 020 7222 7665
Contents
Executive summary ... 4
Introduction ... 6
Methods ... 11
Impact evaluation ... 18
Implementation and process evaluation ... 35
Conclusion ... 51
References ... 54
Appendix A: EEF cost rating ... 55
Appendix B: Security classification of trial findings ... 56
Appendix C: Recruitment materials ... 57
Appendix D: Randomisation code ... 62
Appendix E: Histograms of pre-test scores ... 64
Appendix F: Analysis code ... 65
Appendix G: Histograms of PTM raw score and subscores ... 66
Executive summary
The project
The Mathematical Reasoning programme aims to improve the mathematical attainment of pupils in Year 2 by developing their understanding of the logical principles underlying maths. The programme was previously tested in an EEF-funded efficacy trial (Improving Numeracy and Literacy in Key Stage 1) which suggested that it had a positive impact. The efficacy trial examined the programme under developer-led conditions. This report describes a follow-up effectiveness trial which examined the impact of the programme under everyday conditions in a large number of schools and with less involvement from the original developer.
Mathematical Reasoning lessons focus on developing pupils’ understanding of number and quantitative reasoning. They cover principles such as place value and the inverse relation between addition and subtraction. The programme consists of ten units delivered to pupils by their teachers as part of their usual mathematics lessons. It is designed to be taught over a 12- to 15-week period, with each unit taking approximately one hour. Learning is supported by online games, which can be used by pupils both at school and at home. The intervention was originally developed by a team at the University of Oxford, led by Professor Terezinha Nunes and Professor Peter Bryant. The National Centre for Excellence in the Teaching of Mathematics (NCETM) contributed to the development of the training model used in this trial and coordinated the delivery of the training through the network of Maths Hubs (partnerships of schools created to lead improvements to maths education).
In this trial, the teacher training was delivered using a ‘train-the-trainers’ model through eight Maths Hubs. Each Maths Hub was asked to recruit two ‘Work Group Leads’. The University of Oxford programme developers trained these Work Group Leads who then trained the teachers in participating schools to deliver the programme. To prepare them to train the teachers, Work Group Leads received an initial day of training, used the materials in their own teaching, and then received a further two days’ training. Teachers delivering the programme then received one day of training from a Work Group Lead as well as a visit from the Work Group Lead during programme delivery. They were also able to seek additional support directly from the Work Group Lead or ask questions through an online Maths Hub community.
The impact of the programme on maths attainment was evaluated using a randomised controlled trial involving 160 schools. Schools were randomly allocated either to receive Mathematical Reasoning or to be in the control group, the latter having the opportunity to take part in the programme in the following school year. A process evaluation used observations of training sessions, teacher interviews, lesson observations, and an online survey of treatment and control schools to examine implementation and the factors influencing impact. The trial began in August 2015 and analysis and reporting of the trial completed in December 2018. The project was co-funded by the Worshipful Company of Actuaries.
Key conclusions
1. Pupils who received Mathematical Reasoning made the equivalent of one additional month’s progress in maths, on average, compared to children who did not. This result has high security. 2. Among pupils eligible for free school meals, those who received Mathematical Reasoning made
an average of one additional month’s progress compared to those who did not. This result may have lower security than the overall finding because of the smaller number of pupils.
EEF security rating
These findings have a high security rating. The trial was a well-designed and well-powered randomised controlled trial. The pupils in mathematical reasoning classes were similar to those in the comparison classes in terms of prior attainment. However, 14% of the pupils who started the trial were not included in the final analysis. The main causes of pupils not being included were schools dropping out of the trial and pupils moving school between randomisation and the post-test.
Additional findings
Exploratory analyses investigated the impact of the programme on the different components of the Progress Test in Maths score used to measure pupils’ maths attainment. This suggests there may have been a positive impact on some sub-components of mathematical knowledge and understanding, notably mathematical reasoning.
The process evaluation revealed that the intervention was generally well received by schools, although the extent to which the programme was implemented as intended varied. This was partly because some schools did not have access to the necessary IT equipment or teaching assistant (TA) support. The previous efficacy trial estimated that the programme had a larger positive impact than in this effectiveness trial. There are several differences between the two trials which may explain the smaller effect size in the effectiveness trial. The introduction of the train-the-trainers model might be expected to reduce fidelity because the programme developers are no longer directly training teachers. Also, although a precise comparison is difficult, there was evidence that control group schools in the effectiveness trial were more likely than in the efficacy trial to use other materials or resources to support children’s reasoning in maths. This could have diluted the impact of the programme.
Cost
The cost per pupil per year, averaged over three years, is estimated to be £8. Access to computers or tablets for pupils to play the online games is not included in the cost, but is an important prerequisite for the programme. In terms of staff time, teachers are required to attend one day of training. While the programme is delivered as part of normal maths lessons, teachers had to spend some time preparing lessons and attending the support visit from the Work Group Lead.
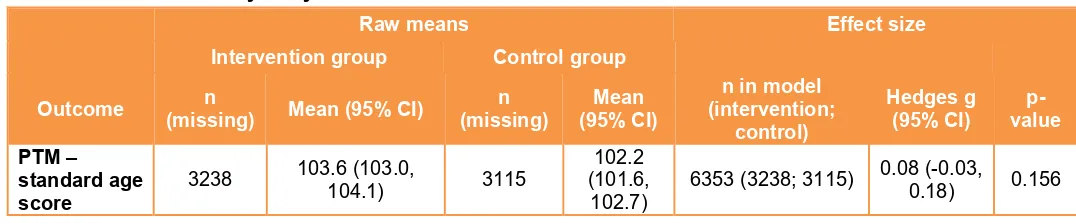
Table 1: Summary of impact on primary outcome
Outcome/ Group
Effect size (95% confidence
Interval)
Estimated months’ progress
EEF security
rating
No. of
pupils P value EEF cost rating
Maths 0.08 (-0.03, 0.18) 1 6,353 0.156 £££££
Maths
FSM pupils 0.09 (-0.07, 0.25) 1 N/A 1,323 0.288 £££££
4. The intervention was generally well received by schools. Teachers reported positive experiences with the training and materials, and were positive about the programme’s focus on fundamental mathematical principles.
Introduction
Background evidence
The Mathematical Reasoning programme develops children’s understanding of the logical principles underlying mathematics. Developed by Professor Terezinha Nunes and Professor Peter Bryant at the University of Oxford, the programme focuses on quantitative reasoning, that is, the ability to understand the relationships between numbers and to use them to solve problems. It is designed for children in Year 2.
Previous research by the developers of the Mathematical Reasoning programme has demonstrated the importance of logical reasoning for mathematical understanding (Nunes, Bryant, et al., 2007), and that both number sense and quantitative reasoning are key predictors for how well children perform in KS2 and KS3 mathematics (Nunes et al., 2011). The programme focuses on developing these two abilities, which although interdependent, can be promoted through different types of activities (Nunes and Bryant, 2015). A previous EEF efficacy trial of the Mathematical Reasoning programme has shown the intervention to have a positive impact on mathematical attainment, with an effect size of 0.2 (Worth et al., 2015). Such efficacy trials are designed to test whether an intervention can work under ideal conditions, with considerable support from the original developer of the intervention. This effectiveness trial provides the opportunity to test whether the intervention can work at scale. As such it is particularly important for the evaluation to explore those factors which have changed in order to implement the intervention on a larger scale, for example, whether the introduction of the ‘train the trainers’ model has consequences for the effectiveness of the programme.
Intervention
group has five turns each with the games. The games are linked to the resources and designed to build on the reasoning skills developed in the classroom session. Due to the use of online games, access to ICT facilities was identified as an essential prerequisite for participation in this trial. Having support from teaching assistants to facilitate classroom differentiation was also identified as preferable. Figure 1 presents a logic model for the intervention, showing how the programme aims to ultimately improve children’s maths attainment both through a direct impact on their mathematical reasoning abilities as well as through bringing about change in teachers’ practice.
In this effectiveness trial, delivery operated through a scalable train-the-trainers model (also shown in Figure 1). Implementing schools were trained by Work Group Leads (WGLs), who were themselves trained by the programme developers at the University of Oxford and supported by the National Centre for Excellence in the Teaching of Mathematics (NCETM) through the Maths Hub programme. This is as opposed to the efficacy trial (Worth et al., 2015) where implementing schools were trained directly by the programme developers. Eight Maths Hubs were identified by the NCETM to take part in the trial, with Work Group Leads then identified by the participating Maths Hubs. The Maths Hub Network is a Department for Education (DfE) funded initiative, coordinated by the NCETM, to support schools in leading improvements in maths education; there are currently 35 Maths Hubs in England. Each hub is a partnership, led locally by an outstanding school or college and bringing together maths education professionals to develop and spread best practice.1 The NCETM advertised the opportunity to take part in the trial to Maths Hubs that could then express interest in taking part. While twelve hubs initially expressed interest, one withdrew because of the time commitment required and a further three offered to step aside once it was clear a sufficient number of hubs were interested. This resulted in eight hubs to participate in the trial, as originally intended. Each hub was asked to recruit two WGLs, generally Year 2 teachers or teachers able to use the materials with a Year 2 group. Involvement from a local higher education institution was also encouraged to provide the opportunity for WGLs to benefit from ongoing discussions about the pedagogy and research base for the project. In some cases the WGLs were themselves based in higher education institutions. In order to facilitate the WGL recruitment process, the NCETM provided hubs with an information sheet about the project and the role of the WGL along with an expression of interest form for potential WGLs to return, including a statement about why they were interested in the role and their previous relevant experience as well as a statement from their headteacher confirming the school’s commitment to the WGL taking on the role.
Figure 1: Logic model for the intervention
The initial training for Work Group Leads took place in February 2016. The initial training event was hosted by the project team at the University of Oxford and the NCETM at the Department for
1 http://www.mathshubs.org.uk/
Education, University of Oxford. During this event, WGLs were provided with background research, were given the opportunity to become familiar with the materials and how to use them, and were given detailed information regarding their role as WGLs and the project (although it was planned just to have one initial training event, in practice a second event was held in April 2016 for a small number of WGLs who had been unable to attend the first event). It was at this initial training event that WGLs were provided with the programme materials, including the project handbook, online access to all materials required to implement the programme, and access to an exclusive online NCETM forum managed by the NCETM Assistant Director, Ione Crossley. WGLs then used the mathematical reasoning programme materials in the schools in which they work before attending a two-day follow-up training session to share their experience of teaching the units and to prepare to train
implementing schools.
The follow-up two-day training event for WGLs was held in June/July 2016. The first day focused on WGLs sharing their experiences of implementing the programme in their own classrooms and to learn more about how they would be evaluated by the NCETM. The second day focused on preparing WGLs to deliver their own training to treatment schools and how to facilitate trial schools’ use of the NCETM community and other programme expectations, such as school visits. WGLs were able to ask questions and share their experiences of supporting treatment schools through the NCETM online community (which was set up and active from the first training event in February 2016). WGLs were also able to make contact with the NCETM directly if they required additional support.
Training days for treatment schools were held throughout September and October 2016 at one of the WGLs’ schools. WGLs were provided with a series of PowerPoint presentations by the NCETM and Oxford to use as the basis for the training to ensure consistency. These slides largely followed WGLs’ own training but had been adjusted slightly and more notes included after feedback at the June/July training days. Each day began with an introduction to the intervention, which included background theory and evidence, and was followed by a description of the specific concepts addressed in the programme and an explanation of the structure and detail of the teaching units. This was followed by a session to explore the use of online materials (including the games) as well as some discussion regarding the nature of the intervention, including arrangements for visits and testing.
After the training, Work Group Leads provided further support to the teachers through a school visit during the period in which they were delivering the programme. Where possible this included a lesson observation and gave teachers an opportunity to discuss any issues they were facing in implementation. Visits occurred between November 2016 and March 2017. Teachers in the intervention group were also able to access a local Maths Hub online community managed by Work Group Leads, where they could ask questions, raise issues, and share experiences.
One of the aims of the process evaluation was to assess fidelity, and later in this report we discuss the extent to which the programme was implemented as intended. A small number of schools withdrew from delivering the programme. Most participating schools delivered all the programme units, although this often occurred over a longer period of time than anticipated. In some schools, there were issues with playing the online games that formed part of the programme. All of these issues are discussed in greater detail in later sections of this report.
Evaluation objectives
The primary research question the impact evaluation was designed to answer is:
What is the effect of the Mathematical Reasoning programme on children’s mathematical attainment (as measured by the Progress Test in Maths) at the end of Year 2?
The impact evaluation also aimed to explore:
What is the effect of the Mathematical Reasoning programme on mathematical attainment at the end of Year 2 among pupils who are eligible for free school meals (FSM)?
The purpose of the process evaluation was to establish fidelity and to identify the factors influencing impact. A key aim was to understand the implications of the introduction of the train-the-trainers model. The protocol for the evaluation is available at:
https://educationendowmentfoundation.org.uk/public/files/Projects/Evaluation_Protocols/EEF_Project _Protocol_Maths_and_Reasoning_effectivness_trial.pdf
Ethics and trial registration
Ethical review was undertaken by the University of Oxford, with the project receiving ethical approval from the Departmental Research Ethics Committee in February 2016. In addition, NIESR adheres to the Ethics Guidelines of the Social Research Association (SRA).
As the intervention was delivered within school hours, consent from the school was considered sufficient with regard to consent for the intervention; and as randomisation took place at the school level (rather than randomising individual pupils), the decision to enter into randomisation could also be made by the school. The requirements of participating in the trial were set out in the Memorandum of Understanding for the evaluation, a copy of which is provided in Appendix C.
A parental information sheet provided with an opt-out form (Appendix C) gave information on the aims of the research and the use of data in order that parents (or legal guardians) were able to make an informed decision about whether to withhold consent from data sharing.
International Standard Randomised Controlled Trial Number: ISRCTN89670776
Data protection
As noted above, schools were given an information sheet providing the details of the trial prior to deciding to take part, with the requirements of participating set out within the Memorandum of Understanding. Parents were also provided with a letter outlining the trial, explaining the reasons for seeking access to data and how this data would be used, along with an opt-out form for consent for data sharing.
Each of the organisations forming part of the evaluation and delivery teams have rigorous data security policies in place. In addition, a data sharing agreement for the project was drawn up between the evaluation and delivery teams setting out agreed processes for the secure storage and transfer of data. This included details of methods for secure transfer of data and the use of password-protection and encryption as appropriate.
Project team
Methods
Trial design
Trial type and number of arms Cluster randomised controlled trial, 2 arms
Unit of randomisation School
Stratification variable(s)
(if applicable)
Maths Hub;
Proportion of pupils eligible for Free School Meals; Prior attainment (school-level KS1 results)2
Primary outcome
variable Progress Test in Maths (GL Assessment), Level 7
measure
(instrument, scale) Overall standardised score
Secondary outcome(s)
variable(s) No secondary outcomes
measure(s)
(instrument, scale) Not applicable
The evaluation used a cluster randomised controlled trial design, with randomisation taking place at the school level. Since the programme is a class-level intervention, the choice was between
randomising classes or randomising schools. As class-level randomisation may have resulted in cross-contamination across trial arms, school-level randomisation was deemed preferable. There were two arms of the trial, with schools randomly allocated to either the treatment arm
(receiving the Mathematical Reasoning programme) or the control group. Schools in the control group were expected to deliver ‘business as usual’ mathematics teaching and were offered the opportunity to take part in the programme in the following school year (that is, for the pupils who were in Year 2 in the following academic year). This waitlist design was chosen with the aim of minimising attrition from the trial.
Participant selection
Schools were recruited to the trial through Maths Hubs, working with the NCETM. Eight hubs were identified to participate in the trial, with each hub aiming to recruit 20 schools. The participating hubs were as follows:
Archimedes (North East, Durham and Tees Valley region)
Central (Birmingham)
GLOW (Gloucestershire, Oxfordshire, Worcestershire)
Kent and Medway
London South East
North West Three
Salop and Herefordshire
Sussex
All English state primary and infant schools within the eight hubs were eligible to participate in the trial. This included schools with one class per year group and multiple classes per year group, as well as schools with classes with mixed year groups. Within each school, all Year 2 pupils and teachers were eligible to participate.
The recruitment process was led by the NCETM working with the participating Maths Hubs. Hubs advertised the project and the opportunity for schools to take part through their newsletters, websites, and mailing lists (using a common set of words produced by the NCETM). Prior to this there was also some informal contacting of schools by hubs to alert them to the project. Interested schools were invited to contact their Maths Hub and were sent an information sheet and expression of interest form to complete and return. The NCETM website also advertised the project, listed participating Hubs, and provided further details and the expression of interest form. The opportunity was also mentioned in other NCETM communication channels including the NCETM newsletter.
Based on the expression of interest forms completed by interested schools, each Maths Hub selected around 20 schools. The expression of interest form included a space for schools to say why they were interested in being part of the study. Once expressions of interest forms were received, Maths Hubs reviewed the forms and had informal conversations with schools, checking that they were eligible and understood what committing to the study involved. Having confirmed eligibility, where more schools expressed interest than could participate (after making some allowance for over-recruitment), Maths Hubs were instructed to select those schools which appeared most committed to the trial.
The selected schools were then asked to sign a Memorandum of Understanding, distribute consent letters to parents (along with an accompanying letter from the headteacher, at the discretion of the school), and return a completed data sheet asking for school and pupil details. All of these were required to be returned prior to randomisation taking place. The NCETM and Maths Hub
administrators worked closely with NIESR during this process so that schools had a single point of contact and clear lines of communication.
Outcome measures
The primary outcome is attainment in maths, as measured by the GL Assessment Progress Test in Maths (PTM). Level 7 of the test was used—the appropriate level for this age group (6–7 years of age). This measure was chosen as the previous efficacy trial had identified a positive and significant impact on attainment in maths as measured by the GL Assessment Progress in Maths (the predecessor to the Progress Test in Maths series). By the time of testing for this trial, the former Progress in Maths test was no longer available for use.
The test assesses pupils’ mathematical skills and knowledge. As specified in the evaluation protocol, the overall standardised score—the ‘Standard Age Score’ as provided by GL Assessment—was chosen as the outcome measure. This is based on the pupil’s raw score (equivalent to the sum of the scores for each of the areas mentioned below) and adjusted for age, and allows for comparison with a nationally representative sample of students of the same age in the U.K. (with the average score equal to 100). The standardised scores are based on the results from a standardisation exercise undertaken by GL Assessment, selecting a sample of U.K. schools through stratified random sampling. For Level 7 of the test the standardisation involved around 4,000 pupils, Further details on the standardisation process are available at https://www.gl-assessment.co.uk/media/1346/ptm-technical-information.pdf
The assessments were administered by NatCen in June and July 2017. The paper version of the test was used, as although a digital version also exists, it was felt that a paper version would be more appropriate for the age group and would help avoid practical issues of implementing digital tests in schools. A team of assessors were trained in carrying out the assessments who were blind to whether schools were in the treatment or control groups. The test typically takes between 45–60 minutes to complete; tests were generally administered to whole classes, although in a few schools tests were carried out in smaller groups. Teachers were present in the classroom to provide reassurance for the pupils. The tests were scored by GL Assessment, which is the standard procedure for marking this test; GL Assessment were also blind to the treatment status of the schools.
No secondary outcomes were specified in the protocol. However, in this report we do provide some exploratory analysis of the separate subscores provided as part of the PTM results in order to investigate whether impacts were apparent for the different aspects of mathematical knowledge. As noted above, subscores are provided for performance in four areas: fluency in facts and procedures, fluency in conceptual understanding, problem solving, and mathematical reasoning, which are intended to link to national curriculum areas. These subscores are based on the total raw score obtained on the questions that relate to each of the four areas. These subscores are not standardised for age. Although the possibility of using KS1 assessments as a secondary outcome was considered at the design stage, ultimately this was not included in the protocol as it was felt there was potential for this to introduce bias as the KS1 data available through the NPD is based on teacher assessment.
Sample size
Information from the efficacy trial (Worth et al., 2015) was used to inform the sample size calculations for this trial. Worth et al. reported an intra-cluster correlation, before controlling for covariates, of 0.12 and that 57% of both school-level and individual-level variance was controlled for by covariates. This information was used to estimate the minimum detectable effect size (MDES). The effect size in the efficacy trial was 0.2; given the possibility of some dilution as a result of the train-the-trainers model, the sample size was chosen with this in mind. The proposed sample size was therefore 160 schools (across eight hubs), assuming 45 pupils per school. On this basis, the MDES was estimated at 0.11 at the time of preparing the protocol (see Table 3).
It was assumed that 15% of pupils in the sample were FSM-eligible (Department for Education statistics indicate the percentage of pupils aged 5–10 eligible for free school meals stood at 15.3% in January 2016; Department for Education, 2016), and assuming that all other parameters remain the same, the MDES for this subgroup stood at 0.14. In our analysis, we identify children eligible for FSM on the basis of whether pupils have been recorded as eligible for FSM at any time in the last six years in any termly or annual School Census (as indicated by the variable everfsm_6_p_spr17 in the NPD).
The later section on participant flow provides further details on the eventual sample size achieved, and reports the implications for the MDES.
Randomisation
Schools recruited by the project team were randomly assigned by the evaluation team.
of pupils in the school attaining level 2 or above in maths at KS1, then the proportion attaining level 3 and then the proportion attaining level 4. This multiway sorting is used to break ties, with outstanding ties broken by random ordering.
With eight hubs, two FSM groups, and two KS1 groups, this resulted in 32 blocks.
The purpose of this blocking was to improve cross-arm comparability of schools and also to increase the precision of estimates. The regression models used to estimate impacts include block identifier variables to reflect this aspect of the randomisation design. Note that the analysis was not undertaken blinded to randomisation.
Randomisation of schools, to achieve a 50:50 allocation, was performed as follows:
each school was assigned a randomly generated number;
schools were sorted by hub/FSM/KS1 block and randomly generated number;
the first school was randomised to treatment or control; and
each subsequent school was assigned to have the opposite outcome of the previous school. This continued until all schools had been assigned.
The computer code used to carry out the randomisation is reported in Appendix D.
Statistical analysis
The impact of the intervention is estimated using linear regression models. Outcomes were regressed on an indicator of whether the school was in the treatment group, block indicators, and a measure of prior attainment. Our analysis is conducted on an intention-to-treat basis. A specific Statistical Analysis Plan was not published for this evaluation as this was prior to the EEF requirement to do so. Our plans for analysis were set out in the trial protocol, however, and the sections relating to randomisation and analysis were reviewed by an independent reviewer.
As specified in the trial protocol, our measure of prior attainment was lagged school-level attainment at KS1. Administering the Progress Test in Maths assessment prior to the intervention would have added considerably to the burdens on participating schools and to the cost of the trial, and thus it was decided to use a measure of prior attainment available from the NPD. The decision to use a measure of school-level attainment was also motivated in part by the findings of Bloom et al. (2007), who show, based on analysis of cluster trials for U.S. schools, that school-level pre-tests can achieve power levels comparable to using individual-level pre-tests.
More precisely, the measure of prior attainment used is KS1 attainment in 2016 (thus relating to the cohort of pupils who were in Year 2 in the year prior to those pupils participating in the trial).3 It is measured as the percentage of pupils in a school who are identified as working at the expected standard or above in maths.4 As a robustness test, we also checked the sensitivity of the results to replacing this school-level measure of attainment with the actual Early Years Foundation Stage Profile (EYFSP) scores of the pupils participating in the trial (using their total EYFSP score).5 While EYFSP scores have
3 We used 2016 KS1 attainment in the analysis, but the block randomisation was based on 2015 KS1 scores. This should reduce any concerns about variation across years.
4 We constructed these school-level averages from pupil-level data based on information from the NPD.
the advantage of being available at pupil-level, arguably this measure lacks sufficient granularity and so this was not chosen as the pre-test for the primary analysis.
As this is a school-level RCT, inference was based on standard errors adjusted for school-level clustering using Stata’s ‘cluster’ option. Clustering standard errors in this way is reasonable given the large number of schools involved. Furthermore, it is an attractive approach relative to the leading alternative of a multilevel model since it avoids the need to assume that school-level effects are uncorrelated with other regressors and the biases that can result when this assumption is not met (Ebbes et al., 2004).
The regression results capture the effect of intention to treat. Estimates are presented as effect sizes, calculated using the Hedges’ g formula. Formally, the effect sizes are calculated as follows:
𝑔∗ Γ 𝑛 𝑛 2 /2
𝑛 𝑛 2 /2∙ Γ 𝑛 𝑛 3 /2 ∙
𝛽
𝑛 1 𝑠2 𝑛 1 𝑠2
𝑛 𝑛 2
where 𝑛 is the number of treatment group observations, 𝑛 is the number of control group observations, Γ is the gamma function, 𝛽 is the regression coefficient on the dummy variable indicating membership of the treatment group, 𝑆2 is the variance of the outcome variable among the treated group and 𝑆2 is the variance of the outcome variable among the control group.
Impacts were also estimated for the subgroup of FSM pupils using the same approach as above. This subgroup was identified using the indicator of whether pupils had been recorded as eligible for FSM at any time in the last six years in any termly or annual Census (as indicated by the variable everfsm_6_p_spr17 in the NPD).
The protocol states that the evaluation will also consider how the data collected on fidelity through the survey could also be used in quantitative analysis to investigate any potential moderation of treatment effects. With this in mind, the survey of treatment schools included three questions that could potentially be used to consider implementation of the programme. Responses to these are summarised later in the report, although the fact that we do not have responses to the survey from all schools and that there is limited variation in the responses to these questions among those schools that do respond, limits the usefulness of that analysis.
In addition, we undertake an exploratory analysis not specified in the trial protocol: investigating whether there are impacts on the subscores of the Progress Test in Maths using the same model as for the primary outcome as specified above. We do so in order to explore whether the intervention may have affected particular aspects of mathematical skills; it is conceivable that such effects are masked when considering the overall score.
Implementation and process evaluation
The overarching purpose of this process evaluation was to examine fidelity to the implementation of the Mathematical Reasoning programme by treatment schools. It explores how the intervention was implemented, whether this differed from the intended treatment model, and the factors that informed this in order to identify potential influences on the programme’s impact. It also explores the perceived impact of the intervention from the perspective of treatment schools as well as monitoring the activity of the control group to establish what was done in the absence of the intervention.
NIESR researchers attending initial training for Work Group Leads (WGLs), hosted by the NCETM in February 2016;
NIESR researchers attending follow-up training for WGLs, hosted by the NCETM in June/July 2016;
NIESR researchers attending teacher training days in three different Maths Hubs, hosted by WGLs; these took place between September and October 2016;
visits to eight schools across three Maths Hubs to interview teachers implementing the intervention, and to observe sessions; these took place in February and March 2017;
attendance at the final training day for WGLs, hosted by the NCETM in July 2017; and
online surveys of both treatment and control schools; this was undertaken in June/July 2017.
Attendance at all training events was supplemented by evaluation forms completed by attendees. These evaluation forms were produced and collated by the NCETM or WGLs respectively. The process evaluation team was also provided with access to the online NCETM forum, scanned copies of WGL’s school visit forms, and with data collected by the project team at the University of Oxford regarding treatment schools’ use of the programme’s online games.
The process evaluation team attended both WGL and teacher training days to understand experiences of the intervention as well as expectations and any concerns. Training content and resources were reviewed to understand both how WGLs are prepared to train other teachers and how all teachers are prepared to deliver the intervention. Findings were triangulated with training day evaluation surveys undertaken and shared by the NCETM, as well as our own interviews and survey of treatment schools. In addition to obtaining experiences of the training, school visits were undertaken to interview teachers on their experiences of using the project resources and delivering the intervention, including views on the appropriateness and value of the resources, any adaptations they made, and pupil response. These were supplemented with classroom observations (using a proforma designed for this purpose) which sought to assess pupil engagement and evidence relating to their understanding of the principles taught in the sessions, as well as observe pupils using online games.
Interviews were digitally recorded, with the agreement of teachers, and transcribed. Data was analysed using a social research 'framework' approach, drawing themes and messages from an analysis of interview transcripts, observations of training and of lessons, and other materials collected by evaluation and project teams.
The online survey of all intervention schools gathered data in a consistent way on implementation and perceived outcomes and on factors that could affect fidelity. It covered experiences of using the lesson plans and guidance materials, including preparation and delivery time. This included questions on teachers’ and schools’ usual approaches to teaching maths, in particular whether this includes a focus on the principles underlying the Mathematical Reasoning programme and whole class teaching. The end-of-project survey was completed by 50 schools, equivalent to 62.5% of all treatment schools that finished the programme (N = 80).
The survey of control schools sought to obtain information regarding usual approaches to teaching maths to Year 2 in order to contribute to broad understanding of implementation, feasibility, and impact. The control group survey was completed by 59 schools, equivalent to 73.8% of control schools that remained in the trial (N = 80).
Mathematical Reasoning intervention. The findings of the process evaluation should be considered with these strengths and limitations in mind. The sections discussing the results from the process evaluation later in this report summarise the key findings from the combined process evaluation data-gathering exercises.
Costs
Information on costs was obtained primarily from the NCETM and the participating Maths Hubs. Some information relating to costs was also provided by the University of Oxford team. This information was then used by the evaluation team to produce an estimate of the cost per pupil per year, based on the direct, marginal costs of the programme and following EEF guidance. In addition, issues around costs incurred were discussed on the visits to schools that formed part of the process evaluation; and respondents to the survey in treatment schools were asked about any additional costs incurred in implementing the programme.
[image:18.595.65.530.304.559.2]Timeline
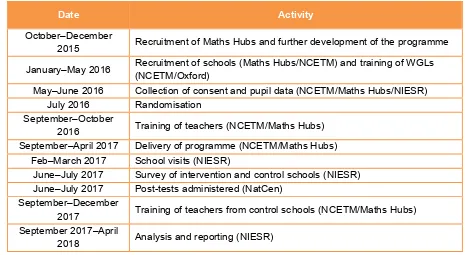
Table 2: Timeline
Date Activity
October–December
2015 Recruitment of Maths Hubs and further development of the programme January–May 2016 Recruitment of schools (Maths Hubs/NCETM) and training of WGLs (NCETM/Oxford)
May–June 2016 Collection of consent and pupil data (NCETM/Maths Hubs/NIESR) July 2016 Randomisation
September–October
2016 Training of teachers (NCETM/Maths Hubs) September–April 2017 Delivery of programme (NCETM/Maths Hubs)
Feb–March 2017 School visits (NIESR)
June–July 2017 Survey of intervention and control schools (NIESR) June–July 2017 Post-tests administered (NatCen)
September–December
2017 Training of teachers from control schools (NCETM/Maths Hubs) September 2017–April
Impact evaluation
Participant flow including losses and exclusions
Eight Maths Hubs were identified to take part in the trial by the NCETM. The aim was to recruit 20 schools per hub so that in total 160 schools would be participating in the trial. The opportunity for schools to participate in the trial was widely advertised by the NCETM and the Maths Hubs (see the earlier section explaining the recruitment strategy), with interested schools initially asked to complete an expression of interest (EOI) form. It is not possible to identify precisely how many schools were approached (as it is not possible to say with accuracy how many schools may have seen the trial advertised). However, a total of 335 EOI forms were returned, based on records provided by the Maths Hubs.6
Within each Maths Hub, around 20 schools were then invited to participate such that in total 175 schools were approached.7 This followed agreement with the EEF for an allowance to over-recruit by up to 15%. In order to select the schools that would participate, Hubs reviewed the completed EOI forms (which included a space for schools to explain why they wanted to participate), followed up by conversations with schools in order to ascertain which schools had fully understood the requirements of participating in the evaluation and were the most committed to the trial.
These 175 schools were asked to sign the MOU, distribute opt-out consent letters, and return the completed data collection form. The majority of the selected schools did so such that a total of 169 schools were eligible for the trial at the point of randomisation.8
After excluding those pupils who opted-out of participating in the trial (78 pupils), across the 169 participating schools, a total of 7,419 pupils were participating at the point of randomisation.
Of these 169 schools, 84 were allocated to receive the intervention in the school year 2016/2017 (comprising 3,793 pupils), while the remaining 85 schools were allocated to the control group, receiving the intervention in the school year 2017/2018 (comprising 3,626 pupils).
One hundred and sixty of the 169 participating schools took part in the post-test in summer 2017 (80 treatment and 80 control schools). The five control schools that withdrew from the testing (and thus future receipt of the programme) all cited staff changes as a key reason for their withdrawal. In addition, two of these schools also mentioned that they were planning to introduce an alternative maths programme in the following school year instead. The four treatment schools that did not participate in the testing had all withdrawn from delivering the programme (citing varying reasons including ICT issues, staff changes, and issues with the actual programme itself). While often the schools had indicated they would still be willing to participate in the testing, despite withdrawing from the programme, in practice this did not prove to be the case for these four schools.
In addition, three further treatment schools, although they took part in the post-test, stopped delivering the programme. In addition, in one school the programme was delivered in one class, but not within a second mixed year group class. Following the intention-to-treat principle these schools (and class) are
6 This comprised: London and South East (34 schools); Salop and Herefordshire (36 schools); Central (48 schools); GLOW (42 schools); NW3 (44 schools); Archimedes (45 schools); Kent and Medway (50 schools); and Sussex (36 schools).
7 The numbers selected by Hub were: London and South East (20 schools); Salop and Herefordshire (22 schools); Central (23 schools); GLOW (22 schools); NW3 (23 schools); Archimedes (23 schools); Kent and Medway (22 schools); and Sussex (20 schools).
included in the primary analysis, but we also present the results of sensitivity analysis excluding these three schools, plus the class where the pupils did not receive the programme.
As noted above, 7,419 pupils were participating at the point of randomisation. The four treatment schools that did not participate in testing accounted for 198 pupils, and the five control schools for 175 pupils. A further 357 pupils in treatment schools did not participate in the post-test. The most common reason, applying to 221 pupils, was having moved school. In addition, 62 pupils did not take part in the test due to having SEN or a disability, 56 pupils were absent on the day of the test, 11 pupils were long-term absent (sometimes due to illness), and a further seven were not eligible to take the test for other reasons. Among control schools, 209 pupils did not participate in the post-test as they had moved school, 57 were absent on the day of the test, 35 had SEN or a disability, nine were long-term ill or absent, and 22 were not eligible for other reasons. In addition, consent was withdrawn for four pupils in control schools after the point of randomisation.
As the initial data collection to obtain details of the participating schools and pupils took place in the summer term before the intervention was to be delivered, some pupils moved school before joining Year 2. In light of this, a second round of data collection was undertaken in Autumn 2016, once pupils were in Year 2, with the aim of identifying any new pupils who had joined the schools since the time of the original data collection, and any who had left. Details of any new pupils who had joined the schools were collected at this point (providing that consent was obtained). In practice, around half of schools responded to this second round of data collection. Our primary analysis focuses, therefore, on those pupils in the study at the point of randomisation. However, as discussed later in this report, we do also conduct some sensitivity analysis by altering the analysis sample to additionally include those pupils identified in the second data collection and removing those who had left the school by this point.9 Almost all of those pupils who undertook the post-test could be matched to the NPD (with the exception of one pupil). Our primary analysis does not rely on NPD linkage at pupil-level (as we are using a school-level measure of prior attainment), and so the pupil for whom it is not possible to match to NPD at pupil-level can still be included within our primary analysis. Thus our final sample for analysis comprises 3,238 pupils in 80 treatment schools, and 3,115 pupils in 80 control schools.
As reported in Table 3, at the point of preparing the trial protocol, the MDES stood at 0.11 (and at 0.14 for analysis of the subgroup of pupils eligible for FSM). At randomisation, the MDES stood at 0.12 (and at 0.16 for the FSM subgroup). Based on the final sample available for analysis, the MDES stands at 0.14 (and at 0.20 for the FSM subgroup).
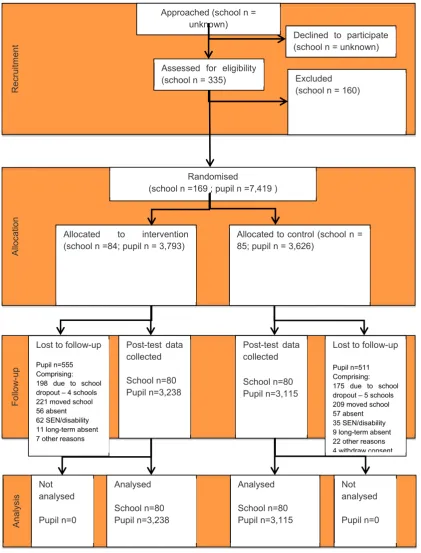
Figure 2: Participant flow diagram10
10As noted above, for some, but not all schools we were able to obtain updated information on Year 2 classes in the Autumn term. In the analysis section we check the robustness of our results based on this additional information (which results in an additional 91 pupils being included in the analysis); this makes no substantive difference to the findings. Recruitment Analys is Follow-up Alloc ation
Assessed for eligibility (school n = 335)
Randomised
(school n =169 ; pupil n =7,419 )
Excluded (school n = 160)
Allocated to intervention (school n =84; pupil n = 3,793)
Allocated to control (school n = 85; pupil n = 3,626)
Post-test data collected
School n=80 Pupil n=3,238
Post-test data collected School n=80 Pupil n=3,115 Analysed School n=80 Pupil n=3,238
Approached (school n = unknown)
Declined to participate (school n = unknown)
Lost to follow-up
Pupil n=555 Comprising: 198 due to school dropout – 4 schools 221 moved school 56 absent 62 SEN/disability 11 long-term absent 7 other reasons
Lost to follow-up
Pupil n=511 Comprising: 175 due to school dropout – 5 schools 209 moved school 57 absent 35 SEN/disability 9 long-term absent 22 other reasons 4 withdraw consent
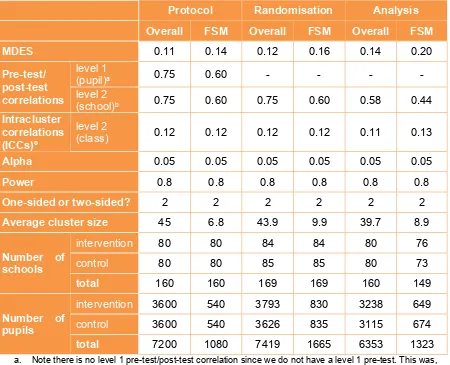
Table 3: Minimum detectable effect size at different stages
Protocol Randomisation Analysis
Overall FSM Overall FSM Overall FSM
MDES 0.11 0.14 0.12 0.16 0.14 0.20
Pre-test/ post-test correlations
level 1
(pupil)a 0.75 0.60 - - - -
level 2
(school)b 0.75 0.60 0.75 0.60 0.58 0.44
Intracluster correlations (ICCs)c
level 2
(class) 0.12 0.12 0.12 0.12 0.11 0.13
Alpha 0.05 0.05 0.05 0.05 0.05 0.05
Power 0.8 0.8 0.8 0.8 0.8 0.8
One-sided or two-sided? 2 2 2 2 2 2
Average cluster size 45 6.8 43.9 9.9 39.7 8.9
Number of schools
intervention 80 80 84 84 80 76
control 80 80 85 85 80 73
total 160 160 169 169 160 149
Number of pupils
intervention 3600 540 3793 830 3238 649
control 3600 540 3626 835 3115 674
total 7200 1080 7419 1665 6353 1323
a. Note there is no level 1 pre-test/post-test correlation since we do not have a level 1 pre-test. This was, however, included in the calculations at randomisation.
b. The pre-post correlations under the ‘Analysis’ heading are the square root of the R-squareds from regressions of the outcome variable on the school-level baseline measure, also including blocking variables. These, rather than the raw correlations, are used in the power calculations.
c. We use an assumed ICC of 0.12 based on Worth et al. (2015) for MDES estimation at protocol and randomisation, but the actual ICC at analysis stage.
Attrition
As 7,419 pupils were in the sample at the point of randomisation, and 6,353 of these pupils remained in the sample at the point of analysis, this represents an attrition rate of 14%. The reasons for attrition are discussed above in the section on participant flow; the two key contributors were school dropout and pupils who moved school between the point of randomisation and delivery of the post-test.
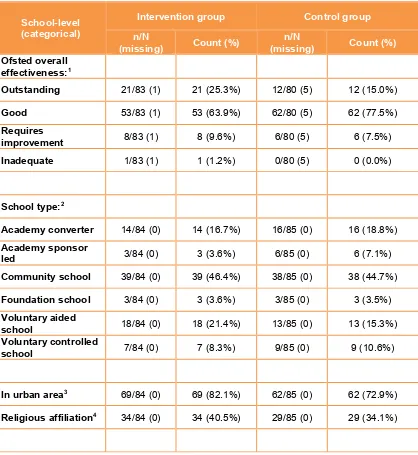
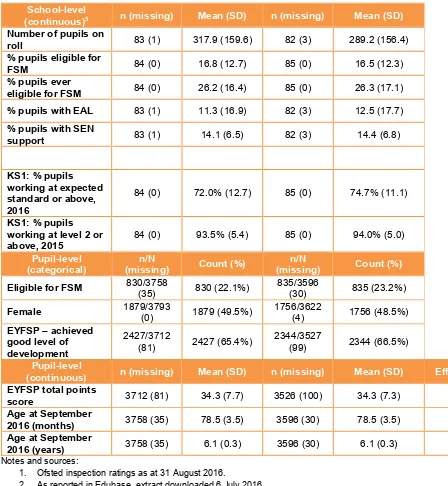
Pupil and school characteristics
Table 4 presents school- and pupil-level characteristics at the point of randomisation for both the intervention and control group. Overall, this indicates that the sample was balanced at baseline, at least in terms of the characteristics we are able to observe.
pupils (that is, the proportions eligible or ever eligible for free school meals, for whom English is an additional language, or those with special educational needs).
School-level KS1 attainment in maths in 2015 was one of the blocking variables used in randomisation and therefore we would anticipate that the sample would be balanced in this respect. Although mean school-level KS1 attainment in 2016 appears slightly higher in the control arm (74.7% of pupils working at the expected standard or above) compared with the treatment group (72%), this difference in means is not statistically significant (the effect size here is 0.23).
[image:23.595.77.495.300.755.2]Although there is no individual-level pre-test in the primary analysis, we can use the EYFSP scores to gain an insight into the degree to which attainment is balanced at baseline. There was no difference in the mean EYFSP score between pupils in the treatment and control groups, and the distribution of scores was similar in the two groups, as shown by the histograms in Appendix E. The balance on this measure is also demonstrated by the effect size of 0.00. There were no statistically significant differences by treatment arm on any of the other pupil characteristics considered (gender, age, and proportion eligible for free school meals).
Table 4: Baseline comparison
School-level (categorical)
Intervention group Control group
n/N
(missing) Count (%) (missing) n/N Count (%)
Ofsted overall effectiveness:1
Outstanding 21/83 (1) 21 (25.3%) 12/80 (5) 12 (15.0%)
Good 53/83 (1) 53 (63.9%) 62/80 (5) 62 (77.5%)
Requires
improvement 8/83 (1) 8 (9.6%) 6/80 (5) 6 (7.5%)
Inadequate 1/83 (1) 1 (1.2%) 0/80 (5) 0 (0.0%)
School type:2
Academy converter 14/84 (0) 14 (16.7%) 16/85 (0) 16 (18.8%)
Academy sponsor
led 3/84 (0) 3 (3.6%) 6/85 (0) 6 (7.1%)
Community school 39/84 (0) 39 (46.4%) 38/85 (0) 38 (44.7%)
Foundation school 3/84 (0) 3 (3.6%) 3/85 (0) 3 (3.5%)
Voluntary aided
school 18/84 (0) 18 (21.4%) 13/85 (0) 13 (15.3%)
Voluntary controlled
school 7/84 (0) 7 (8.3%) 9/85 (0) 9 (10.6%)
In urban area3 69/84 (0) 69 (82.1%) 62/85 (0) 62 (72.9%)
School-level
(continuous)5 n (missing) Mean (SD) n (missing) Mean (SD)
Number of pupils on
roll 83 (1) 317.9 (159.6) 82 (3) 289.2 (156.4)
% pupils eligible for
FSM 84 (0) 16.8 (12.7) 85 (0) 16.5 (12.3)
% pupils ever
eligible for FSM 84 (0) 26.2 (16.4) 85 (0) 26.3 (17.1)
% pupils with EAL 83 (1) 11.3 (16.9) 82 (3) 12.5 (17.7)
% pupils with SEN
support 83 (1) 14.1 (6.5) 82 (3) 14.4 (6.8)
KS1: % pupils working at expected standard or above, 2016
84 (0) 72.0% (12.7) 85 (0) 74.7% (11.1)
KS1: % pupils working at level 2 or
above, 2015 84 (0) 93.5% (5.4) 85 (0) 94.0% (5.0)
Pupil-level
(categorical) (missing) n/N Count (%) (missing) n/N Count (%)
Eligible for FSM 830/3758 (35) 830 (22.1%) 835/3596 (30) 835 (23.2%)
Female 1879/3793 (0) 1879 (49.5%) 1756/3622 (4) 1756 (48.5%)
EYFSP – achieved good level of development
2427/3712
(81) 2427 (65.4%) 2344/3527 (99) 2344 (66.5%) Pupil-level
(continuous) n (missing) Mean (SD) n (missing) Mean (SD) Effect Size
EYFSP total points
score 3712 (81) 34.3 (7.7) 3526 (100) 34.3 (7.3) 0.00
Age at September
2016 (months) 3758 (35) 78.5 (3.5) 3596 (30) 78.5 (3.5)
Age at September
2016 (years) 3758 (35) 6.1 (0.3) 3596 (30) 6.1 (0.3)
Notes and sources:
1. Ofsted inspection ratings as at 31 August 2016.
2. As reported in Edubase, extract downloaded 6 July 2016
3. As reported in Edubase, schools located in ‘Urban city and town’ or ‘Urban major conurbation’. 4. As reported in Edubase, includes Church of England and Roman Catholic schools.
5. School-level characteristics (FSM, SEN, EAL, number of pupils), as reported in DfE Performance Tables, 2015.
[image:24.595.71.519.70.556.2]All other characteristics are as reported in the NPD extracts supplied for this project.
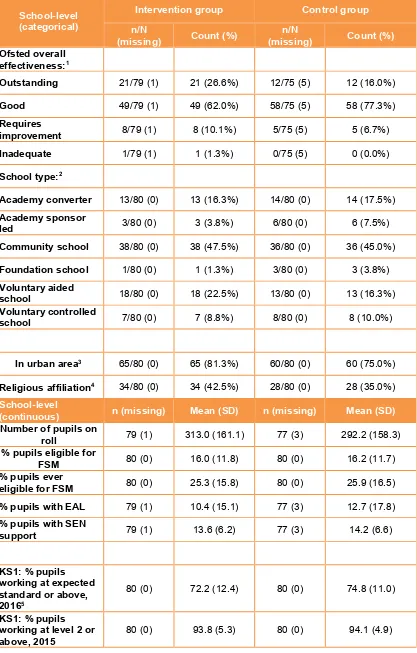
Table 5 presents pupil- and school-level characteristics for the analysis sample. We may be concerned that attrition may have led to an imbalance in the sample. However, the sample remained balanced by treatment arm in terms of all the observed characteristics as reported in the table below.
Table 5: Comparison—analysis sample
School-level (categorical)
Intervention group Control group
n/N
(missing) Count (%) (missing) n/N Count (%)
Ofsted overall effectiveness:1
Outstanding 21/79 (1) 21 (26.6%) 12/75 (5) 12 (16.0%)
Good 49/79 (1) 49 (62.0%) 58/75 (5) 58 (77.3%)
Requires
improvement 8/79 (1) 8 (10.1%) 5/75 (5) 5 (6.7%)
Inadequate 1/79 (1) 1 (1.3%) 0/75 (5) 0 (0.0%)
School type:2
Academy converter 13/80 (0) 13 (16.3%) 14/80 (0) 14 (17.5%)
Academy sponsor
led 3/80 (0) 3 (3.8%) 6/80 (0) 6 (7.5%)
Community school 38/80 (0) 38 (47.5%) 36/80 (0) 36 (45.0%)
Foundation school 1/80 (0) 1 (1.3%) 3/80 (0) 3 (3.8%)
Voluntary aided
school 18/80 (0) 18 (22.5%) 13/80 (0) 13 (16.3%)
Voluntary controlled
school 7/80 (0) 7 (8.8%) 8/80 (0) 8 (10.0%)
In urban area3 65/80 (0) 65 (81.3%) 60/80 (0) 60 (75.0%)
Religious affiliation4 34/80 (0) 34 (42.5%) 28/80 (0) 28 (35.0%)
School-level
(continuous) n (missing) Mean (SD) n (missing) Mean (SD)
Number of pupils on
roll 79 (1) 313.0 (161.1) 77 (3) 292.2 (158.3)
% pupils eligible for
FSM 80 (0) 16.0 (11.8) 80 (0) 16.2 (11.7)
% pupils ever
eligible for FSM 80 (0) 25.3 (15.8) 80 (0) 25.9 (16.5)
% pupils with EAL 79 (1) 10.4 (15.1) 77 (3) 12.7 (17.8)
% pupils with SEN
support 79 (1) 13.6 (6.2) 77 (3) 14.2 (6.6)
KS1: % pupils working at expected standard or above, 20165
80 (0) 72.2 (12.4) 80 (0) 74.8 (11.0)
KS1: % pupils working at level 2 or above, 2015
Pupil-level
(categorical) (missing) n/N Count (%) (missing) n/N Count (%)
Eligible for FSM 649/3237(0) 649 (20.1%) 674/3115 (0) 674 (21.6%)
Female 1647/3237(0) 1647 (50.9%) 1535/3115 (0) 1535 (49.3%)
EYFSP— achieved good level of
development
2170/3201
(36) 2170 (67.8%) 2092/3064 (51) 2092 (68.3%) Pupil-level
(continuous) (missing) n Mean (SD) (missing) n Mean (SD) Effect size
EYFSP total
points score 3201 (36) 34.8 (7.5) 3064 (51) 34.7 (7.1) 0.02 Age at September
2016 (months) 3237 (0) 78.5 (3.5) 3115 (0) 78.5 (3.5) 0.00
Age at September
2016 (years) 3237 (0) 6.1 (0.3) 3115 (0) 6.1 (0.3) 0.00
Notes and sources:
1. Ofsted inspection ratings as at 31 August 2016.
2. As reported in Edubase, extract downloaded 6 July 2016.
3. As reported in Edubase, schools located in ‘Urban city and town’ or ‘Urban major conurbation’. 4. As reported in Edubase, includes Church of England and Roman Catholic schools.
5. Equivalent to an effect size of 0.22.
6. School-level characteristics (FSM, SEN, EAL, number of pupils), as reported in DfE Performance Tables, 2015.
All other characteristics are as reported in the NPD extracts supplied for this project.
We also explored the characteristics of pupils who drop out from the analysis sample (focusing on those in non-dropout schools only and excluding those for whom consent was withdrawn), regressing an indicator of whether or not pupils dropped out on treatment status, pupil characteristics (gender, age, eligibility for FSM, and EYFSP scores) and interactions between treatment status and these pupil characteristics. This showed that pupils who were eligible for free school meals were more likely to drop out than those who were not eligible, as were those with lower prior attainment as measured by their total EYFSP score. This could partly reflect teachers’ perceptions of whether pupils were able to cope with the test situation. There were however no statistically significant associations with treatment status. While the above does not suggest differences by treatment arm, this may have consequences for our ability to generalise the results for the population of pupils as a whole.
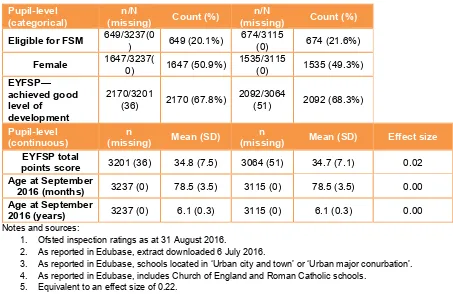
[image:26.595.70.523.69.363.2]Outcomes and analysis
Table 6 summarises the results of the primary analysis. Comparison of the mean scores indicates a slightly higher mean score among members of the treatment group (103.6) compared with the control group (102.2). Histograms show the distribution of scores to be similar across treatment and control groups (Figure 3).
Table 6: Primary analysis
Raw means Effect size
Intervention group Control group
Outcome (missing) n Mean (95% CI) (missing) n (95% CI) Mean
n in model (intervention;
control)
Hedges g
(95% CI) value
p-PTM – standard age
score 3238
103.6 (103.0,
104.1) 3115
102.2 (101.6,
102.7) 6353 (3238; 3115)
0.08 (-0.03,
0.18) 0.156
Table 7: Effect size estimation
Outcome Unadjusted differences in means
Adjusted differences
in means
Intervention group Control group
Pooled variance Population variance (if available) n (missing) Variance of outcome n (missing) Variance of outcome PTM – standard age score
[image:27.595.78.475.361.647.2]1.414 1.181 3238 238.97 3115 246.77 242.80 -
Figure 3: Histograms of PTM standard age score, by trial arm
Subgroup analysis—pupils eligible for FSM
As specified in the trial protocol, we also estimate the model solely for those pupils eligible for free school meals. The results are presented in Table 8 below, with the components underlying the estimation of the effect size presented in Table 9. The estimated effect size is comparable to that for all pupils. Again, there is no significant impact of the intervention on our primary outcome measure for this subgroup of pupils.
0 .0 1 .0 2 .0 3 Den sit y
60 80 100 120 140
Standard Age Score Treatment 0 .0 1 .0 2 .0 3 Den sit y
60 80 100 120 140
Table 8: Impact on primary outcome, pupils eligible for FSM
Raw means Effect size
Intervention group Control group
Outcome (missing) n Mean (95% CI) (missing) n (95% CI) Mean
n in model (intervention;
control)
Hedges g
(95% CI) value
p-PTM – standard age
score 649 96.4 (95.3, 97.6) 674
95.7 (94.6,
96.8) 1323 (649; 674)
0.09 (-0.07,
0.25) 0.288
Table 9: Effect size estimation, pupils eligible for FSM
Outcome Unadjusted differences in means
Adjusted differences
in means
Intervention group Control group
Pooled variance Population variance (if available) n (missing) Variance of outcome n (missing) Variance of outcome PTM – standard age score
0.74 1.31 649 221.29 674 213.91 217.53 -
Robustness checks
We also undertook a number of robustness checks of our analysis.
Firstly, we tested sensitivity to altering our pre-test measure. Instead of using a lagged school-level measure of KS1 attainment, we replaced this with the individual EYFSP scores obtained by the children participating in the trial. We use the total EYFSP score obtained by the pupils. As noted earlier in the report, although this measure has the advantage of being available at pupil level, it lacks granularity (Dockrell et al., 2017). Nevertheless, it is still of interest to consider, as a robustness check, how the use of this measure affects (or does not affect) the results. The results are reported in Table 10 below; this makes no substantive difference to the results—we still observe a positive but non-significant impact of the programme on the primary outcome. Note this model is estimated on a slightly smaller sample as information on EYFSP scores was not available for all pupils. We also repeated these models using just the maths component of the total EYFSP score, but again the results are effectively unchanged. We also explored including both the total EYFSP score and the lagged school-level measure of KS1 attainment, with these measures entered simultaneously as separate variables in the model (second row of Table 10). The final row of Table 10 reports results after imputing missing values for the total EYFSP score. Missing values are multiply-imputed based on gender, age in months at the start of Year 2, whether ever eligible for FSM, school level KS1 attainment in 2016, treatment arm, and blocking dummies. This was implemented using Stata’s mi command, with ten imputations.
Table 10: Impact on primary outcome, EYFSP scores used as pre-test
Raw means Effect size
Intervention group Control group
Outcome (missing) n Mean (95% CI) (missing) n (95% CI) Mean
n in model (intervention;
control)
Hedges g
(95% CI) value
p-PTM – standard age score (EYFSP score used as pre-test)
3201 (37) 103.6 (103.1, 104.1) 3064 (51)
102.2 (101.7,
102.8) 6265 (3201; 3064)
0.08 (-0.03,
0.19) 0.139
PTM – standard age score (including EYFSP score and lagged KS1 attainment)
3201 (37) 103.6 (103.1, 104.1) 3064 (51) (101.7, 102.2
102.8) 6265 (3201; 3064)
0.09 (-0.02,
0.20) 0.095
PTM – standard age score (including EYFSP score and lagged KS1 attainment, with MI)
3237 (1) 103.6 (103.0, 104.1) 3115 (101.6, 102.2
102.7) 6352 (3237; 3115)
0.09 (-0.01,
0.20) 0.089
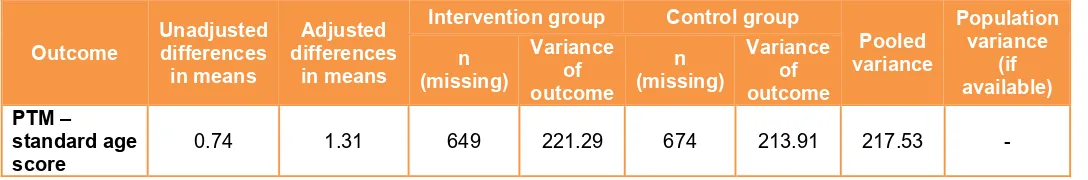
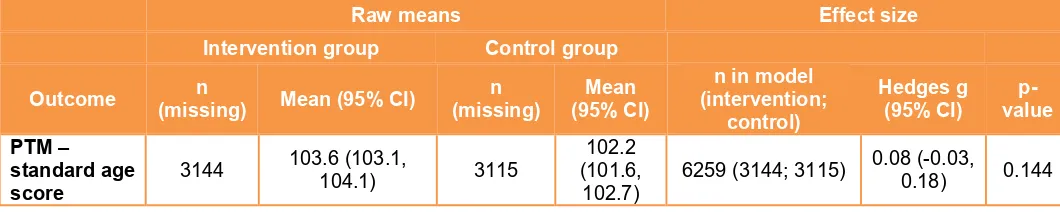
Secondly, while our primary analysis is estimated on an intention-to-treat basis, we also checked the robustness of our results to removing those schools that we are aware stopped delivering the programme. We also exclude some Year 2 pupils within a mixed year class in one participating school that did not receive the programme. Again, the results are effectively unchanged (Table 11).
Table 11: Impact on primary outcome, excluding schools that did not deliver programme
Raw means Effect size
Intervention group Control group
Outcome (missing) n Mean (95% CI) (missing) n (95% CI) Mean (intervention; n in model control)
Hedges g
(95% CI) value
p-PTM – standard age score
3144 103.6 (103.1, 104.1) 3115 (101.6, 102.2 102.7)
6259 (3144; 3115) 0.08 (-0.03, 0.18) 0.144
[image:29.595.32.562.524.630.2]Table 12: Impact on primary outcome, including pupils identified at second data collection
Raw means Effect size
Intervention group Control group
Outcome (missing) n Mean (95% CI) (missing) n (95% CI) Mean
n in model (intervention;
control)
Hedges g
(95% CI) value
p-PTM – standard age
score 3282
103.5 (103.0,
104.1) 3162
102.1 (101.5,
102.6) 6444 (3282; 3162)
0.08 (-0.02,
0.19) 0.131
Finally, we check the sensitivity of our results to using the total raw score (which ranged from a minimum score of zero to a maximum of 43) as the outcome measure instead of the standard age score (Table 13). Histograms showing the distribution of the raw score are presented in Appendix G. It should be noted that some moderate degree of negative skew is apparent here, although this is not evident in the standardised scores which we use in the primary analysis. The negative skew may suggest that the assessment was more sensitive to differences at the lower end of the distribution and less sensitive to differences at the higher end of the distribution. However, when using the raw score, the results are effectively unchanged. Note that the results presented in Table 13 do not control for pupil age, however, including this does not have any substantive impact on the results.
Table 13: Impact measured using raw score
Raw means Effect size
Intervention group Control group
Outcome (missing) n Mean (95% CI) (missing) n (95% CI) Mean
n in model (intervention;
control)
Hedges g
(95% CI)