i
Role of cephalopods in the structure and
functioning of marine ecosystems.
By
Thibaut de la Chesnais
Agronomical engineer
Submitted in fulfilment of the requirements for the Doctor of Philosophy
University of Tasmania May, 2019
1 NOTE: If the degree contains coursework or your assessment includes an exhibition / performance / recital then this should read “Submitted in partial fulfilment of the requirements for the <Degree name>
ii
Declaration of Originality
This thesis contains no material which has been accepted for a degree or diploma by the
University or any other institution, except by way of background information and duly
acknowledged in the thesis, and to the best of the candidates knowledge and belief no
material previously published or written by another person except where due
acknowledgement is made in the text of the thesis, nor does the thesis contain any material
that infringes copyright.
Thibaut de la Chesnais
Date 3
dDecember 2018
Authority of Access
The publishers of the papers comprising Chapter 2 hold the copyright for that content, and
access to the material should be sought from the journal. The remaining non published
content of the thesis may be made available for loan and limited copying and communication
in accordance with the Copyright Act 1968.
Thibaut de la Chesnais
iii
Statement of Co-Authorship
One chapter is under revision in a peer-reviewed journal:
Thibaut de la Chesnais , Elizabeth A. Fulton, Sean R. Tracey, Gretta T. Pecl (in review) The ecological role of cephalopods and their representation in ecosystem models.
The following people contributed to the publication of the work undertaken as part of this thesis:
Thibaut de la Chesnais, University of Tasmania = Candidate
Gretta T. Pecl, Supervisor, University of Tasmania = Author 1
Elizabeth A. Fulton, Supervisor, Commonwealth Scientific and Industrial Research Organization = Author 2
Sean Tracey, Supervisor, University of Tasmania = Author 3
Author details and their roles
Paper 1
Located in chapter 2
Candidate was the primary author and with author 1, 2 and 3 contributed to the conception and design of the research project and drafted significant parts of the paper
Candidate contributed approximately 75% to the planning, execution and preparation of the work for the paper
We, the undersigned agree with the above stated ‘proportion of work undertaken’ for the above published peer-reviewed manuscripts contribution to this thesis:
Signed
Gretta T. Pecl Supervisor
Institute of Marine and Antarctic Science
University of Tasmania Caleb Gardner
Head of school
iv
Abstract
An increase in cephalopod abundance worldwide has been observed over recent decades, possibly a function of cephalopods’ response to the effects of climate change and the reduction in predation by human exploitation on predators of marine systems. Additionally, there has been a renewal of fisheries interest due to the development of markets for cephalopod products and the reduction of finfish stocks. Assessing their role in food webs is thus essential for understanding and anticipating upcoming changes in ecosystem functioning and services. From this perspective, ecosystem models can be used as powerful tools to understand the impact of a group of species on the system, and to anticipate future developments and foresee the future dynamics. However, these models generally fail to represent cephalopods ecology adequately. This thesis thus aimed to tackle the issue of representing cephalopods ecology in ecosystem models and to use these new methods to assess their role in ecosystems and the potential changing of this role under climate change:
Identifying the limits of ecosystem models when it comes to representing cephalopods
ecology;
Tackling the issue by improving the existing features of the Atlantis modelling framework
and developing additional tools to represent the particularity of cephalopods ecology; Testing the sensitivity of the resulting model to various ecological processes and cephalopod
life-history;
Subjecting the model to an environmental change scenario and analysing the implications for
cephalopods and other groups.
v
vi
Acknowledgements
vii
Table of contents
Declarations………ii
Abstract……….………iv
Acknowledgements………..…vi
Chapter 1 General Introduction ... 1
Cephalopods alien ecology and their importance in the food webs ... 2
Insights and lessons from ecosystem models ... 4
Potential role of cephalopod species as drivers of ecosystems’ functioning and services
... 7
Interests of South East Australian region and local ecosystem model ... 8
Chapter 2 The ecological role of cephalopods and their representation in
ecosystem models. ... 10
Abstract ... 10
Introduction ... 11
Methods ... 16
Results ... 22
Adequacy of ecosystem models to assess the ecological role of cephalopods ... 22
Ecosystem models and cephalopods’ impact on the food web ... 23
Discussion ... 26
Chapter 3 Understanding the ecological role of cephalopods in the
structure and function of ecosystems: a case a study using South East
Australia. ... 35
Abstract ... 36
Introduction ... 38
Material & methods ... 41
Preliminary ecosystem model of South East Australia ... 42
New food web structure ... 43
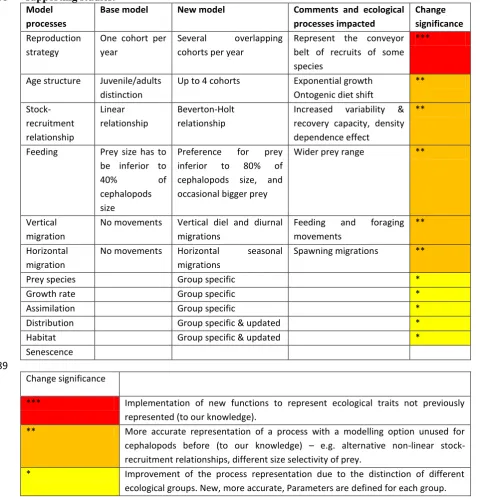
Focus on cephalopods ecology and new processes represented ... 50
Processes impacts and model sensitivity to cephalopods uncertainty ... 52
Results ... 56
Analysing results from new ecological representations ... 56
Effects of the new population dynamics on cephalopod groups ... 56
viii
Sensitivity tests ... 59
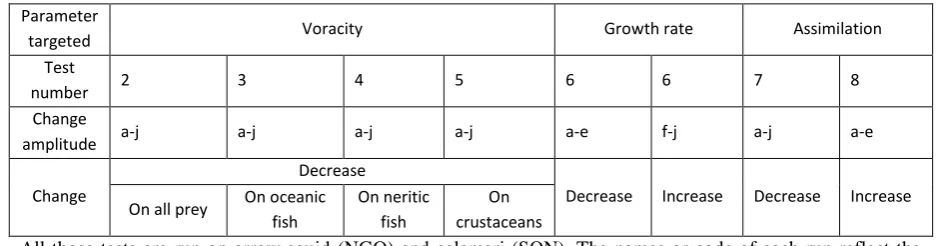
General assessment of the impacts of changing squid parameters ... 59
Biomass trends of arrow squid under the different tests ... 62
Effect of arrow squid parameter changes on the ecosystem ... 64
Biomass trends of calamari under the different tests. ... 67
Effect of calamari parameter changes on the ecosystem... 68
Discussion ... 71
Processes driving cephalopods dynamics ... 72
Impact of local squid species on the South East Australian model ... 74
Model limitations ... 77
Chapter 4 Effects of climate change on ecosystem functioning and on the
role of cephalopods... 81
Introduction ... 82
Material & Methods ... 83
Atlantis modelling framework ... 84
The South East Australian Atlantis model ... 84
Representing the effect of climate change on species physiology ... 85
Climate change in the oceanographic model ... 86
Results ... 88
Discussion ... 94
Chapter 5 General discussion ... 102
Conclusions on cephalopod in models and role in ecosystems ... 102
Limitations ... 104
Future of cephalopods in ecosystems and in research ... 107
Conclusion ... 111
References ... 112
Appendixes... 137
ix
List of figures
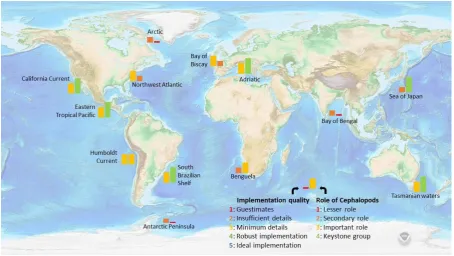
Figure 2-1. Role of cephalopods in ecosystem models around the world. ... 25
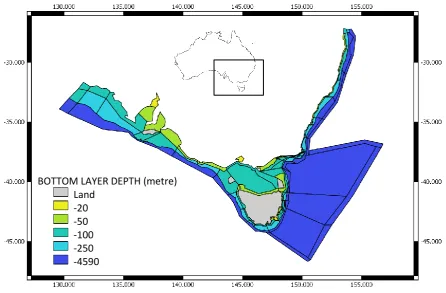
Figure 3-1. SEAP model area and spatial divisions. ... 43
Figure 3-2a. Biomass trend of squids. ... 57
Figure 3-2b. Biomass trends of arrow squid and large zooplankton over the last ten years of our base run ... 57
Figure 3-3. Changes of diet across the different stages of arrow squid.... 59
Figure 3-4. Exponential growth of arrow squid. ... 59
Figure 3-5. PCA results including calamari and arrow squid sensitivity tests. ... 61
Figure 3-6a. Effect on arrow squid biomass of the changes of predation on various prey groups (tests 2,3,4 & 5). ... 63
Figure 3-6b. Effect of the change in assimilation efficiency and growth capacity on arrow squid (tests 6, 7 & 8). ... 63
Figure 3-7. Plot of the Principal Component Analysis on all the runs with a modification of a parameter on the arrow squid (NGO group). ... 65
Figure 3-8. Impact of arrow squid on large functional groups of the system. ... 66
Figure 3-9a.Effect on calamari biomass of the changes of predation on various prey groups (tests 2, 3, 4 & 5). ... 67
Figure 3-9b. Effect of the change of assimilation efficiency and growth capacity on calamari (tests 6, 7 & 8). ... 67
Figure 3-10. Plot of the Principal Component Analysis on all the runs with a modification of a parameter on the calamari (SQN group). ... 69
Figure 3-11. Impact of calamari on large functional groups of the system. ... 70
x
Figure 4-2: Average anomaly for sea surface temperature (SST) over the model area following
the IPCC scenario 8.5. ... 88
Figure 4-3: Relative biomass change of squid groups between the base scenario and the climate change scenario. ... 90
Figure 4-4: Biomass trends of arrow squid in its main predators and prey. ... 91
Figure 4-5: Biomass trends of the ommastrephid group and its main predators and prey. ... 91
xi
List of tables
Table 2-1. parameters considered in scoring the quality of data of the model. for each of those
parameters, I looked into the source of information used to build the model and assigned a
corresponding confidence score. ... Error! Bookmark not defined. Table 2-2. Quality ranking framework to evaluate the adequacy of ecosystem models to assess
the role of cephalopods. ... 19
Table 2-3. Assessment of the relative impact of cephalopods on the ecosystem considered witin each model. ... 21
Table 2-4. Adequacy of the implementation of cephalopods in ecosystem models. ... 22
Table 2-5. Evaluation of the implementation and role of cephalopods in ecosystem models.. ... 24
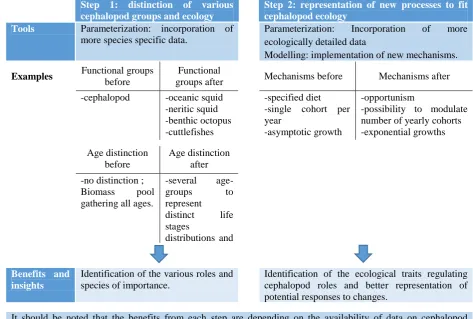
Table 2-6. Key steps and benefits from improving cephalopod representation in ecosystem models. ... 34
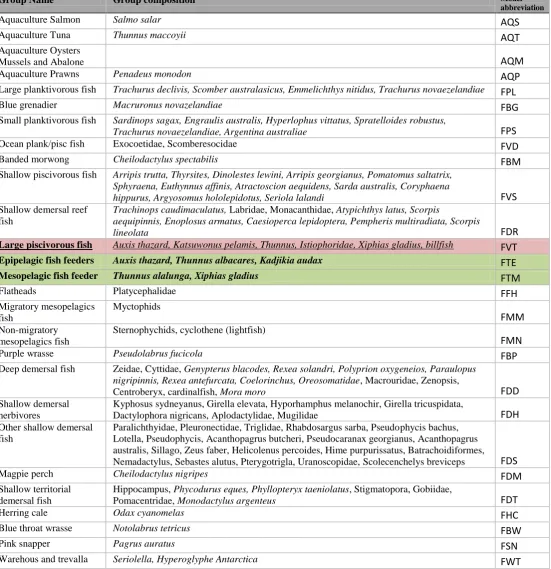
Table 3-1. Functional groups and species included in the model. ... 44
Table 3-2. Features of the various cephalopod groups in our model. Fisheries catches are the catch range between 2000 & 2013 in whole South East Australia. ... 48
Table 3-3: Improvements on ecological processes of cephalopods. ... 50
Table 3-4: marking of model adequacy to assess cephalopods (chapter II). ... 52
Table 3-5a. Various sensitivity tests ... 55
Table 3-5b. Method used to build tests on squid parameters ... 55
Table 4-1: Cephalopod groups of the South East Australian model and related catches/fisheries. ... 84
1
Chapter 1
General Introduction
12
Stories and legends of the Kraken, an ocean monster putting ships in peril, have aroused the 3
imagination for ages, occasionally reinforced by the appearance of giant squids and other elusive 4
deep-sea cephalopod species. Today, a new popular theme seems to be emerging: “the squid 5
overlord”. Although originated from fictional stories like The Call of Cthulhu of H.P. Lovercraft, its 6
resonance in popular culture is probably associated with real events, like the expansion of the jumbo 7
squid (Field et al. 2007) and their increasing abundance in catches (Doubleday et al. 2016).Their alien 8
phenotype has been a curiosity among the animal domain, with three hearts (Schipp 1987), blue blood 9
(vanBruggen 1980) and a neuronal network extending through their arms (Sander 1975). However, 10
this exceptional phenotype is more than a simple curiosity, and is associated with ecological 11
specificities, making cephalopods represent a unique component of ecosystems (Boyle & Boletzky, 12
1995). 13
14
Cephalopods have important feeding activity on a wide range of prey (Clarke, 1996; Coll et al, 2013; 15
Rodhouse & Nigmatullin, 1996; Young et al., 2013), and are prey of many predators of ecosystems 16
(Boyle & Rodhouse, 2005; Smale, 1996; Logan et al., 2013). They thus have a strong role in the 17
transfer of nutrients up the food web in many areas (Cox et al., 2002; Griffiths et al., 2010; Olson and 18
Watters, 2003; Rosas-Luis et al., 2003). Although our understanding is somewhat limited, 19
cephalopods are thought to have an important role in food webs, and their abundance is growing 20
worldwide, so improving our understanding of their role in ecosystems is becoming a major issue. 21
This is even more so as cephalopods are relatively fast to respond to the effects of climate change and 22
other environmental changes (Angilletta et al. 2002, Pecl & Jackson 2008). Moreover, cephalopod 23
fisheries are quickly increasing worldwide, with little associated stock or ecosystem impact 24
assessments (Anderson et al. 2011). The potential of these species to drive change in systems as they 25
2
need some insight on the processes regulating species impact on systems and their changes before 27
non-reversible and potentially detrimental changes occur. It is an important step towards better 28
understanding and management of marine resources at a time when human activities and systems are 29
subjected to significant changes (Bracken et al. 2007). 30
31
The goals of this project are to assess the role of cephalopods in marine ecosystems and their potential 32
influencing on the functioning of ecosystems linked to the responses of these species to environmental 33
change. In the first chapter, I identify the limits of ecosystem models regarding cephalopod ecology, 34
and assess the extent of this issue. I achieve this by building a framework to assess and compare the 35
capacity of models to represent cephalopod species and identify at the areas of improvement. The 36
second chapter is an attempt to address the issue by updating an Atlantis model of the South East 37
Australia to better represent local cephalopod ecology. I try to bring new insights on their role in the 38
system by testing the sensitivity of the model to different cephalopod species and the associated 39
ecological processes. This allows us to identify the key ecological processes regulating the impact of 40
species on the food web. The third chapter is turned towards the future, as I subject the model to 41
different climate change scenarios. This last work allows us to point at the effect of environmental 42
changes on cephalopod ecology and on ecosystem functioning. I analyse the relationship between 43
climate-driven changes in cephalopod ecology and the resulting changes in ecosystems functioning 44
and resources. 45
46
These chapters were written as distinct journal articles, and consequently there will be some overlap 47
between them as a result, particularly in the introduction sections. 48
49
Cephalopods alien ecology and their importance in the food webs
5051
Because of their voracious feeding activity, squid and other cephalopods exert a top-down control on 52
3
shift to micronekton, other cephalopods and larger fishes as they grow to maturity (Rodhouse & 54
Nigmatullin 1996; Parry 2006; Ruiz-Cooley et al. 2006). They can also act as top predators and may 55
feed on exploited fishes (Neira & Arancibia 2013; Field et al. 2007). Moreover, cephalopods can be 56
important prey of apical predators, such as large predatory fishes, seabirds and marine mammals 57
(Boyle & Rodhouse 2005; Logan et al. 2013; Smale 1996). Their swimming capability and use of 58
currents allows many species to migrate between distinct habitats (O’Dor 2002) while their dynamic 59
camouflage allows them to be efficient hunters (Adamo et al. 2006; Barbosa et al. 2008; Hanlon 2007; 60
Staudinger et al. 2011). All these factors give cephalopods an important role in energy and nutrient 61
transfer in food webs. They are often a key link between micronekton and many top predators (Cox et 62
al. 2002; Field et al. 2013; Griffiths et al. 2010; Olson & Watters 2003). In some systems, 63
cephalopods could play a keystone role, with the potential to significantly increase the speed of 64
nutrient transfer and to affect a large range of species in the ecosystem (Coll et al. 2013; Rocha et al. 65
2001; Smale 1996; Young et al. 2013). 66
67
However, despite occupying similar trophic levels as piscivorous fishes, cephalopod physiology sets 68
them apart and makes them a unique component of the ecosystems they inhabit (Boyle & Boletzky 69
1996; O'Dor & Webber 1986). They have a short lifespan of less than one or two years and often die 70
after spawning, although many species will spawn multiple times within one season (Van Heukelem 71
1976; Forsythe et al. 1994; Anderson & Rodhouse 2001; Pecl 2001; Rocha et al. 2001; Arkhipkin 72
2004). Cephalopods are also distinct from other species who share similar trophic levels (largely 73
teleosts) as they have a fast growth rate and metabolism that is supported by a voracious behaviour 74
(Rodhouse & Nigmatullin 1996; Rodhouse 2013; Semmens et al. 2004) and a high food conversion 75
efficiency (O’Dor & Wells 1987; Lee 1995). Cephalopods have an exponential growth curve and 76
reach maximum size just shortly before senescence (Moltschaniwskyj 2004). These traits provide 77
cephalopods with a potentially very important productivity (Nigmatullin, 2004; O’Dor & Wells, 78
1987), which has been observed to cause occasional high peaks of cephalopod biomass (Neira & 79
Arancibia, 2013; Rodhouse et al. 1998). 80
4
Cephalopods population dynamics and physiology are subjected to strong variability. Their 82
recruitment can vary with great amplitude (Agnew et al. 2000), and the growth of individuals is 83
highly variable and difficult to model (Jackson et al. 2003, Triantafillos 2002). The fast turn-over, 84
high productivity and strong variability of cephalopod populations causes them to have a strong inter- 85
and intra-annual variability compared to other components of the ecosystem (Bellido et al. 2001; 86
Boyle & Boletzky 1996; Jackson et al. 1998; Rodhouse et al. 1998). 87
88
Despite this important role of cephalopods for food webs, our knowledge of their ecology is still 89
incomplete (Roper & Shea, 2013, Lindgren et al., 2004). Their highly variable dynamics, their 90
elusiveness and complex behaviour makes them difficult to study (Allock et al. 2017). To this day, 91
there is no reliable method to predict future recruitments (Pierce & Guerra, 1994; Rosenberg et al. 92
1990). While a significant body of literature is available on the diet of cephalopods, the studies remain 93
subject to strong biases and uncertainty. Studies of stomach content tend to have a low robustness due 94
to the ingestion mode of cephalopods, who chop pieces of flesh off their prey (Ibañez et al. 2008). 95
Isotope studies are too scarce to be used regularly in cross-examination with gut content despite their 96
contribution to trophic studies. In a similar way, the importance of cephalopods in top predators’ diet 97
also suffers large uncertainty and is difficult to estimate as their flesh is generally digested faster than 98
fish flesh. While their hard parts (e.g. beaks) are largely undigested and can be a longer term record of 99
consumption they can survive consumption of their primary predator by a secondary predator, 100
creating prey-of-prey confusion (Santos et al. 2001). 101
102
Insights and lessons from ecosystem models
103104
In this study, I consider an ecosystem as a set of processes directing the flow of matter and energy 105
between the environment and local organisms within a given area (Blew 1996). Considering the 106
interactions between all these elements has become a recognized necessity and the ecosystem 107
5
2005). In this perspective, the use of ecosystem models has been increasing over the last three decades 109
in order to use information from relatively focused studies (i.e. on single species, single life stage or 110
single processes) in a broader frame. These models typically aim to represent the processes involved 111
in ecosystem functioning, covering physical, chemical and biological phenomenon (Fulton 2010). 112
They are powerful tools for grasping a broad understanding of ecosystem structures and the indirect 113
impacts of various components on one another. They bring new insights on ecosystem functioning, 114
clarifying various species’ role, identifying key species (Libralato et al. 2006, Stevens et al. 2000) and 115
nutrient pathways through the food web (Friedland et al. 2012). 116
117
However, these models often fail to represent cephalopod ecology with robustness (Coll et al. 2013; 118
Bulman et al. 2011; Guénette 2013). They lack adequate processes to represent the particularities of 119
cephalopod ecology and suffer from the recurrent lack of information or certainty on their life-history 120
trait parameters. As a result, little that is conclusive can be drawn from most of the current models 121
when it comes to cephalopod impacts on marine systems. Assessing the capacity of models to 122
represent species ecology is not an easy task. The first consideration is the quality and robustness of 123
the data used to parameterize functional groups. This is a relatively simple method and it is an option 124
already available in some modelling frameworks (Christensen & Walters 2004), but this information 125
is seldom displayed in articles and rarely discussed. To go further than simply data assessment, 126
considering the adequacy of actual processes represented would provide more information on models 127
capacities. However, few studies detail the actual adequacy of processes implemented in the model to 128
represent the dynamics of species of particular ecology like cephalopods. The sensitivity analysis on 129
ecosystem models can then point at the areas which lack robustness and may temper our capacities to 130
represent the functioning of ecosystems and the interactions between the ecology of various species. 131
These types of investigation can allow us to identify needs for improvement in models structure and 132
point at particular processes that require more research if we are to understand the mechanisms 133
driving marine systems. 134
6
Confronting our understanding of cephalopod ecology and its influence on food web and ecosystem 136
dynamics could give us insights on missing information. The response of models to the representation 137
of cephalopods could allow us to identify the key processes regulating their role in the system and 138
could point at eventual lack of robustness in our knowledge (Fennel et al. 2001). The assessment of 139
system sensitivity to groups with such variable and quickly evolving ecology is a major challenge for 140
today’s marine sciences. It is a necessary step towards a better appreciation of future changes in 141
ecosystem functioning 142
143
Climate change and human activities are currently putting ecosystems under heavy pressure, driving 144
them towards conditions unseen for millions of years, possibly with irreversible transformations 145
(Doney et al. 2012, Hoegh-Guldberg & Bruno 2010). Species changes in distribution, or range shifts, 146
of various species, including cephalopods, are already expected to modify ecosystem functioning 147
(Marzloff et al. 2016, Ramos et al. 2015). The improvement of the representation of ecological 148
mechanisms is an important step towards predicting future changes of systems. Modelling studies 149
based on purely empirical and statistical evidences seem to show limits. If the performance of a model 150
to depict past observations is a mark of relevance, it is not a very robust proof of its performance to 151
describe systems changes in entirely new conditions. Identifying key mechanisms driving the 152
response of ecosystems and their future changes is thus a key step if we want to identify any shifts in 153
systems functioning. 154
155
The evaluation of ecosystem model performances is often based on their capacity to hindcast (i.e. 156
replicate trends observed in past observation. However, the value of this test strongly depends on the 157
informative value of the observations i.e. the test is informative only if 1/ past data is contrasted due 158
to the effects of various mechanisms, or 2/ there is the mark of a mechanism in the observations, or 3/ 159
there were ecological changes in the past and they are reflected in observations. The capacity of a 160
model to represent future change can be thus put in doubt. For these reasons, the statistical 161
performances of models should not be the only goal, as a deep understanding of the mechanisms 162
7
implementation of the effects of environmental changes on ecosystem processes is thus a major 164
challenge to foresee future changes. 165
166
Potential role of cephalopod species as drivers of ecosystems’ functioning and services
167168
Shifts in ecosystems’ food webs are driven by some key species (Piraino et al. 2002; Tilman 2000). 169
Cephalopods are at the centre of food webs with an important role in the transfer of nutrients, and 170
could thus become an important regulator of marine ecosystem functioning. Cephalopod species are 171
very sensitive to external changes. As ectotherms, they are particularly sensitive to temperature 172
changes (Angilletta et al. 2002), and the effects of salinity and ecology on their ecology have already 173
been observed (Bazzino et al. 2005, Payne et al. 2011, Seibel 2007). The important variability of 174
cephalopods ecology, their sensitivity to their environment and their fast turn-over gives them a 175
potential advantage to respond and adapt to environmental changes faster than other species (Berteaux 176
et al. 2004). The resulting capacity to fill vacant ecological niches (Caddy & Rodhouse 1998, Pecl & 177
Jackson 2008) is probably one of the reasons behind their global increase in abundance worldwide 178
(Doubleday et al. 2016). Our understanding of future ecosystem changes would thus be significantly 179
improved by addressing the uncertainties around the impact of cephalopods on the system. It is 180
important to understand the mechanisms driving various species reactions to external changes and 181
how they will interact with each other to identify the future dynamics of marine systems. 182
183
This type of research also provides an extremely valuable insight for the management of marine 184
resource exploitation as catches of cephalopods are increasing worldwide due to their increase in 185
abundance and a renewed interest from fisheries (FAO 2015). In Australia, catches of cephalopods by 186
fisheries have increased substantially from the end of the 1970s, rising from a couple hundred tonnes 187
in the 1975 to 2000-7000 tonnes since 2000 (FAO 2016). Although two squid species, Nototodarus
188
gouldi and Sepioteuthis australis comprise the major part of catches, fisheries capture a variety of 189
8
Sepia apama; Nottage et al. 2007). In the last four decades, the economic and provisioning role of 191
cephalopods for fisheries worldwide has continued to grow, with annual harvest now more than 4 192
million tonnes (in 2013), representing 5% of the total harvest of all species from marine waters 193
(Caddy & Rodhouse 1998; Hunsicker et al. 2010, FAO 2015). However, the importance of 194
cephalopods for fisheries cannot be estimated only by their catches. As key prey sources, on average 195
cephalopods support approximately 15% of marine fisheries landings by weight and 20% by landed 196
value (Hunsicker et al. 2010). This highlights their role in the support of ecosystem services, and the 197
need to assess management of cephalopod fisheries with an ecosystem approach if we want to ensure 198
the sustainability of ecosystem services. 199
200
Interests of South East Australian region and local ecosystem model
201202
The use of ecosystem models to gather and confront our knowledge of cephalopod and other species 203
ecology can bring valuable insight. However, the more information available there is on their ecology, 204
the more robust are the conclusions of the models. In this regard, a significant body of work has been 205
done in South East Australia (Green 2011, Stark 2008, Steer et al. 2007, Triantafillos 2002). This is 206
also a rapidly warming region of “hotspot” (Hobday & Pecl 2014) and thus provides an exceptional 207
opportunity to gain insights on transformations that will occur later over the globe (Pecl et al. 2014). 208
These two criteria highlighted the region as a great area of focus to study the changing nature of 209
cephalopods’ role in ecosystem functioning. 210
211
To understand better the challenges that are to come, I am updating a South Eastern Australian model 212
to more effectively represent the role of cephalopods and to evaluate their impact on marine 213
ecosystems. Among the several model of the region (Bulman 2006, Fulton & Johnson 2012, 214
Goldsworthy et al. 2013), I chose the models from Johnson (2013) covering a relatively wide area and 215
encompassing both the neritic and oceanic habitats in order to avoid emphasizing one part of the food 216
9
(i.e. direct predators). The effect of climate change following different IPCC scenarios on the 218
oceanography of our model has already been implemented, and thus was already available for us to 219
introduce to our ecosystem model. The implementation of various climate change scenarios and 220
fishery management strategies should allow us to assess the changing nature of cephalopod ecology 221
and ecosystem functioning, and give an insight to the consequences on fisheries resources. This points 222
to the outcomes of various management strategies and could allow us to identify opportunities and 223
risks associated with climate change in terms of biodiversity, ecosystem functioning and ecosystem 224
services. This work could give us a strong insight into the future changes that are emerging worldwide 225
due to climate change and human exploitation. It could also ultimately provide valuable insight to 226
improve Ecosystem Based Management to better adapt the exploitation of marine resources to climate 227
change, whether it is to mitigate human impact on systems or/and to optimize marine resources use. 228
10
Chapter 2
The ecological role of cephalopods and their representation
231in ecosystem models.
232233
Abstract
234235
Cephalopods, especially squids, are believed to have a structuring role in marine ecosystems as a link 236
between different trophic levels, primarily due to their voracious prey consumption and high 237
production rate. Cephalopod ecology, however, is still poorly understood as observational studies 238
often give highly uncertain and variable results due to the peculiarities of cephalopod behaviour and 239
biology, and their responsiveness to external drivers. This review evaluates our representation of 240
cephalopods in ecosystem models and the insights given by these models on the role of cephalopods 241
in our oceans. We examined ecosystem models from 13 regions to analyse the representation of 242
cephalopods and compared their results to local trophic studies. Our analysis indicated that most 243
ecosystem models inadequately include cephalopods in terms of model structure and 244
parameterization; although some models still have the capacity to draw valuable conclusions 245
regarding the impact and role of cephalopods within the system. Oceanic squid species have a major 246
role linking trophic levels and food webs from different habitats. The importance of neritic species 247
varies locally, but generally cephalopods have a substantial impact via their consumer role. To better 248
understand the ecological role of cephalopods, improved representation of these species in ecosystem 249
models is a critical requirement and could be achieved relatively easily to more accurately articulate 250
the mechanisms regulating the ecological role of cephalopods. 251
11
Introduction
253
The importance of squids to society goes beyond the legends and mythologies of ocean monsters with 254
giant tentacles. In the last four decades, the economic and provisioning role of cephalopods for 255
fisheries has continued to grow, with annual harvest now more than 4 million tonnes (in 2013), 256
representing 5% of the total harvest of all species from marine waters (Arkhipkin et al. 2015; Caddy 257
& Rodhouse 1998; Hunsicker et al. 2010, FAO 2015). However, the importance of cephalopods for 258
fisheries cannot be estimated only by their catches. As key prey sources, on average cephalopods 259
support approximately 15% of marine fisheries landings by weight and 20% by landed value 260
(Hunsicker et al. 2010). In some areas, this indirect contribution of cephalopods can reach up to 55% 261
of the landings (tonnes) and 70% of the value of fisheries. Approximately 75% of this contribution is 262
made by providing a food resource to exploited species like finfishes that are feeding on them 263
(Hunsicker et al. 2010). Thus, consideration of the ecological roles of cephalopods is necessary for 264
developing a more complete understanding of ecosystem dynamics and of the true importance of 265
cephalopods to ecosystems and the human societies dependent on them, although knowledge of their 266
ecology is still incomplete (Lindgren et al. 2004; Roper & Shea 2013). This chapter aims to identify 267
the caveats of ecosystem models attempting to represent cephalopods and propose a way forward for 268
addressing these limits and improving our understanding of the ecological role of cephalopods. 269
270
Because of their voracious feeding activity, squid and other cephalopods are believed to exert a top-271
down control on their prey (Rodhouse & Nigmatullin 1996). Generally feeding on small crustaceans 272
as juveniles, they shift to micronekton, other cephalopods (including cannibalism) and larger fishes as 273
they grow to maturity (Rodhouse & Nigmatullin 1996; Parry 2006; Ruiz-Cooley et al. 2006). Due to 274
their exceptional capture apparatus (i.e. prehensile arms and tentacles) they have the capacity to grab 275
or even bite flesh off relatively large animals and thus prey on a wide size spectrum (Rodhouse & 276
Nigmatullin 1996). They can thus act as top predators and may feed on exploited fishes (Neira & 277
Arancibia 2013; Field et al. 2007). Moreover, cephalopods can be important prey of apical predators, 278
12
2013; Smale 1996). Their swimming capability and use of currents allows many species to migrate 280
between distinct habitats (Ibáñez et al. 2015; O’Dor 2002) while their dynamic camouflage allows 281
them to be efficient hunters (Adamo et al. 2006; Barbosa et al. 2008; Hanlon 2007; Staudinger et al. 282
2011). All these factors give cephalopods an important role in energy and nutrient transfer in food 283
webs. They are often a key link between micronekton and many top predators (Field et al. 2013; 284
Griffiths et al. 2010; Olson & Watters 2003). In some systems, cephalopods could play a keystone 285
role, with potential to significantly increase the speed of nutrient transfer and affect a large range of 286
species in the ecosystem (Coll et al. 2013; Rocha et al. 2001; Smale 1996; Young et al. 2013). 287
288
Cephalopods have a peculiar ecology and are a unique component of the ecosystems they inhabit 289
(Boyle & Boletzky 1996). They have a short lifespan of less than one or two years and often die after 290
spawning, although many species will spawn multiple times within one season (Van Heukelem 1976; 291
Forsythe et al. 1994; Anderson & Rodhouse 2001; Pecl 2001; Rocha et al. 2001; Arkhipkin 2004). 292
This leads to cephalopod populations having strong inter- and intra-annual variability compared to 293
other components of the ecosystem (Boyle & Boletzky 1996; Rodhouse et al. 1998). Cephalopods are 294
also distinct from other species that share similar trophic levels (e.g. largely teleosts) as they have a 295
fast growth rate and metabolism that are supported by a voracious predatory behaviour (Rodhouse et 296
al. 1998; Rodhouse & Nigmatullin 1996) coupled with a high food conversion efficiency (O’Dor & 297
Webber 1986; Lee 1995). These traits result in cephalopods having potentially high productivity 298
(O’Dor & Webber 1986; Nigmatullin 2004) which can lead to occasional strong peaks in cephalopod 299
biomass (Rodhouse et al. 1998; Neira & Arancibia 2013). 300
301
The high turn-over rate of cephalopod species, as a function of their short life-spans, and their 302
sensitivity to environmental changes, are likely to give them the opportunity to respond faster than 303
many other species to climate change and to fishery pressures (André et al. 2010; Berteaux et al. 304
2004; Caddy & Rodhouse 1998; Hughes et al. 2005; Pecl & Jackson 2008). This responsiveness could 305
increase the importance of their role in ecosystem function and their provisioning role for global 306
13
abundance estimates of these species (Cherel et al. 2008; Field et al. 2007; Lee 1995; Piatkowski 308
2001; Pierce & Guerra 1994; Wormuth & Roper 1983). More information on the causes of population 309
variability and on the interactions of cephalopods with other species would significantly improve our 310
understanding of ecosystem functioning. 311
312
The particularities of cephalopod ecology and their role in ecosystems led to the organization of many 313
conferences with a specific focus on cephalopods, including those hosted by the Cephalopod 314
International Advisory Council (CIAC) (Jackson et al. 2007) or the ICES (Piatkowski 2001) and 315
many other workshops (Moltschaniwskyj et al. 2006). A great deal of new research on ecosystem 316
functioning and cephalopod ecology has been produced over recent years, bringing new knowledge of 317
the role of these species in ecosystems. Synthesising this information into a coherent broader 318
understanding and identifying knowledge gaps pertaining to the roles of cephalopods in food webs 319
can provide knowledge to facilitate better management of exploitation of marine ecosystems and food 320
resources (Anderson et al. 2011), and more robustly predict how this important group may respond to 321
climate change. This is a large task and not necessarily tractable in a single study. As a first step to 322
address this issue, here we assess the current representation of cephalopods in ecosystem models and 323
suggests the necessary improvements that could be undertaken to enhance our understanding of their 324
ecological role. We have chosen to restrict our work to ecosystems where there is interaction between 325
the open ocean and the shelf, as these regions of high productivity typically host a wide variety of 326
cephalopod species. 327
328
Cephalopod species are concentrated in coastal areas and adjacent open waters (Roper et al. 2005; 329
Tittensor et al. 2010; Voss 1967), and so our study focuses in these areas. In many coastal areas, the 330
inputs and recycling processes of nutrients, and associated enhanced primary productivity, means 331
these regions host a high species richness (Longhurst et al. 1995; Roper et al. 2005; Thomas & Borges 332
2012). Moreover, the warmer temperatures of coastal waters support greater activity at a lower 333
metabolic cost (Clarke & Gaston 2006; Currie et al. 2004; Tittensor et al. 2010) and the waters are 334
14
the slope and onto the shelf (Seitzinger & Giblin 1996). The episodic nature of upwelling events and 336
river flows can make the environment highly variable, more than doubling productivity in short pulses 337
(Yoder et al. 1983; Eadie et al. 1994), meaning species like some cephalopods that can respond 338
quickly see maximum benefit. The productivity of shelf waters has a broader footprint, however, as 339
excess production and nutrients (rapidly remineralised in shelf sediments) are exported to adjacent 340
coastal sea waters (Thomas & Borges 2012). The export of carbon is enhanced by strong 341
benthopelagic coupling, facilitated by the close proximity of these habitats in shallow waters. 342
343
In general, cuttlefishes are primarily demersal species occupying continental shelf areas in warm and 344
temperate waters. Octopus species live in benthic habitats and range from shallow coastal waters 345
down to approximately 5,000m (Collins et al. 2001; González & Sánchez 2002). Octopuses and 346
cuttlefishes generally dominate demersal assemblages of neritic areas (Quetglas et al. 2000; Boyle & 347
Rodhouse 2005; González & Sánchez 2002). In contrast, squid species dominate the water column 348
(Quetglas et al. 2000; Boyle & Rodhouse 2005; Brunetti et al. 1998). Except for some shallow water 349
species and reef species (Boyle & Rodhouse 2005), most squid species inhabit pelagic habitats. For 350
example, Loliginids are distributed in neritic areas; Gonatids are present in oceanic waters adjacent to 351
the continental shelf; and the Ommastrephid family, which represents more than half of the world’s 352
cephalopod fishery catch, undergo seasonal migrations between oceanic and shelf waters (Boyle & 353
Rodhouse 2005; Roper et al. 2005). The jumbo squid for example, an iconic species of 354
Ommastrephid, is mostly exploited by inshore fisheries, but also sustains an important offshore 355
fishery off the south American coast (Rocha & Vega 2003). The migrations undertaken by many of 356
these oceanic species are an important link between food webs of the open ocean and neritic waters 357
(Roper et al. 2005; Brunetti et al. 1998; Arkhipkin 2013). It was thus important that the work 358
reviewed here covered both neritic and adjacent oceanic habitat. 359
360
Globally, cephalopod species are recognized as a major component of many marine ecosystems. They 361
are present in all marine waters with a distribution from the surface layers down to several thousand 362
15
areas have high primary and secondary productivity (Longhurst et al. 1995), host a wide variety of 364
squid, octopod and cuttlefish species (Clarke 1996; Haimovici & Perez 1991; Quetglas et al. 2000), 365
and are likely to be particularly strongly influenced by cephalopod species. Additionally, these 366
regions also concentrate human impacts by hosting intensive marine fisheries, aquaculture, tourism 367
and resource extraction activities (Halpern et al. 2008); understanding the functioning of these 368
ecosystems will underpin and facilitate ecosystem-based and sustainable management. 369
370
Dynamic ecosystem models have been used by Coll et al. (2013) (Coll et al. 2013) to support a broad 371
literature review of the importance of squids in ecosystems around the world. However, this valuable 372
study focused on an impact index, and it was not within its scope to discuss the differences in roles 373
and modalities of impact of various groups of cephalopods or the issue of missing information and its 374
implications for model parameterisation and results. Considering that many studies point at the issue 375
of the representation of cephalopods in models and the uncertainty of their parameters (Coll et al. 376
2013; Gasalla & Rossi-Wongtschowski 2004; Bulman et al. 2011; Guénette 2013), our goal is to 377
evaluate the adequacy of ecosystem models to assess the role of these groups in marine systems, and 378
the potential effect on our understanding of ecosystem functioning. To achieve that, we first evaluate 379
the representation of cephalopods in models, the quality of data associated with their parameterization 380
and the structure of the model. We then assess the sensitivity of models by analysing their results and 381
quantification of the impact of cephalopods. We identify cephalopod traits associated with the role of 382
different functional groups and their impact on the system. We also compared these results with more 383
common studies using alternative approaches to examine the trophic ecology of cephalopods in our 384
areas of interest to determine if the outputs of the models we examined were consistent with previous 385
understanding of the ecological role and impact of cephalopods. We then highlight the improvements 386
that can be made to better understand the ecological role of cephalopods and identify ways in which 387
16
Methods
389
To analyse the adequacy of models to assess the role of cephalopods, we considered two main 390
elements. The first is the quality of data used in the parameterization, as it will affect models 391
conclusions and their robustness. The second is the structure and processes representing cephalopod 392
ecology in the model, which will influence the potential insights and results of models. We ranked 393
these two criteria for each model to combine them and evaluate the adequacy of models and of the 394
insights they can give. The role of cephalopods in ecosystem models is obtained from indexes that are 395
measures of a group’s impact on the system. We then compare the results from these models with 396
findings from other approaches, gathered from studies that provided direct insight on the trophic role 397
of cephalopods. 398
399
We reviewed a wide range of studies used to estimate cephalopod parameters in models, and allocated 400
different scores as indexes of the data robustness (appendix 2-1). The types of data and studies used to 401
provide this information include fisheries catches and trawl surveys (Chambers & Dick 2007; 402
Rodhouse et al. 1995; Rodhouse et al. 2014; Watanabe et al. 2006) to indicate the abundance, 403
distribution and habitats of cephalopod species. Diet composition, isotopic and elemental analysis of 404
cephalopod species and their predators (Parry 2006; Takai et al. 2000; Clarke 2006; Cherel et al. 405
2009) also give indices of their distribution, and show their trophic links and interactions with other 406
species. A key determinant of the role of cephalopods as system connectivity agents is their 407
movement and migration patterns. This has largely been explored using tagging studies, either 408
physical (e.g. electronic) tags (Pecl et al. 2006) or chemical tags (Pecl et al. 2010; Semmens et al. 409
2007). Cephalopod growth and production has been studied through laboratory growth studies 410
(Forsythe et al. 1994), and analysis of statolith increments (Quetglas & Morales-Nin 2004) or beak 411
increments (Perales-Raya et al. 2010) from wild-caught animals. 412
413
To rank the quality of data, we allocated scores based on the type of data used and its origin, whether 414
17
to balance the model. Due to the inherent complexity of ecosystem models, we focused our analysis 416
on some key parameters (table 2-1) and used the mean score of parameters for each model. If a model 417
displayed several cephalopod groups, we only considered the group with the best score. We thus 418
avoided giving a lower score to models with a good representation of a key cephalopod species with 419
relatively strong impact on the system and a less robust representation of species of minimum 420
importance. 421
422
Table 2-1. parameters considered in scoring the quality of data of the model. for each of those 423
parameters, we looked into the source of information used to build the model and assigned a 424
corresponding confidence score. 425
EwE Atlantis
Biomass Biomass
Consumption Search volume
Predators diet (production) Predators diet
Diet Diet
Distribution and movement Distribution and movement
― Predators size selectivity
― Habitat protection
― Growth
― Recruitment
Parameters involved in similar processes between models are aligned, although it should be noted that 426
equivalences are rarely complete. We excluded vulnerability and prey preferences parameters 427
(respectively from EwE and Atlantis) from the study. These parameters are known to be highly 428
uncertain (as they are not directly measurable) and are estimated through the calibration process, 429
fitting the model to observations, after other parameters (across the entire food web) are estimated. 430
Consequently, including them would bring all score down across the board and would not assist the 431
comparisons. 432
433
In Ecopath with Ecosim (EwE) (Christensen & Walters 2004), a relatively commonly used ecosystem 434
modelling framework, the ‘Pedigree index’ allows assignment of a score to each parameter based on 435
the origin of the data used to build the model. However, this index was too seldom given in model 436
18
ranking framework which allowed us to assign a score ourselves and to also consider a broader range 438
of ecosystem models (e.g. Atlantis) rather than only EwE models (table 2-1 and 2-2). This marking 439
method was applied to both EwE and Atlantis studies. Only these two types of models were included 440
because they are the most commonly found at present. OSMOSE models (Marzloff et al. 2009) have 441
resolved squid in a way that resolves some of the issues identified here, but still essentially treats them 442
like fish. Consequently, by restricting our review to the most common modelling platforms we can 443
provide lessons for new implementations of those models and to the development of other modelling 444
platforms. 445
446
Even though we have decided not to score these parameters involved in diet determination, it is worth 447
noting that there is a documented lack of precision in cephalopod diet studies (Field et al. 2007; 448
Ibáñez et al. 2008; Rodhouse & Nigmatullin 1996) and in their estimation in predator diets 449
(Staudinger et al. 2013). The strong variability in growth (Chen & Chiu 2003; Jackson et al. 2003), 450
recruitment (Berteaux et al. 2004) or behaviour (Staudinger et al. 2011) and difficulty in identifying 451
the processes controlling these, has led to relatively poor inclusion of cephalopods in ecosystem 452
models (Fulton 2010). We therefore thought it necessary to clearly separate the last two categories of 453
data quality (table 2-1) due to this important bias of many cephalopod studies. 454
455
The ranking of model structure is based on the representation of cephalopod functional groups and the 456
associated ecological processes. A different grouping or representation of processes would allow for 457
different trajectories and for different conclusions to be drawn regarding the species concerned. 458
Models with distinct functional groups for cephalopod species and with more detailed processes are 459
thus given higher scores, while models representing all cephalopods in a single groups with limited 460
details receive lower scores. 461
19
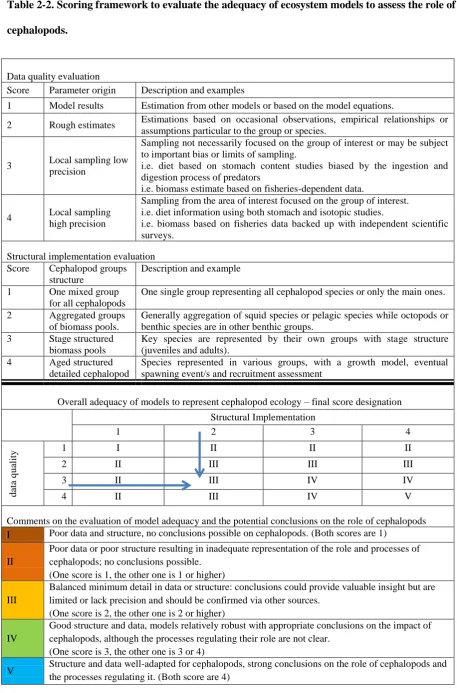
Table 2-2. Scoring framework to evaluate the adequacy of ecosystem models to assess the role of 464
cephalopods. 465
Data quality evaluation
Score Parameter origin Description and examples
1 Model results Estimation from other models or based on the model equations.
2 Rough estimates Estimations based on occasional observations, empirical relationships or assumptions particular to the group or species.
3 Local sampling low precision
Sampling not necessarily focused on the group of interest or may be subject to important bias or limits of sampling.
i.e. diet based on stomach content studies biased by the ingestion and digestion process of predators
i.e. biomass estimate based on fisheries-dependent data.
4 Local sampling high precision
Sampling from the area of interest focused on the group of interest. i.e. diet information using both stomach and isotopic studies.
i.e. biomass based on fisheries data backed up with independent scientific surveys.
Structural implementation evaluation Score Cephalopod groups
structure
Description and example
1 One mixed group for all cephalopods
One single group representing all cephalopod species or only the main ones.
2 Aggregated groups of biomass pools.
Generally aggregation of squid species or pelagic species while octopods or benthic species are in other benthic groups.
3 Stage structured biomass pools
Key species are represented by their own groups with stage structure (juveniles and adults).
4 Aged structured detailed cephalopod
Species represented in various groups, with a growth model, eventual spawning event/s and recruitment assessment
Overall adequacy of models to represent cephalopod ecology – final score designation Structural Implementation
1 2 3 4
d
ata
q
u
ality
1 I II II II
2 II III III III
3 II III IV IV
4 II III IV V
Comments on the evaluation of model adequacy and the potential conclusions on the role of cephalopods I Poor data and structure, no conclusions possible on cephalopods. (Both scores are 1)
II
Poor data or poor structure resulting in inadequate representation of the role and processes of cephalopods; no conclusions possible.
(One score is 1, the other one is 1 or higher)
III
Balanced minimum detail in data or structure: conclusions could provide valuable insight but are limited or lack precision and should be confirmed via other sources.
(One score is 2, the other one is 2 or higher)
IV
Good structure and data, models relatively robust with appropriate conclusions on the impact of cephalopods, although the processes regulating their role are not clear.
(One score is 3, the other one is 3 or 4)
20
Categories represent the type of data and model structure used to represent cephalopods, and are allocated a 466
score. The data quality evaluation is based on the relative robustness of cephalopod parameters derived from 467
various sources of information. The structural implementation adequacy is based on the coherence of the 468
functional grouping of cephalopods and the processes represented. Distinct functional groupings with detailed 469
representation of processes are given a higher score. 1=lowest implementation or data quality, 4=highest. These 470
scores are then combined to determine the overall model adequacy to assess the ecological role of cephalopods 471
in each ecosystem. The lowest score of the structure implementation or data quality was considered the limiting 472
factor in a given model. We thus used the lowest score to arrive at the final overall score of the implementation. 473
All models-scores are outlined in appendix 2-2. For example: for the model of Tasmanian waters presented in 474
Watson et al. (2013); average data quality score is 1.7 (rounded to category 2); and structure quality is scored as 475
3; its overall adequacy for representing cephalopod ecology is thus 3. 476
477
An overall model quality score, combining the two previously mentioned component scores, allowed 478
us to evaluate the adequacy of models to assess the role of cephalopods and their likely impact on the 479
ecosystem (table 2-1). Models with high data quality are not very informative if the biological 480
mechanisms are poorly represented. On the other hand, a model with very detailed processes but low 481
quality data would lack robustness and be purely speculative. The overall score of models is thus 482
based on the lowest mark between the structural appropriateness and data quality. However, the 483
model quality score refers only to the adequacy of the way cephalopods are included in the model and 484
we recognise that this was not the explicit focus of many of the models. Models maybe for example 485
focused on entirely different species or processes and provide very good conclusions in that regard, 486
but have a poor capacity to assess the potential role and impact of cephalopods. 487
488
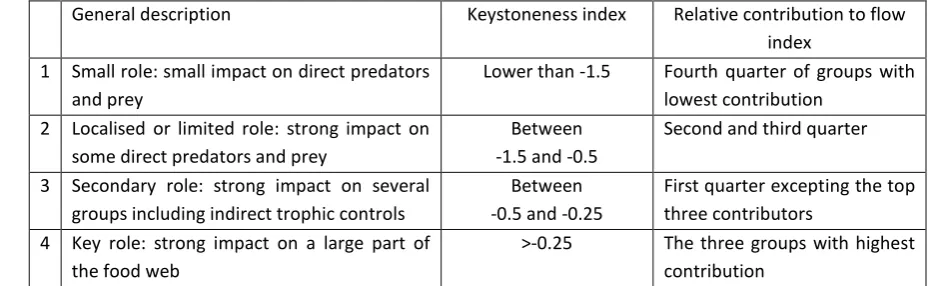
To assess the role of cephalopods in the system we used the keystoneness index and relative 489
contribution to the biomass flow through the overall model to give an indication of the impact of a 490
group on the system relative to the group’s biomass. A keystone group is a group that would 491
significantly affect other groups even with a relatively small change in biomass (Libralato et al. 2006). 492
21
The relative contribution to a system’s total biomass flow is an indicator of the importance of a group 494
[image:32.595.52.518.193.336.2]in the transfer of nutrient from lower trophic levels to top predators. 495
Table 2-3. Assessment of the relative impact of cephalopods on the ecosystem considered within 496
each model. 497
General description Keystoneness index Relative contribution to flow index
1 Small role: small impact on direct predators and prey
Lower than -1.5 Fourth quarter of groups with lowest contribution
2 Localised or limited role: strong impact on some direct predators and prey
Between -1.5 and -0.5
Second and third quarter
3 Secondary role: strong impact on several groups including indirect trophic controls
Between -0.5 and -0.25
First quarter excepting the top three contributors
4 Key role: strong impact on a large part of the food web
>-0.25 The three groups with highest contribution
The keystoneness index and relative contribution to flow were obtained from results of EwE models available 498
on EcoBase (http://sirs.agrocampus-ouest.fr/EcoBase/). A high keystoneness index is close to 0 while groups 499
with smaller impact have lower (more negative) keystoneness. The relative contribution to flow is an estimate of 500
the part of nutrient flow in the system that go through groups. 501
502 503
In order to identify new insights from ecosystem models, we compared model results with insights 504
from other approaches, gathered from studies that provided direct insight on the trophic role of 505
cephalopods (appendix 2-3). While predator diets provide direct information on the role of 506
cephalopods as prey and their potential bottom-up impact, cephalopod diet and consumption 507
estimation studies provide a direct indication of their top-down impact. Some of these studies were 508
used to implement models, and are therefore reflected in scores. However, additional or posterior 509
work allowed us to confront the outputs of models with results from ecological observations from the 510
field. 511
512
Lastly, we recognise that our scoring scheme is somewhat subjective and was completed by 513
researchers not directly involved in actual model construction. In order to test the robustness of our 514
22
the models reviewed from each region (appendix 2-5). We requested that they assign scores to their 516
own models following our framework, assessing the quality of data they used and the impact of 517
cephalopods in their model. We received feedback from five of our areas of interest, providing a first 518
estimate of the validity of the method. 519
520
Results
521While limited in terms of the number of responses received, the feedback received from the model 522
experts suggests that our scoring of the model implementation is accurate. Our scores of the impact of 523
cephalopods on the system could, however, be less reliable in areas where there is also a low 524
implementation score, as they are not believed to have a key role in the system. Nevertheless the 525
scoring is seems a useful approach for understanding the efficacy of modelling approaches. 526
Adequacy of ecosystem models to assess the ecological role of cephalopods
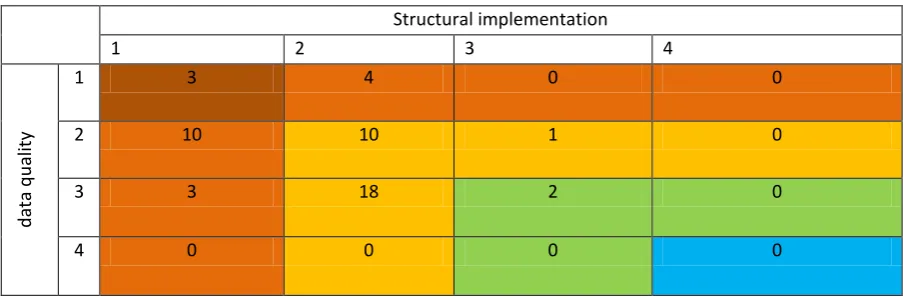
527Many of the models considered (20 out of 51) had a final implementation score of 1 or 2, and thus 528
were assessed as inadequate to focus on the role of cephalopods in ecosystems and the processes 529
involved (table 2-4). Some models do have the capacity to give a valuable insight of the impact of 530
cephalopods (29 out of 51), but the structure of the model limits the conclusions of many of them. 531
Only two models were considered adequate to provide good insights on this topic. We could not find 532
any models with both structure and data adapted to adequately consider cephalopod ecology. 533
[image:33.595.66.518.622.771.2]534
Table 2-4. Adequacy of the implementation of cephalopods in ecosystem models. 535
Structural implementation
1 2 3 4
d
at
a
q
u
alit
y
1 3 4 0 0
2 10 10 1 0
3 3 18 2 0
23
Colours represent the global model adequacy to assess role of cephalopods, following the colour code displayed 536
in table 2-3. Numbers inside the table correspond to the number of models that we allocated to that category. 537
538 539
The lack of data is a common issue across models (table 2-3), with only 23 models being built with 540
local data. We could not find a model with most parameters built with good information based on 541
local studies of high precision. Gut contents of cephalopods and fisheries catch data were regularly 542
used to estimate predator-prey behaviour and biomasses, with little information available to address 543
the biases and limits of these studies. 544
545
However, the poor inclusion of cephalopods in ecosystem models is the primary concern, with only 546
three models with specific groups for key species. We found 16 models with only one single group for 547
all cephalopods combined and 32 models with only one clear group representing some cephalopod 548
species while others were part of more generalist groups. An improvement in the way cephalopods are 549
included in these models would clearly substantially improve the adequacy of models (table 2-3), and 550
many of the existing models could provide more robust and meaningful results on this important 551
component of the ecosystem. 552
Ecosystem models and cephalopods’ impact on the food web
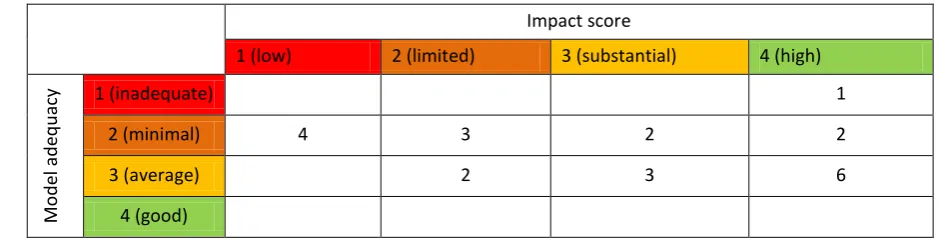
553We could score the role of cephalopods in 23 models out of the 59 considered. Models with better 554
implementation often show a higher impact of cephalopods; although this is not universal, with some 555
of them still showing a secondary impact of these species on the food web (Link et al. 2010; Lassalle 556
et al. 2011). These results indicate that the quality of cephalopod implementation in a given model is 557
not correlated with the impact of cephalopods found in that model. Improving the representation of 558
cephalopods in models would therefore not result in a bias (artificial enhancement) regarding their 559
perceived importance. On the contrary, model improvements would likely allow for substantial 560
24
for models showing a potential strong impact of cephalopods in the system, but where their 562
implementation is too poor to draw conclusions regarding their role. 563
[image:35.595.53.523.179.299.2]564
Table 2-5. Evaluation of the implementation and role of cephalopods in ecosystem models. 565
Impact score
1 (low) 2 (limited) 3 (substantial) 4 (high)
Mo
d
el a
d
eq
u
acy 1 (inadequate) 1
2 (minimal) 4 3 2 2
3 (average) 2 3 6
4 (good)
Note only the 23 models in which we could allocate an impact score are displayed in this table. 566
567
We observed no key difference between implementation quality in EwE compared with Atlantis 568
models even though Atlantis parameterization can be more demanding (appendix 2-2). This seemed to 569
be due to the grouping of ecologically different species and relatively poor estimates of parameters in 570
both frameworks. 571
572
In six geographical areas out of 13, the implementation of cephalopods is insufficient, given their 573
suggested impact on the system, and improvements to the model could bring new understandings of 574
the ecosystem functioning (fig 2-1). In three areas, models are adequate enough to provide valuable 575
insight on the role of cephalopods, but improvements in their representation in the models could bring 576
even greater understanding of their role, and importantly, the processes involved. 577
578