promoting access to White Rose research papers
White Rose Research Online
[email protected]
Universities of Leeds, Sheffield and York
http://eprints.whiterose.ac.uk/
This is a copy of the final published version of a paper published via gold open access in
Social Science and Medicine
.
This open access article is distributed under the terms of the Creative Commons
Attribution Licence (http://creativecommons.org/licenses/by/3.0), which permits
unrestricted use, distribution, and reproduction in any medium, provided the original
work is properly cited.
White Rose Research Online URL for this paper:
http://eprints.whiterose.ac.uk/id/eprint/76202
Published paper
The impact of adding an extra dimension to a preference-based measure
John Brazier
a,*, Donna Rowen
a, Aki Tsuchiya
a, Yaling Yang
b, Tracy A Young
aaUniversity of Sheffield, UK bBrunel University, UK
a r t i c l e i n f o
Article history:
Available online 2 June 2011
Keywords:
Preference-based measures of health Cross programme comparability Condition-specific measures UK
a b s t r a c t
The ability to compare incremental changes in Quality Adjusted Life Years (QALYs) generated by different condition-specific preference-based measures (CSPBMs), or indeed between generic measures, is often criticised even where the valuation methods and source of values are the same. A key concern is the impact of excluding key dimensions from a descriptive system. This study examines the impact of adding a generic pain/discomfort dimension to a CSPBM, the AQL-5D (an asthma-specific CSPBM), by valuing samples of states from the AQL-5D with and without the new dimension using an interviewer admin-istered time trade-off with a sample of the UK general public. 180 respondents provided 720 valuations for states with and without pain/discomfort. As expected the additional pain/discomfort dimension was found to have a significant and relatively large coefficient. More importantly for comparing changes in QALYs across populations the addition of pain/discomfort significantly impacts on the coefficients of the other dimensions and the degree of impact differs by dimension and severity level. The net effect on the utility value depends on the severity of their state: the addition of pain/discomfort at level 1 (no pain/ discomfort) or 2 (moderate pain/discomfort) significantly increased the mean health state values in an asthma patient population; whereas level 3 pain/discomfort (extreme) reduced values. Comparability between measures requires that the impact of different dimensions on preferences is additive, whether or not they are included in the classification system. Our results cast doubt on this assumption, implying that the chosen measure must contain all important and relevant dimensions in its classification system. Ó2011 Published by Elsevier Ltd.
Introduction
Recent years has seen the rise of generic preference-based measures in populating cost per QALY analyses, with the EQ-5D gaining a special status as the preferred measure for economic evaluations submitted to the National Institute for Health and Clinical Excellence of England and Wales (NICE, 2008). It has been claimed that‘generic’preference-based measures are applicable to all interventions and patient groups. This claim has support in many conditions where it has been shown to be reliable, valid and responsive (Brazier, Ratcliffe, Tsuchiya, & Solomon, 2007). However, one or more of the generic preference-based measures have been shown to perform poorly in some conditions, such as visual impairment in macular degeneration (Espallargues et al, 2005), hearing loss (Barton, Bankart, & Davis, 2004), leg ulcers (Walters, Morrell, & Dixon, 1999), and urinary incontinence (Haywood, Garratt, Lall, Smith, & Lamb, 2008). For this and other reasons many clinicians and researchers use condition-specific measures that are not preference-based.
There has been increasing interest in the development of condition-specific preference-based measures (CSPBM). This has been achieved either by the development of entirely new measures (e.g. Revicki, Leidy, Brennan-Diemer, Sorenson, & Togias, 1998; Revicki, Leidy, Brennan-Diemer, Thomson, & Togias, 1998; Torrance et al., 2004), or by developing health state classifications amenable to valuation from existing condition-specific measures (Brazier et al., 2008; Kok, McDonnell, & et al, 2002; Ratcliffe, Brazier, Tsuchiya, & et al, 2009; Stevens, Brazier, McKenna, Doward, & Cork, 2005; Young, Yang, Brazier, Tsuchiya, & Coyne, 2009). However, there remain some fundamental concerns as to whether they can be used to make comparisons between interventions for different conditions (Brazier & Tsuchiya, 2010; Dowie, 2002; Gold, Siegel, Russell, & Weinstein, 1996). Even using generic systems does not ensure comparability, since significant differences have been shown between the different generic preference-based measures (Moock & Kohlmann, 2008). One way to achieve cross programme comparability is to use the same generic preference-based measure. Using one instrument in all studies ensures that different patient groups are being judged in terms of the same dimensions of health, using the same valuation methods and utility values obtained from the same sample. For this reason, NICE has *Corresponding author.
E-mail address:j.e.brazier@sheffield.ac.uk(J. Brazier).
Contents lists available atScienceDirect
Social Science & Medicine
j o u r n a l h o m e p a g e : w w w . e l s e v i e r . c o m / l o c a t e / s o c s c i m e d
expressed a preference for the EQ-5D in its reference case methods (NICE, 2008), though other agencies interested in seeing cost utility analysis of health care interventions have been less prescriptive.
An alternative view is that comparability can be achieved by the use of a common numeraire like money or a year in full health. Provided the values are obtained using the same tightly specified valuation ‘protocol’ in terms of the valuation technique (and variant), procedures, common anchors (full health and death), visual aids and the same type of respondents (such as a represen-tative sample of the general population), then a common measuring stick is being used and so comparisons can be made between quality adjustment weights estimated using different descriptive systems. This means that there is no need to have a common descriptive system.
However, there are a number of obstacles to achieving compa-rability from using different descriptive systems including the need to handle side-effects and co-morbidities (Brazier & Tsuchiya, 2010). The failure to pick-up important side-effects of treatment is the rationale in clinical research for using a generic measure alongside a condition-specific measure in a trial. The problem for economic evaluation is that it needs a single measure of effectiveness. Even assuming there are no side-effects, the achievement of compara-bility between specific preference-based instruments requires an additional assumption, namely that the impact of different dimen-sions on preferences is additive, whether or not they are included in the descriptive system. The impact of breathlessness on health state values, for example, must be the same whether or not the patient has co-morbidities that impact on dimensions not covered by the descriptive system, such as pain in joints.
The impact of dimensions external to the descriptive system may be the product of a form of focussing effect (or focussing illusion). We focus on those things that are placed in front of us. Respondents, therefore, will tend to focus on the problems described in the health state they are valuing. This results in respondents exaggerating the importance of the problems in the health state they are being asked to value to the neglect of any domains not covered by the health state classification system. They may have a view about the level of other dimensions, but this may carry less weight. Or alternatively, different people may bring different assumptions about the level of the unmentioned dimen-sions. Either way, the addition of dimensions may have implica-tions for the entire structure of the utility function for health.
This issue has implications for the development of add-on dimensions to extend the coverage of generic measures like the EQ-5D. Studies have examined the impact of adding-on dimensions for cognition (Krabbe, Marlies, Stouthard, & et al, 1999) and sleep (Yang et al, 2008), which in the case of the former was found to be significant in a student population and in the latter not significant in a sample of the general population using time trade-off (TTO). The same approach can be applied to improving CSPBM that are narrower in their focus by adding-on more generic dimensions. This paper examines the impact of adding-on a pain/discomfort dimension to a preference-based asthma-specific measure. Pain/ discomfort has been shown to have a large impact on health state values across the generics, so it provides a good opportunity to test the concerns with CSPBM raised above as well as the more general problems associated with the add-on approach.
The main aim of this study is to examine the impact of adding a generic pain/discomfort dimension to a CSPBM for asthma and specifically to test whether the impact on health state values is additive. This is achieved by asking a general population sample to value a selection of health states defined by AQL-5D (an asthma-specific health state classification) or AQL-6D (AQL-5D plus pain/ discomfort dimension) using TTO. Coefficients for the 5 and 6 dimensional classifications are estimated and the coefficients of the
common dimensions are compared. The impact on health state values of using AQL-5D or AQL-6D is examined using data from a randomised controlled trial.
Methods
Measures of health-related quality of life: AQL-5D and AQL-6D
The study uses the AQL-5D, which is a 5-dimension 5-level preference-based measure for asthma (Yang et al, 2011; Young et al, 2011). The health state classification system was derived from the Asthma Quality of Life Questionnaire (AQLQ) (Juniper, Guyatt, Ferrie, & Griffith, 1993, 1999) using Rasch and conven-tional psychometric analysis (Young et al, 2011). The 5 dimensions are: concern about asthma, shortness of breath, weather and pollution stimuli, sleep impact and activity limitations. In the classification system each dimension has 5 levels of severity with level 1 denoting no problems and level 5 indicating extreme problems. All patient data with complete AQLQ information can be mapped onto the AQL-5D. The original valuation study selected 99 health states for valuation using a balanced design. States were then valued using the Measurement and Valuation of Health (MVH) study version of TTO, which includes a visual prop (Dolan, 1997; Gudex, 1994). The preference weights for all states defined by the classification model were estimated using a consistent main effects model estimated on mean health state values (Yang et al, 2011).
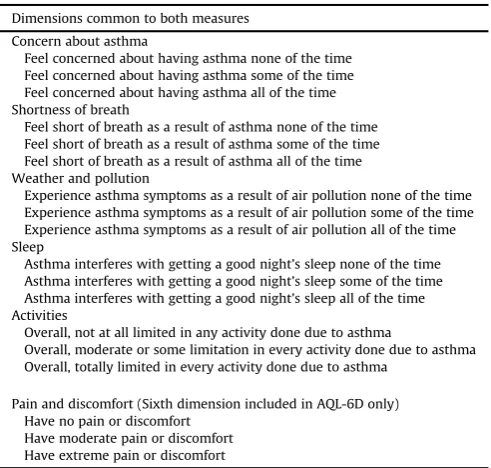
[image:3.595.302.548.507.741.2]In the study reported in this paper, a reduced AQL-5D health state classification system is valued where each dimension has 3 levels of severity: level 1 denoting no problems, level 2 denoting some problems and level 3 denoting extreme problems (see
Table 1). These relate to levels 1, 3 and 5 in the original classification system. The reduced classification was chosen primarily to limit the size of the valuation survey required to address the study aim. The selection of the 3 levels also makes sense because in the original valuation study level 2 was insignificant for all dimensions in the regression models estimating the preference weights for the clas-sification system. Level 4 was significant for all dimensions but there were inconsistencies between levels 4 and 5 for 2 dimensions
Table 1
AQL-5D and AQL-6D classification system (3 level version). Dimensions common to both measures
Concern about asthma
Feel concerned about having asthma none of the time Feel concerned about having asthma some of the time Feel concerned about having asthma all of the time Shortness of breath
Feel short of breath as a result of asthma none of the time Feel short of breath as a result of asthma some of the time Feel short of breath as a result of asthma all of the time Weather and pollution
Experience asthma symptoms as a result of air pollution none of the time Experience asthma symptoms as a result of air pollution some of the time Experience asthma symptoms as a result of air pollution all of the time Sleep
Asthma interferes with getting a good night’s sleep none of the time Asthma interferes with getting a good night’s sleep some of the time Asthma interferes with getting a good night’s sleep all of the time Activities
Overall, not at all limited in any activity done due to asthma
Overall, moderate or some limitation in every activity done due to asthma Overall, totally limited in every activity done due to asthma
Pain and discomfort (Sixth dimension included in AQL-6D only) Have no pain or discomfort
Have moderate pain or discomfort Have extreme pain or discomfort
J. Brazier et al. / Social Science & Medicine 73 (2011) 245e253
(shortness of breath and activity limitations) and for all dimensions the difference in coefficients between levels 4 and 5 was small.
The AQL-6D is a classification system consisting of the 5 dimensions of the reduced AQL-5D plus the pain/discomfort dimension from the EQ-5D added at the end, which also has 3 levels (Brooks, 1996(seeTable 1). This extra dimension was chosen to ensure little overlap and correlation with the existing dimen-sions whilst ensuring the additional dimension was able to capture potential co-morbidities and/or side-effects. One advantage of using a dimension from an existing measure is the availability of patient data including both measures (viz. AQLQ and EQ-5D), which enables us to test the impact of adding an additional dimension on health state values using a patient data set from a clinical trial.
Valuation survey
This study needs to be able to capture the impact on health state values of adding an additional dimension to the AQL-5D classifi -cation system, whilst removing the possibility that the observed impact is due to some other factor. Comparing health state values for AQL-6D with the AQL-5D values from the original study (Yang et al, 2011) is unsuitable as any observed differences could be caused by multiple factors, including different samples, different interviewers, the reduction in the number of levels and different techniques used to sample states for the valuation study. Therefore in order to minimise variation for any other reason both the AQL-5D and the AQL-6D were valued by two samples in the same valuation survey.
Selection of states
Health states for each measure were selected using an orthog-onal array in SPSS version 15. Sixteen health states were selected for AQL-5D, one of which was a repeated state (11111). Eighteen health states were selected for AQL-6D with no repeats. The worst state for each measure (33333 and 333333) was added, taking the number of unique health states to 16 for AQL-5D and 19 for AQL-6D. These included 4 health states that were‘matched’across the two descriptive systems in terms of the level of the non-pain dimen-sions: states 11111 and 1111111; 12132 and 121323; 23131 and 231311; 33333 and 333333. The digits indicate the level in each dimension, so the AQL-5D state 12132 is at level 1 in concern, level 2 in shortness of breath, level 1 in weather and pollution, level 3 in sleep and level 2 in activities. There is no mention of pain/ discomfort. The paired AQL-6D state is the same across these asthma-specific dimensions, but there is an explicit reference to pain at the end that in this case is at level 3.
Health states were divided into 3‘card blocs’of 8 states for each measure making 6 blocks or combinations of states in all. The worst state appeared in all card blocks and the remaining matched health states appeared in 2 card blocs to improve power. Other states repeated across more than one bloc for AQL-5D and AQL-6D were chosen to reflect a range of severity (using summed levels and dimensions) and levels for each dimension. Combinations of states within card blocs were chosen to reflect a range of severity (using summed levels and dimensions) and to ensure each card bloc included each level of each dimension. During the interviews, the health state cards were shuffled at the start of the rank and TTO tasks.
Interviewers were instructed to ensure each card bloc was valued equal times per geographical location and to work through the blocs in order with each interviewer starting from a different card bloc. Interviewers were asked to work through the card blocs in order 1 to 6: 1e3 were 5D and 4e6 were 6D. Different inter-viewers were asked to start with a different blocfirst and all blocs were used 3e4 times per geographical area.
Respondents
Members of the general population valued 8 health states from either AQL-5D or AQL-6D using time trade-off (TTO). The sampling for all households to be contacted in the study was undertaken using the AFD Names and Numbers version 3.1.25 database for South Yorkshire (AFD Software Limited, Ramsey, UK). This sample was balanced to the UK population according to geodemographic profiles.
Interview
All households in the sample were mailed the same information sheet and cover letter, each informing respondents that the inter-view was concerned with understanding‘what people think about the way asthma impacts on people’s lives’. Respondents were interviewed in their own home by trained interviewers who have previous experience working on valuation studies including the HUI2 (McCabe, Stevens, Roberts, & Brazier, 2005) and OAB-5D (Yang, Brazier, Tsuchiya, & Coyne, 2009). The interview began with respondents reading and self-completing both the EQ-5D and the AQL-5D, to familiarise themselves with each classification system. Respondents then undertook a warm-up rank task ranking 8 health states either in AQL-5D or in AQL-6D alongside 2 generic states‘full health’and‘dead’. Respondents then completed a prac-tise TTO question for a separate state followed by TTO questions valuing all 8 health states seen in the rank task. The protocol uses the York Measurement and Valuation of Health study version of TTO (Gudex, 1994) including the visual prop with generic full health (not instrument specific full health). At the end of the interview, respondents were asked to complete questions covering their demographic and socio-economic characteristics. All interviews were conducted from October 2009 to January 2010.
Analyses of preference data
TTO values were obtained using the conventional trans-formations for states better and worse than dead to ensure a potential range 1.0 to1.0 (Dolan, 1997). Three exclusion criteria were applied to the data to remove those respondents that do not appear to understand the task. Rrespondents were excluded from the analyses for valuing all states as identical, except in cases where all states are valued at one. Valuing all states as equal to one may not reflect a lack of understanding, but rather an unwillingness to trade life years for better health states. A second exclusion criterion was where respondents valued the worst possible health state higher than every other state. Finally respondents were excluded who valued all states as worse than dead.
The impact of adding pain/discomfort to AQL-5D was examined in three ways. Firstly, the mean values for the matched states were compared. Secondly, TTO values were modelled and the 5 asthma-specific coefficients were compared across AQL-5D and AQL-6D. Thirdly, the significance of the pain coefficients in the AQL-6D model was examined.
Comparisons of health state values
Mean health state values of the 4 matched health state pairs (e.g. 33333 and 333333) were compared using independent samples
t-tests.
Modelling
Given the limitations of the study design and sample size it was only possible to estimate additive models. The standard random effects specification is (Brazier, Roberts, & Deverill, 2002):
1yij
¼
a
þb
xiDd
zjþe
ij (1)wherei¼1,2,.,nrepresents health states andj¼1,2,.,m repre-sents respondents. The dependent variable 1yijis TTO disvalue,
whereyijis the TTO value for health stateivalued by respondentj,
xi is a vector of dummy explanatory variables for each level
l
ofdimension
d
of the health state classification where levell
¼1 acts as a baseline for each dimension, and zj is a vector of socio-demographic characteristics.e
ijis the error term, subdivided intoe
ij ¼ ujþeij, whereujis the individual random effect andeijis theusual random error term. This specification assumes a simple additive functional form. The data set is not designed to formally examine interactions within the AQL-5D, however we did exam-ined an ‘N30 dummy variable to pick-up possible interactions between the worst levels across the dimensions. It assumes a value of one when any dimension is at the worst level
TTO data is notoriously non-normal and associated with being skewed, censored at 1 and having more than one mode. The left skew in this data, whereby 25% of the values lie between 0.9 and 1, can be accounted for in a Tobit model with upper censoring, which treats the data as if they arise from a censored observation mech-anism through which observations with true values greater than one are observed as 1.
Model performance was assessed in terms of adjusted R squared (where available), the likelihood ratio and the size and significance of individual parameter estimates. Predictive ability was assessed by the individual level root mean square error (RMSE) and the mean absolute error at the state level (i.e. the difference between predicted and actual mean values at the state level). Plots were used to illustrate possible patterns of predicted errors. The only difference between the AQL-5D and AQL-6D models is the addition of an extra pain/discomfort dimension. The coefficients on the non-pain dimensions of the models were compared using thez-score test for each dimension, where an absolutez-score of 1.96 or more would indicate a significant difference at the 5% level.
Application of the valuation results to clinical trial data
To understand the practical implications of thefindings of this study the regression models for the AQL-5D and AQL-6D were applied to clinical trial data. If the impact of an additional pain/ discomfort dimension is entirely independent and additive, then health state scores of real asthma patients using AQL-6D will either be equal to or worse than the scores of the same patients using AQL-5D, since the additional information captured by AQL-6D is either neutral (no pain) or worse (moderate or extreme pain/ discomfort).
The COGENT study at the University of Newcastle was a before and after, cluster randomised controlled trial, the objective of which was to evaluate the use of computerised decision support (CDS) systems in implementing clinical guidelines for the primary care management of asthma in adults (Eccles et al., 2000). UK practises which used their computer systems intensively were eligible for the study. Asthma patients aged 18 and over who were registered with the participating practises were identified from a computerised search. Patient-reported outcome questionnaires, including generic measures EQ-5D and SF-36, as well as asthma-specific measures NASQ (the Newcastle Asthma Symptom Ques-tionnaire, Eccles et al. 2000) and AQLQ were administered in 3 rounds approximately 1 year apart. The analysis reported here uses round 1 data (n¼3059) but includes only observations with no
missing data across all items required to produce an AQL-6D score (n¼2791). The AQL-6D is constructed from the AQLQ and EQ-5D. Mean age of the sample is 48.07 years (s.d.¼17.60) and 60.01% are female. For further details of the study, seeEccles et al (2000). Values generated by the AQL-5D and AQL-6D will be compared in terms of mean scores for the whole sample and for sub-samples grouped by asthma symptom scores and pain/discomfort level.
The valuation data
The response rate for all eligible respondents answering their door at time of interview was 45.8%. Respondents were excluded from the analyses for valuing all states as identical and less than one; valuing the worst possible health state higher than every other state; or valuing all states as worse than dead. This resulted in the exclusion of just 2 respondents out of 184 successfully conducted interviews.
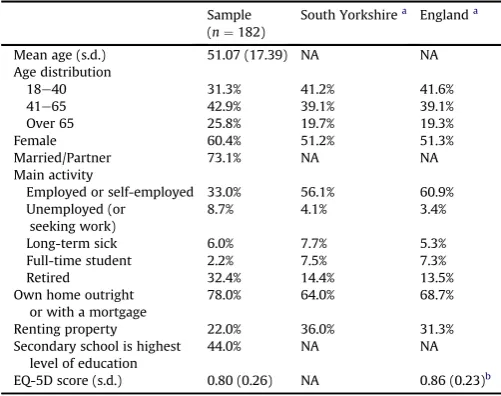
The characteristics of the respondents were comparable to those of South Yorkshire and the UK for age and gender, but tended to have a higher proportion of retired individuals, a lower proportion of employed individuals and a lower mean EQ-5D score (0.80 vs. 0.86) (Table 2). There were no significant differences between the samples who valued the AQL-5D and AQL-6D in terms of age, gender, employment, education and health (Table 3).
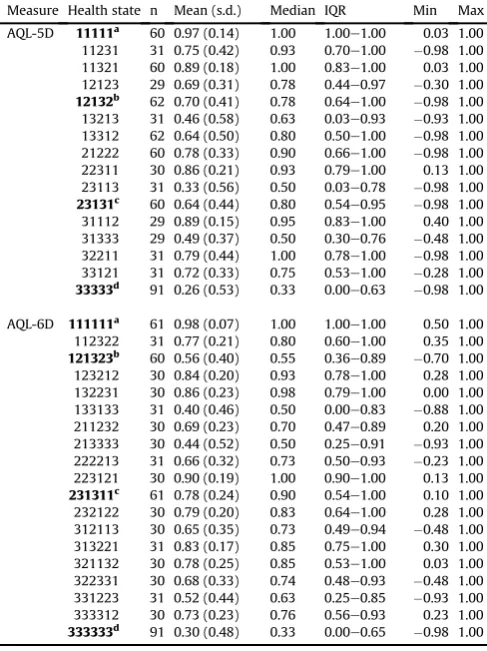
There were 1455 TTO values elicited from 180 respondents with 727 and 728 for the AQL-5D and the AQL-6D health states respec-tively. Descriptive statistics across the health states are presented in
Table 4. Three pairs of matched states were each valued between 60 and 62 times, the worst states (33333 and 333333) were valued 91 times each and the remaining states were valued between 29 and 31 times.
[image:5.595.301.552.485.683.2]Across all health states TTO values range from0.98 to 1.0, with 34.3% and 29.5% of observations having a value of 1.0 for ALQ-5D and AQL-6D respectively. Mean values for the 35 health states ranged from 0.26 to 0.98 and are generally lower than median values reflecting the negatively skewed distribution. Standard
Table 2
Respondent characteristics.
Sample (n¼182)
South Yorkshirea Englanda
Mean age (s.d.) 51.07 (17.39) NA NA Age distribution
18e40 31.3% 41.2% 41.6%
41e65 42.9% 39.1% 39.1%
Over 65 25.8% 19.7% 19.3%
Female 60.4% 51.2% 51.3%
Married/Partner 73.1% NA NA Main activity
Employed or self-employed 33.0% 56.1% 60.9% Unemployed (or
seeking work)
8.7% 4.1% 3.4%
Long-term sick 6.0% 7.7% 5.3% Full-time student 2.2% 7.5% 7.3%
Retired 32.4% 14.4% 13.5%
Own home outright or with a mortgage
78.0% 64.0% 68.7%
Renting property 22.0% 36.0% 31.3% Secondary school is highest
level of education
44.0% NA NA
EQ-5D score (s.d.) 0.80 (0.26) NA 0.86 (0.23)b
aStatistics for South Yorkshire Health Authority and for England in the Census
2001. Questions used in this study and the census are not identical. The census includes persons aged 16 and above whereas this study only surveys persons aged 18 and above. Age distribution is here reported as the percentage of all adults aged 18 and over.
b Interviews conducted in the Measurement and Valuation of Health (MVH) study
in 1993 (Gudex et al, 1994).
J. Brazier et al. / Social Science & Medicine 73 (2011) 245e253
deviations were quite high and ranged from 0.07 to 0.58 and are comparable to those found in the original valuation of the AQL-5D.
Results
Comparison of health state values
Across the 4 matched states, mean values for the best (0.97 vs. 0.98) and worst states (0.26 vs. 0.30) of AQL-5D and AQL-6D were not found to be significantly different (Table 4). The mean value of 12132 from the AQL-5D (0.70) was significantly higher than 121323 from AQL-6D (0.56) (p-value¼0.061). By way of contrast, the mean value for the AQL-5D state 23131 (0.64) was lower than the AQL-6D state 231311 (0.78) (p-value¼0.034).
Modelling of the preference data
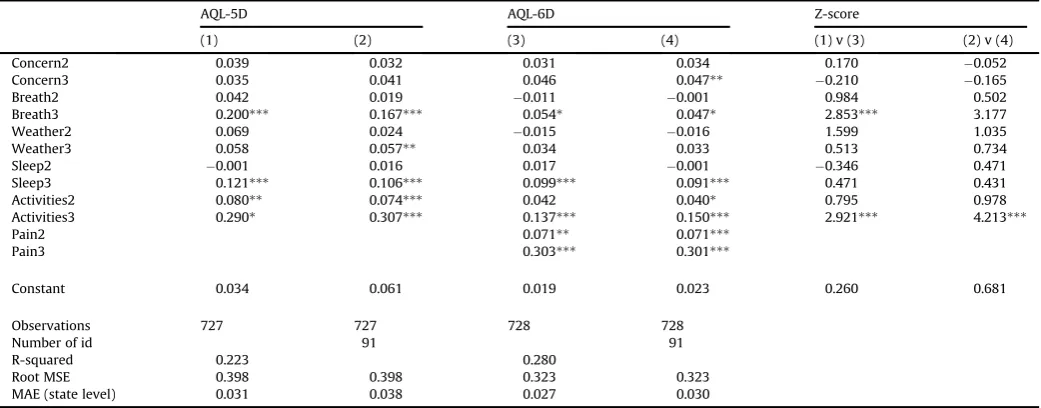
There are four models presented inTable 5: OLS (models (1) and (3)) and random effects models (models (2) and (4)) for the AQL-5D and AQL-6D descriptive systems. The OLS and random effects models are quite similar, so the remaining presentation focuses on the latter.
For AQL-5D model (2) the coefficients across the 5 dimensions are consistent with the severity levels within each dimension i.e. coefficients for level 3>level 2>level 1. The only exception is the sleep dimension, where the level 2 coefficient has the‘wrong’sign though it is very small and non-significant. Level 3 of breath, weather and sleep are significant as are levels 2 and 3 for activities. The RMSE at the individual level is quite high at 0.398, but the MAE at the state level is only 0.038 and this compares very favourably with that achieved in the original model of 0.047 (Yang et al, 2011). The plot of observed and predicted mean health state TTO values and residuals ordered by mean observed value suggests there is no obvious pattern in the errors (Fig. 1). The N3 term was not signifi -cant in any model.
For AQL-6D the pain/discomfort dimension had significant coefficients for levels 2 and 3 at the 5% level, with level 3 pain/ discomfort having the largest coefficient (0.301) of any dimension in the AQL-6D for model (4). There were 3 inconsistencies with levels 2 of breath (0.001), weather (0.016), and sleep (0.001) being negative, but these are all below 0.02 and none were significant. Overall the model performed well in terms of MAE (0.030 vs. 0.038 for AQL-5D) at the state level and again there is no obvious pattern in the errors. There was little change to the coef-ficients for concern and sleep compared to the AQL-5D model, but a noticeable reduction in the coefficient for level 3 of weather (which was significant in the AQL-5D model at the 5% level but non-significant in the AQL-6D model). However, there were substantial reductions in the coefficients for shortness of breath and activities, particularly for the level 3 coefficients of 0.167 vs. 0.047 and 0.307 vs. 0.150 for the AQL-5D and AQL-6D models respectively. The results of thez-tests confirm that there were significant differences between the AQL-5D and AQL-6D models in the coefficients of level 3 for shortness of breath and activities at the 1% level.
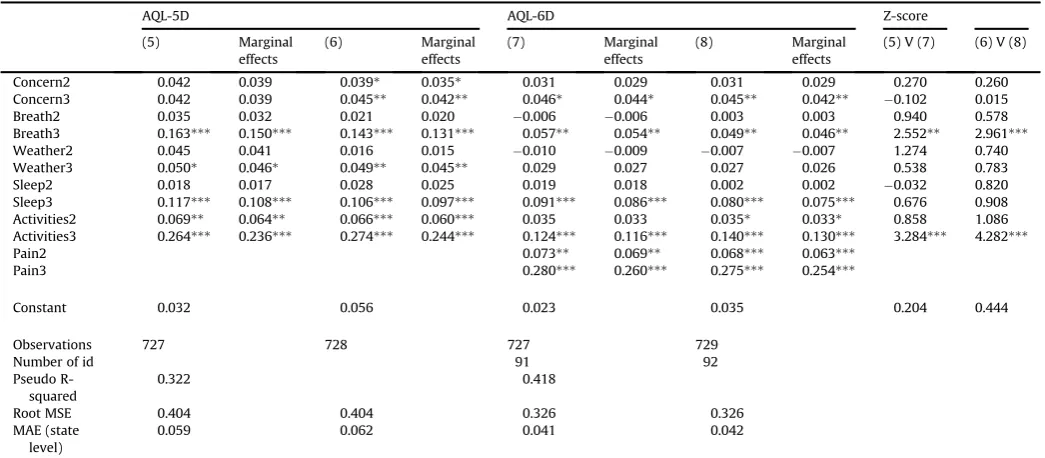
[image:6.595.43.294.83.334.2]The marginal results for the Tobit model are reported inTable 6. They are entirely consistent for the AQL-5D with RE (model (6)) and there is only one inconsistency, namely one very small negative value (weather level 2) for AQL-6D in model (8). The Tobit models performance is slightly lower than the other models in terms of RMSE and MAE. The Tobit models, however, show the same key results: the levels for the add-on pain/discomfort dimension have significant coefficients; the coefficients for pain/discomfort at level 3 are the largest across all dimensions; in comparison to the AQL-5D models there are substantial and significant reductions in the level 3 coefficients for shortness of breath and activities.
Table 3
Respondent characteristics for AQL-5D and AQL-6D. AQL-5D (n¼91)
AQL-6D (n¼91)
P-valuea
Mean age (s.d.) 52.13 (17.54) 50.01 (17.27) 0.412b
Age distribution
18e40 27.5% 35.2% 0.263
41e65 46.2% 39.6% 0.369
Over 65 26.4% 25.3% 0.866
Female 61.5% 59.3% 0.762
Married/partner 70.3% 75.8% 0.403 Main activity
Employed or self-employed 30.8% 35.2% 0.528 Unemployed (or seeking work) 11.0% 6.6% 0.295 Long-term sick 3.3% 8.8% 0.120 Full-time student 3.3% 1.1% 0.310c
Housework 9.9% 15.4% 0.265
Retired 36.3% 28.6% 0.268
Own home outright or with a mortgage 76.9% 79.1% 0.720 Renting property 23.1% 20.9%
Secondary school is highest level of education
46.2% 41.8% 0.550
Doubtful whether respondent understood TTO
(interviewer reported)
2.2% 1.1%
Have asthma 25.3% 23.1% 0.729 Have moderate pain or discomfort 39.6% 30.8% 0.214 Have extreme pain or discomfort 4.4% 8.8% 0.232 EQ-5D score (s.d.) 0.79 (0.25) 0.80 (0.28) 0.850b
Time taken 31.85 (8.24) 31.62 (8.89) 0.856b
aPearson Chi-squarep-value. b ANOVAp-value.
c Fisher’s exact testp-value (2-sided) as the expected frequency is 5 or lower.
Table 4
Health state values for AQL-5D and AQL-6D.
Measure Health state n Mean (s.d.) Median IQR Min Max AQL-5D 11111a 60 0.97 (0.14) 1.00 1.00e1.00 0.03 1.00
11231 31 0.75 (0.42) 0.93 0.70e1.00 0.98 1.00 11321 60 0.89 (0.18) 1.00 0.83e1.00 0.03 1.00 12123 29 0.69 (0.31) 0.78 0.44e0.97 0.30 1.00
12132b 62 0.70 (0.41) 0.78 0.64e1.00 0.98 1.00
13213 31 0.46 (0.58) 0.63 0.03e0.93 0.93 1.00 13312 62 0.64 (0.50) 0.80 0.50e1.00 0.98 1.00 21222 60 0.78 (0.33) 0.90 0.66e1.00 0.98 1.00 22311 30 0.86 (0.21) 0.93 0.79e1.00 0.13 1.00 23113 31 0.33 (0.56) 0.50 0.03e0.78 0.98 1.00
23131c 60 0.64 (0.44) 0.80 0.54e0.95 0.98 1.00
31112 29 0.89 (0.15) 0.95 0.83e1.00 0.40 1.00 31333 29 0.49 (0.37) 0.50 0.30e0.76 0.48 1.00 32211 31 0.79 (0.44) 1.00 0.78e1.00 0.98 1.00 33121 31 0.72 (0.33) 0.75 0.53e1.00 0.28 1.00
33333d 91 0.26 (0.53) 0.33 0.00e0.63 0.98 1.00
AQL-6D 111111a 61 0.98 (0.07) 1.00 1.00e1.00 0.50 1.00
112322 31 0.77 (0.21) 0.80 0.60e1.00 0.35 1.00
121323b 60 0.56 (0.40) 0.55 0.36e0.89 0.70 1.00
123212 30 0.84 (0.20) 0.93 0.78e1.00 0.28 1.00 132231 30 0.86 (0.23) 0.98 0.79e1.00 0.00 1.00 133133 31 0.40 (0.46) 0.50 0.00e0.83 0.88 1.00 211232 30 0.69 (0.23) 0.70 0.47e0.89 0.20 1.00 213333 30 0.44 (0.52) 0.50 0.25e0.91 0.93 1.00 222213 31 0.66 (0.32) 0.73 0.50e0.93 0.23 1.00 223121 30 0.90 (0.19) 1.00 0.90e1.00 0.13 1.00
231311c 61 0.78 (0.24) 0.90 0.54e1.00 0.10 1.00
232122 30 0.79 (0.20) 0.83 0.64e1.00 0.28 1.00 312113 30 0.65 (0.35) 0.73 0.49e0.94 0.48 1.00 313221 31 0.83 (0.17) 0.85 0.75e1.00 0.30 1.00 321132 30 0.78 (0.25) 0.85 0.53e1.00 0.03 1.00 322331 30 0.68 (0.33) 0.74 0.48e0.93 0.48 1.00 331223 31 0.52 (0.44) 0.63 0.25e0.85 0.93 1.00 333312 30 0.73 (0.23) 0.76 0.56e0.93 0.23 1.00
333333d 91 0.30 (0.48) 0.33 0.00e0.65 0.98 1.00
Notes: Matched health states (those with 5 shared dimensions) across both studies are in bold. Results of independentt-test comparing matched states: a.p¼0.492, b.
[image:6.595.45.289.393.719.2]Application to clinical trial data
Models (2) and (4) inTable 5have been applied to the COGENT trial data set using patient level completed AQLQ and EQ-5D data (Table 7). AQL-5D is derived from the AQLQ data and AQL-6D also uses the pain/discomfort dimension of the EQ-5D. Mean health state values produced using the AQL-5D are typically lower than the values produced using the AQL-6D by 0.1. The AQL-5D value is consistently lower than the AQL-6D value across the 5 asthma symptom severity groups, with the most severe asthma group having the largest difference.
To better understand the impact of the pain/discomfort dimension, the data set was divided into those reporting extreme, moderate and no pain using the EQ-5D pain/discomfort dimension. Except for the extreme pain/discomfort group, mean AQL-5D scores continue to be lower than mean AQL-6D scores, regardless of asthma symptom severity. For those with extreme pain/discomfort, AQL-5D scores are higher. Amongst this group, milder asthma symptoms are associated with larger differences between the AQL-5D and AQL-6D scores, but the 2 instruments result in very similar values for those with very severe asthma symptoms and extreme
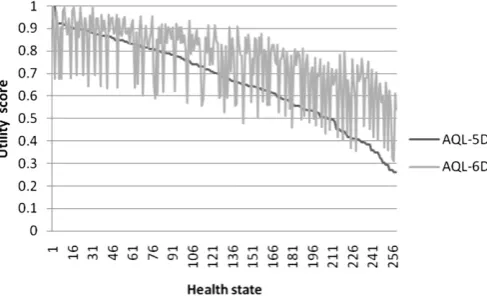
pain/discomfort. However, the numbers are low for some of the groups since only 6% of the sample report extreme pain/discomfort. The general pattern of AQL-6D exceeding AQL-5D is reflected in
Fig. 2, where the predictions are ordered by AQL-5D health state value.
Discussion
The health economics literature has tended to focus on the issues surrounding the valuation of health states, such as which valuation technique and whose values, rather than the role of the descriptive system. This study shows quite clearly that the content of the health state classification plays an enormous role in deter-mining the values that are generated. The addition of the pain/ discomfort dimension generated not only significant coefficients in its own right, but also had a significant impact on the coefficients of other dimensions. The adding-on of pain/discomfort was not simply additive in its impact on health state values.
[image:7.595.33.554.85.289.2]Some degree of preference interaction has been shown to exist in a number of generic preference-based measures. For the HUI2 and HUI3 measures, a constant‘k’term was included in a multi-plicative function that is consistent with preference complemen-tarity (Feeny, Furlong, Torrance, & et al, 2002). For exposition purposes, imagine a set of health states where all other dimensions are at the best level, then preference complementarity is where the sum of the disutility associated with being in the bottom level of one dimension (say pain) and the disutility with being at the bottom of another dimension (say mobility) is less than the disutility associated with being at the bottom of these two dimensions together (Feeny, 2002). Evidence against a simple linear addition of main effects was also found in the significance of the additive‘N3’term for the EQ-5D and‘MOST’term for the SF-6D, which provided extra disutility where one of the dimensions was at its worse level, though these are not interaction terms in them-selves (Brazier et al., 2002; Dolan, 1997). However, our study shows that the impact of the additional dimension for pain/discomfort is not consistent across dimensions and that a simple additive adjustment such as the N3 component of the UK EQ-5D value set or a constant multiplicative term as used for the Canadian valuation of the HUI2 and HUI3 would not adequately capture the effect of Table 5
Regression analysis estimating values sets for AQL-5D and AQL-6D.
AQL-5D AQL-6D Z-score
(1) (2) (3) (4) (1) v (3) (2) v (4)
Concern2 0.039 0.032 0.031 0.034 0.170 0.052
Concern3 0.035 0.041 0.046 0.047** 0.210 0.165
Breath2 0.042 0.019 0.011 0.001 0.984 0.502
Breath3 0.200*** 0.167*** 0.054* 0.047* 2.853*** 3.177
Weather2 0.069 0.024 0.015 0.016 1.599 1.035
Weather3 0.058 0.057** 0.034 0.033 0.513 0.734
Sleep2 0.001 0.016 0.017 0.001 0.346 0.471
Sleep3 0.121*** 0.106*** 0.099*** 0.091*** 0.471 0.431
Activities2 0.080** 0.074*** 0.042 0.040* 0.795 0.978
Activities3 0.290* 0.307*** 0.137*** 0.150*** 2.921*** 4.213***
Pain2 0.071** 0.071***
Pain3 0.303*** 0.301***
Constant 0.034 0.061 0.019 0.023 0.260 0.681
Observations 727 727 728 728
Number of id 91 91
R-squared 0.223 0.280
Root MSE 0.398 0.398 0.323 0.323
MAE (state level) 0.031 0.038 0.027 0.030
[image:7.595.38.282.567.728.2]Notes:*significant at 10%;**significant at 5%;***significant at 1%.
Fig. 1.Observed and predicted values for AQL-5D model (2).
J. Brazier et al. / Social Science & Medicine 73 (2011) 245e253
adding pain/discomfort. This has important implications for the use of measures, condition-specific or generic, that exclude important dimensions.
Another important result has been the way that adding a pain/ discomfort dimension to the descriptive system has increased the value of the health state of most asthma patients in the COGENT trial except for those 6% with extreme pain/discomfort. This is also reflected in the results for the matched pairs where adding pain/ discomfort at level 3 to 12132 reduces the values, as might be expected, but adding pain/discomfort at level 1e23131 has signif-icantly increased the health state value. There was a similarfinding in a study adding an additional sleep dimension to EQ-5D, where adding sleep level 1 to one of the two states significantly increased the mean health state value (0.179e0.486), though it did not alter the value of any other matched EQ-5D states (Yang et al, 2008). AQL-6D values even exceed those for AQL-5D in those with level 2 pain/discomfort in the COGENT study.
These apparently paradoxical results can be explained in a number of different ways. At least some respondents valuing the AQL-5D state may assume that the state being valued may involve pain/discomfort compared to respondents valuing the AQL-6D being told the state does not involve pain/discomfort. The ambi-guity lies in the word discomfort and what has been read into this word by respondents. This may explain why AQL-5D scores are
lower than AQL-6D scores for corresponding states with no pain/ discomfort. In order to explain why AQL-5D scores are still lower than AQL-6D scores with moderate pain/discomfort, the magnitude of the unmentioned but imagined pain/discomfort needs to be quite substantial. Another explanation is that respondents may focus on one dominant dimension as part of a heuristic to simplify the task. For 5D this is breathlessness or activities and for AQL-6D this for many may become pain/discomfort. This is related to the focussing effect mentioned earlier where respondents exaggerate the importance of asthma related problems, but the addition of the pain/discomfort dimension with no problems helps put those asthma problems into perspective and so they become less important (as reflected in the lower weights). Finally, there may be a simple explanation based on a simple heuristic, such as counting the number of level 1s and so adding level 1 pain/discomfort makes the state look better. Addressing these types of questions is better probed using more in-depth methods, such as cognitive de-briefing. Whatever the explanation, these all raise serious concerns about missing dimensions from any health state descriptive system.
[image:8.595.42.565.84.313.2]There are a number of weaknesses to take into account with this study. Firstly, it was only possible to design a study to estimate additive functional forms similar to those that already exist for the EQ-5D. It would have been desirable to have estimated more Table 6
Tobit regression analysis estimating values sets for AQL-5D and AQL-6D.
AQL-5D AQL-6D Z-score
(5) Marginal effects
(6) Marginal effects
(7) Marginal effects
(8) Marginal effects
(5) V (7) (6) V (8)
Concern2 0.042 0.039 0.039* 0.035* 0.031 0.029 0.031 0.029 0.270 0.260 Concern3 0.042 0.039 0.045** 0.042** 0.046* 0.044* 0.045** 0.042** 0.102 0.015 Breath2 0.035 0.032 0.021 0.020 0.006 0.006 0.003 0.003 0.940 0.578 Breath3 0.163*** 0.150*** 0.143*** 0.131*** 0.057** 0.054** 0.049** 0.046** 2.552** 2.961***
Weather2 0.045 0.041 0.016 0.015 0.010 0.009 0.007 0.007 1.274 0.740 Weather3 0.050* 0.046* 0.049** 0.045** 0.029 0.027 0.027 0.026 0.538 0.783 Sleep2 0.018 0.017 0.028 0.025 0.019 0.018 0.002 0.002 0.032 0.820 Sleep3 0.117*** 0.108*** 0.106*** 0.097*** 0.091*** 0.086*** 0.080*** 0.075*** 0.676 0.908 Activities2 0.069** 0.064** 0.066*** 0.060*** 0.035 0.033 0.035* 0.033* 0.858 1.086 Activities3 0.264*** 0.236*** 0.274*** 0.244*** 0.124*** 0.116*** 0.140*** 0.130*** 3.284*** 4.282***
Pain2 0.073** 0.069** 0.068*** 0.063***
Pain3 0.280*** 0.260*** 0.275*** 0.254***
Constant 0.032 0.056 0.023 0.035 0.204 0.444
Observations 727 728 727 729
Number of id 91 92
Pseudo R-squared
0.322 0.418
Root MSE 0.404 0.404 0.326 0.326
MAE (state level)
0.059 0.062 0.041 0.042
Notes:*significant at 10%;**significant at 5%;***significant at 1%.
Table 7
Application of AQL-5D and AQL-6D to a patient data set (n¼2791).
All patients No pain/discomfort in EQ-5D Moderate pain/discomfort in EQ-5D
Extreme pain/discomfort in EQ-5D
AQL-5D AQL-6D AQL-5D AQL-6D AQL-5D AQL-6D AQL-5D AQL-6D Mean (s.d.) Mean (s.d.) n Mean (s.d.) Mean (s.d.) n Mean (s.d.) Mean (s.d.) n Mean (s.d.) Mean (s.d.) n All patients 0.733 (0.188) 0.833 (0.144) 2791 0.817 (0.119) 0.930 (0.060) 1245 0.677 (0.198) 0.787 (0.108) 1373 0.563 (0.226) 0.495 (0.126) 173 Asthma symptoms score
0<NASSa20 (least severe) 0.884 (0.087) 0.933 (0.069) 625 0.892 (0.089) 0.962 (0.040) 446 0.864 (0.083) 0.878 (0.035) 164 0.871 (0.071) 0.649 (0.025) 15
20<NASS40 0.808 (0.083) 0.893 (0.072) 528 0.817 (0.078) 0.933 (0.043) 302 0.795 (0.088) 0.853 (0.045) 214 0.803 (0.065) 0.621 (0.041) 12 40<NASS60 0.759 (0.114) 0.859 (0.090) 583 0.781 (0.093) 0.915 (0.052) 267 0.742 (0.128) 0.828 (0.065) 295 0.721 (0.137) 0.589 (0.078) 21 60<NASS80 0.697 (0.149) 0.805 (0.122) 478 0.743 (0.122) 0.897 (0.067) 155 0.680 (0.156) 0.791 (0.086) 285 0.637 (0.155) 0.538 (0.087) 38 80<NASS100 (most severe) 0.489 (0.189) 0.655 (0.157) 539 0.624 (0.155) 0.831 (0.091) 64 0.486 (0.187) 0.681 (0.106) 389 0.401 (0.163) 0.407 (0.099) 86
[image:8.595.41.563.621.733.2]complex functional forms such as multiplicative or multi-linear functional (Keeney and Raiffa, 1993). This was a consequence of funding limitations, but it was adequate for answering the primary question of whether adding a dimension to a descriptive system impacted on the size of the coefficients associated with other dimensions (including significant changes), though probably not for generating results for a new extended CSPBM. Secondly, the MVH TTO protocol can be criticised for using a 10 year time frame that is unrealistic in younger populations. It was selected due the evidence on its reliability in the general population and given this is a methodological study, it should not have any major implications for thefindings of the study. Thirdly, the subject of the study has been one condition-specific instrument and this may limit the generalisability of the results to other CSPBMs or perhaps more importantly for policy makers, to generic preference-based measures. The results will be specific to asthma and the addition of pain/discomfort in particular, but CSPBMs by definition tend to exclude many common and important domains and so the general issue addressed by this study is relevant. Even generic measures exclude potentially important dimensions such as cognition and energy in the EQ-5D. However, whether other dimensions would have such a strong impact as pain/discomfort remains to be seen.
This study has found that adding a common and generic dimension to a CSPBM has an impact on the decrements associated with the dimensions specific to the condition. Comparability between measures (condition-specific or generic), requires among other things that the impact of different dimensions on preferences is additive, whether or not they are included in the classification system. Our results cast doubt on this assumption for important dimensions like pain/discomfort.
Acknowledgements
This study was funded by MRC-NIHR Methodology Research Programme, project number 06/97/04. Ethics approval was obtained from the University of Sheffield Research Ethics Committee. We would like to thank Rachel Ibbotson and her colleagues at Sheffield Hallam University for undertaking the general population survey. We are grateful to the survey respon-dents. The usual disclaimers apply.
References
Barton, G. R., Bankart, J., & Davis, A. C. (2004). Summerfield QA. comparing utility scores before and after hearing-aid provision. Applied Health Economics & Health Policy, 3(2), 103e105.
Brazier, J. E., Roberts, J., & Deverill, M. (2002). The estimation of a preference based measure of health from the SF-36.Journal of Health Economics, 21(2), 271e292.
Brazier, J. E., Ratcliffe, J., Tsuchiya, A., & Solomon, J. A. (2007).Measuring and valuing health for economic evaluation. Oxford: Oxford University Press.
Brazier, J. E., Czoski-Murray, C., Roberts, J., Brown, M., Symonds, T., & Kelleher, C. (2008). Estimation of a preference-based index from a condition specific measure: the King’s Health Questionnaire. Medical Decision Making, 28(1), 113e126.
Brazier, J., & Tsuchiya, A. (2010). Preference-based condition specific measures of health: what happens to cross programme comparability.Health Economics, 19(2), 125e129.
Brooks, R., & , EuroQol Group. (1996).EuroQol: the Current State of Play Health Policy, 37, 53e72.
Dolan, P. (1997). Modelling valuations for EuroQol health states.Medical Care, 35(11), 1095e1108.
Dowie, J. (2002). Decision validity should determine whether generic or condition-specific HRQOL measure is used in health care decisions.Health Economics, 11, 1e8.
Eccles, M., Grimshaw, J., Steen, N., Parkin, D., Purves, I., McColl, E., et al. (2000). The design and analysis of a randomized controlled trial to evaluate computerized decision support in primary care: the COGENT study.Family Practice, 17(2), 180e186.
Espallargues, M., Czoski-Murray, C., Bansback, N., Carlton, J., Lewis, G., Hughes, L., et al. (2005). The impact of Age Related Macular Degeneration on health state utility values.Investigative Ophthalmology and Visual Science, 46, 4016e4023.
Feeny, D., Furlong, W., Torrance, G. W., et al. (2002). Multiattribute and single-attribute utility functions for the health utilities index mark 3 system.
Medical Care, 40, 113e128.
Feeny, D. (2002). The utility approach to assessing population health. In C. Murray, J. Salomon, C. Mathers, & A. Lopez (Eds.),Summary measures of population health: concepts, ethics, measurement and applications. Geneva: WHO. Gold, M. R., Siegel, J. E., Russell, L. B., & Weinstein, M. C. (1996).Cost-effectiveness in
health and medicine. Oxford: Oxford University Press.
Gudex, C. (1994).Time trade-off User Manual: Props and self-Completion methods. University of York: Centre for Health Economics.
Haywood, K. L., Garratt, A. M., Lall, R., Smith, J. F., & Lamb, S. E. (2008). EuroQol EQ-5D and condition-specific measures of health outcome in women with urinary incontinence: reliability, validity and responsiveness.Quality of Life Research, 17, 475e483.
Juniper, E. F., Guyatt, G. H., Ferrie, P. J., & Griffith, L. E. (1993). Measuring quality of life in asthma.American Review of Respiratory Disease, 147, 832e838. Juniper, E. F., Buist, A. S., Cox, F. M., Ferrie, P. J., & King, D. R. (1999). Validation of
a standardized version of the asthma quality of life questionnaire.Chest, 115(5), 1265e1270.
Keeney, R. L., & Raiffa, H. (1993).Decisions with multiple objectives: preferences and value trade-offs. Cambridge: Cambridge University Press.
Kok, E. T., McDonnell, J., et al. (2002). The valuation of the International Prostate Symptom Score (IPSS) for the use in economic evaluations.European Urology, 42, 491e497.
Krabbe, F. M., Marlies, E. A., Stouthard, et al.. (1999). The effect of adding a cognitive dimension to the EuroQol multiattribute health-status classification system.
Journal of Clinical Epidemiology, 52(4), 293e301.
McCabe, C., Stevens, K., Roberts, J., & Brazier, J. (2005). Health state values for the HUI 2 descriptive system: results from a UK survey.Health Economics, 14(3), 231e244.
Moock, J., & Kohlmann, T. (2008). Comparing preference-based quality-of-life measures: results from rehabilitation patients with musculoskeletal, cardiovascular, or psychosomatic disorders.Quality of Life Research., 17(3), 485e495.
National Institute for Health and Clinical Excellence. (2008).Guide to the methods of technology appraisal. London: NICE.
Ratcliffe, J., Brazier, J., Tsuchiya, A., et al. (2009). Using DCE and ranking data to estimate cardinal values for health states for deriving a preference-based single index from the sexual quality of life questionnaire. Health Economics, 18, 1261e1276.
Revicki, D. A., Leidy, N. K., Brennan-Diemer, F., Sorenson, S., & Togias, A. (1998). Intergrating patients preferences into health outcomes assessment: the mul-tiattribute asthma symptom utility index.Chest, 114(4), 998e1007.
Revicki, D. A., Leidy, N. K., Brennan-Diemer, F., Thomson, C., & Togias, A. (1998). Development and preliminary validation of multi-attribute rhinitis symptom utility index.Chest, 114, 693e702.
Stevens, K., Brazier, J. E., McKenna, S. P., Doward, L. C., & Cork, M. (2005). The development of a preference-based measure of health in children with atopic dermatitis.British Journal of Dermatology, 153, 372e377.
Torrance, G. W., Keresteci, M. A., Casey, R. W., Rosner, A. J., Ryan, N., & Breton, M. C. (2004). Development and initial validation of a new preference-based disease-specific health-related quality of life instrument for erectile function.Quality of Life Research, 13(2), 349e359.
Walters, S. J., Morrell, C. J., & Dixon, S. (1999). Measuring health-related quality of life in patients with venous leg ulcers.Quality of Life Research, 8, 327e336. Yang, Y., Brazier, J. E., Tsuchiya, A., & Coyne, K. (2009). Estimating a preference-based
[image:9.595.37.281.67.217.2]index from the Over Active Bladder questionnaire. Value in Health, 12(1), 159e166.
Fig. 2.AQL-5D and AQL-6D by health state (n¼260 for AQL-6D) in patient data set.
J. Brazier et al. / Social Science & Medicine 73 (2011) 245e253
Yang, Y., Brazier, J. E., Tsuchiya, A., & Young, T. (2011). Estimating a preference-based index for a 5-dimensional health state classification (AQL-5D) for asthma derived from the Asthma Quality of Life Questionnaire (AQLQ).Medical Decision Making, 31(2), 281e291.
Yang, Y., Brazier, J., & Tsuchiya, A. (January 2008).The effect of adding a sleep dimension to the EQ-5D. Paper presented to the HESG meeting. University of East Anglia.
Young, T., Yang, Y., Brazier, J., Tsuchiya, A., & Coyne, K. (2009). Thefirst stage of developing preference-based measures: constructing a health-state classifi ca-tion using Rasch analysis.Quality of Life Research, 18, 253e265.