R E S E A R C H A R T I C L E
Open Access
Factors related to breast cancer detection
mode and time to diagnosis in Alberta,
Canada: a population-based retrospective
cohort study
Yan Yuan
1, Maoji Li
1, Jing Yang
2, Tracy Elliot
3, Kelly Dabbs
4, James A. Dickinson
5, Stacey Fisher
1and Marcy Winget
6*Abstract
Background:Understanding the factors affecting the mode and timeliness of breast cancer diagnosis is important to optimizing patient experiences and outcomes. The purposes of the study were to identify factors related to the length of the diagnostic interval and assess how they vary by mode of diagnosis: screen or symptom detection.
Methods: All female residents of Alberta diagnosed with first primary breast cancer in years 2004–2010 were identified from the Alberta Cancer Registry. Data were linked to Physician Claims and screening program databases. Screen-detected patients were identified as having a screening mammogram within 6-months prior to diagnosis; remaining patients were considered symptom-detected. Separate quantile regression was conducted for each detection mode to assess the relationship between demographic/clinical and healthcare factors.
Results: Overall, 38 % of the 12,373 breast cancer cases were screen-detected compared to 47 % of the screen-eligible population. Health region of residence was strongly associated with cancer detection mode. The median diagnostic interval for screen and symptom-detected cancers was 19 and 21 days, respectively. The variation by health region, however, was large ranging from an estimated median of 4 to 37 days for screen-detected patients and from 17 to 33 days for symptom-detected patients. Cancer stage was inversely associated with the diagnostic interval for symptom-detected cancers, but not for screen-detected cancers. Conclusion: Significant variation by health region in both the percentage of women with screen-detected cancer and the length of the diagnostic interval for screen and symptom-detected breast cancers suggests there could be important differences in local breast cancer diagnostic care coordination.
Keywords: Breast cancer diagnosis, Population study, Diagnostic interval, Administrative data
* Correspondence:mwinget@stanford.edu
6Divison of General Medical Disciplines, Stanford University School of Medicine, Stanford, CA 94305, USA
Full list of author information is available at the end of the article
Background
Breast cancer is the most commonly diagnosed cancer among Canadian women and the second most common cause of their cancer death [1]. Prognosis is best when diagnosed and treated at an early stage; timely diagnosis and early detection are, therefore, critical to optimizing survival. In Canada, early detection is facilitated by guide-line recommendation of routine screening for breast can-cer with mammography for average risk women aged 50 to 69 every 2 years; also, the Canadian Association of Ra-diologists recommends that women between 40 and 49 also be screened annually [2, 3]. Similar recommendations and breast cancer screening programs exist in most devel-oped countries, as screening has been shown to reduce mortality by 20 to 30 % [4–6].
Regardless of the mode of detection, timely diagnostic resolution following detection of breast abnormalities is important. Delayed resolution is associated with larger tumors, locally advanced or metastatic cancer, higher re-currence rates, lower 5-year survival rates, and increased patient anxiety [7–9]. Diagnostic delays of three months or more in symptom-detected breast cancer are associ-ated with a 12 % lower 5-year survival compared to those with shorter delays [10]. Delayed resolution of false positive screening mammograms has also been as-sociated with decreased participation in subsequent screening [11]. Given the public health impact of breast cancer and the value of early detection and timely diag-nosis, it is important to understand factors related to timely breast cancer diagnosis and the relationship be-tween mode of diagnosis and diagnostic interval to optimize the patient care experience and, ultimately, sur-vival of breast cancer patients.
Here we investigate mode of detection and time to breast cancer diagnosis in Alberta, Canada and report findings on 1) the proportion of screen vs. symptom-detected breast cancers, 2) time to diagnosis by mode of detection and 3) identify patient demographic, clinical and healthcare system factors related to mode of detec-tion and time to diagnosis.
Methods
Study population
A retrospective breast cancer cohort of female residents of Alberta, who were diagnosed with a histologically confirmed first-ever primary breast cancer (International Classification of Disease for Oncology (ICD-O) 3rd edi-tion code C50 behaviors 2 and 3 [12]) in years 2004 to 2010, was identified from the Alberta Cancer Registry, a population based cancer registry recognized for data completeness by the North American Association of Central Cancer Registries. All patients were included un-less data to calculate outcome measures, as defined below, were missing.
During the study period, the province of Alberta had a population of about 3 to 3.5 million spread over
662,000 km2[13]. Approximately 56 % of the total
popu-lation live within the two urban regions, 27 % live in small and medium regional cities, and roughly 17 % live in rural and remote areas [14]. Alberta has a publicly-funded provincially operated single-payer health care system, in which all residents have free access to stand-ard medical care. The majority of physicians are remu-nerated via fee-for-service. Typically women are referred for mammography by their primary care physician (PCP) but screen-eligible patients can self-refer.
Data sources and variables
The following patient characteristics were obtained from the Alberta Cancer Registry: age, postal code of resi-dence, regional health authority (RHA) of resiresi-dence, disease stage, histologic grade and date of diagnosis. Dis-ease stage was based on the American Joint Committee on Cancer staging [15]. Histology grade was based on the ICD-O morphology grade that represents the degree of differentiation of the tumor.
The postal codes of patients were used to obtain neighbourhood-level variables developed by Statistics Canada. Specifically, neighbourhood income level (in quintiles, QAIPPE) and an urban/rural variable (CSIZE-MIZ) were obtained by linking patient postal codes to the 2006 Canadian Census Data [16]. The latter variable is defined by categorizing communities with populations less than 10,000 that have no influence from larger cities as rural and all other communities as urban.
International Classification of Disease, Tenth Revision, Clinical Modification [ICD-10-CM] diagnosis codes from three provincial administrative health care databases were used to calculate the Charlson Comorbidity Index: 1) the Ambulatory Care Classification System, all outpatient visits to hospitals in the province; 2) the Discharge Abstract Database, all inpatient hospital admissions in the province, and 3) the Physician Claims Database, all fee-for-service physician visits. All relevant codes in the period 30 months prior to breast cancer diagnosis were used to calculate the modified Charlson Comorbidity Index, [17, 18]. Codes for primary or metastatic cancer were excluded from calculations.
Patients with less than three PCP visits in the period were classified as having“minimum PCP visits”.
The databases and datasets used in the study are not publicly available. The Alberta Cancer Registry data were made available upon ethics approval. The provincial ad-ministrative databases are governed by Alberta Health Services (AHS) via permission from the provincial min-istry, Alberta Health (AH). AHS provided the provincial administrative data required for the study after reviewing the study protocol, receiving a signed confidentiality agreement (from MW) and receiving proof of ethics ap-proval. Ethics approval for the study was obtained from the University of Alberta Health Research Ethics Board.
Outcome measures
The outcome measures are percent screen-detected cancers and the length of the diagnostic interval. All breast cancer related diagnostic procedures, including screening/diagnostic mammograms, breast ultrasound and breast biopsies, were identified from the Physician Claims Database and the Screen Test Database. These two databases are complementary, capturing all breast cancer related screening and diagnostic procedures in the province from fee-for service and salaried radiolo-gists, respectively. All breast-related procedures within a validated look-back period [21] from the date of diagno-sis in the Alberta Cancer Registry were obtained.
Breast cancer was defined as screen-detected if the pa-tient had a screening mammogram within the look-back period. The length of the diagnostic interval was defined as the time from the date of the screening mammogram to the date of breast cancer diagnosis, typically the first positive percutaneous or surgical biopsy date. The remaining cancers were defined as symptom-detected.
The earliest breast cancer related diagnostic procedure in the look-back period, usually a diagnostic mammogram, was defined as the first relevant diagnostic test. The most proximal visit to a PCP within 6-months prior to the first relevant test was defined as the start of the diagnostic interval for symptom-detected patients, because in most cases a diagnostic test can only be conducted if a referral is made by a PCP. The diagnostic interval for symptom-detected patients, therefore, is defined as the time interval from the date of the PCP visit to the date of cancer diagnosis. Figure 1 summarizes the diagnostic interval by detection method as described above.
Data were linked using the unique provincial health-care identification number which was anonymized for data analysis. Quality assurance and cross checks were performed on data sets during and after data linkage to ensure accuracy and completeness. Ethical approval was obtained from the Human Research Ethics Board at the University of Alberta before con-ducting the study.
Statistical analyses
Demographic, clinical and healthcare system factors were assessed for their univariate associations with each of the outcome measures. Chi-square tests were calcu-lated to assess associations with percent screen-detected breast cancers and Kruskal-Wallis tests were calculated to assess associations with the length of the diagnostic interval. The demographic factors evaluated were age and neighbourhood income quintile. Patients were grouped as follows: 39 and under, 40–49, 50–69, 70–74, and 75 and over. The age groupings were based on screening guide-lines and clinical practice in Alberta: 50–69 is the screen-eligible age group during the study period [22]; women
[image:3.595.59.541.515.685.2]aged 70–74 are included in the most recent breast
screen-ing guideline [23]; and women aged 40–49 years old can
be referred for breast cancer screening in practice. Clinical factors included cancer stage at diagnosis, histology grade, and Charlson comorbidity index. Healthcare system fac-tors included time period of cancer diagnosis, Usual Pro-vider Continuity score (UPC), regional health authority (RHA), and urban/rural residence. The cut point for the time period variable was chosen based on the observed trend of percent screen-detected cancers over the years. Time period 1 includes cancers diagnosed in years 2004 to 2006 and time period 2 includes cancers diagnosed in years 2007 to 2010.
Multivariable logistic regression was used to exam-ine the association of factors on the likelihood of can-cer being screen-detected. The most parsimonious model was identified and presented as the final model. The interaction of time period by RHA was hypothesized and tested; the interaction was statisti-cally significant and kept in the final model. For the diagnostic interval outcome, multivariable quantile re-gression models were fitted to estimate the effects of individual factors and the interaction effects between RHA and time period for screen and symptom de-tected patients separately. Briefly, quantile regression is similar to linear regression; it differs by modeling the median or specific quantiles defined by the user rather than the mean. For non-symmetric distribu-tions such as time intervals, quantile regression is more appropriate than linear regression. The esti-mates from quantile regression are the difference in diagnostic interval (days) associated with each factor, making it simple to understand. Quantile regression
models were run for the median and the 90th
per-centile; the 90th percentile was intended to represent
diagnostic delay. All analyses were conducted using SAS 9.4 (SAS Institute, Cary NC).
Results
Mode of diagnosis
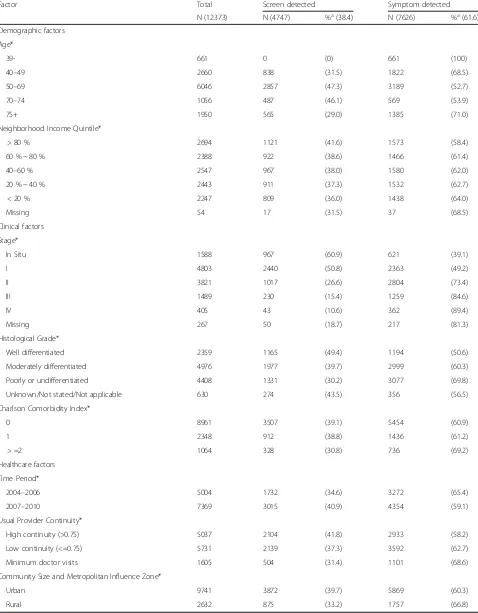
There were 12,813 first-ever female breast cancers di-agnosed in Alberta residents in years 2004 to 2010; 440 (3.4 %) were excluded from the study because of missing data that prevented the assignment of detec-tion mode. Table 1 gives the descriptive statistics of the demographic, clinical, and healthcare system fac-tors of the breast cancer patient cohort by detection mode. About 38 % of the cancer cases were screen-detected overall. Roughly 50 % of patients were in the screen-eligible age group (50 to 69 years of age), of whom 47 % were screen-detected. In the whole cohort, the majority of screen-detected patients, 72 %, had in situ or stage I cancer compared to only 39 % in the symptom-detected patients (P< 0.001). Similarly, screen-detected
cancers had a lower histological grade than the symptom-detected cancers; 25 % of screen-symptom-detected tumors were low grade compared to 16 % of symptom
de-tected (P< 0.001). About 57 % of screen-detected in
situ cancers, however, were high grade (nuclear)
com-pared to 50 % of those symptom-detected (P= 0.01, data
not shown). Similar contrasts by detection mode were found on stage and histology grade among screen-eligible patients. Patients with a high UPC score were more likely to be screen-detected than those with a low score or those with minimum PCP visits, 42, 37, and 31 %, respectively (P< 0.0001). Rural patients were more likely to be symptom-detected than urban patients: 67 and 60 %, respectively (P< 0.001).
The variation in percent screen-detected cancers by RHA for all patients and screen-eligible patients only is shown in Fig. 2. Approximately 50 % of screen-eligible women were screen-detected in four RHAs, 40 % in four RHAs and only 10 % in one RHA.
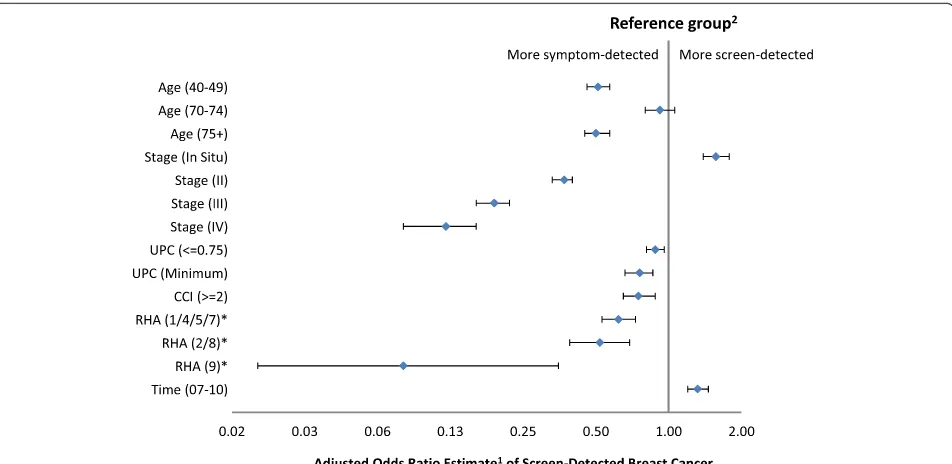
Figure 3 shows the forest plot of the adjusted odds ra-tios from the multivariable logistic regression model in which the outcome is screen-detected cancer. RHAs that had similar estimated odds were grouped together. Pa-tients outside of the screening-eligible age group were less likely to be screen-detected except for age group
70–74 (OR: 0.93, 95 % CI: 0.80–1.06). The likelihood
of being screen-detected increased with decreasing disease stage. Compared to stage I cancer, the esti-mated odds ratio of being screen-detected was 1.57, 0.37, 0.19 and 0.12 for in situ, stages II, III, and IV cancers, respectively (P< 0.001). Having a comorbidity index greater than or equal to 2 was associated with a decreased odds of being screen-detected comparing to those with a comorbidity index less than 2 (OR: 0.73, 95 % CI: 0.65–0.88).
Figure 4 shows significant interaction between RHA and time period. The probability of screen-detected
cancer increased in all regions from 2004–2006 to
2007–2010, however, it increased to a greater extent in
RHAs 2 and 8 than other RHAs (P< 0.001).
Diagnostic interval
Table 1Relationship between demographic, clinical, and healthcare factors and breast cancer detection mode
Factor Total Screen detected Symptom detected
N (12373) N (4747) %a(38.4) N (7626) %a(61.6)
Demographic factors Age*
39- 661 0 (0) 661 (100)
40–49 2660 838 (31.5) 1822 (68.5)
50–69 6046 2857 (47.3) 3189 (52.7)
70–74 1056 487 (46.1) 569 (53.9)
75+ 1950 565 (29.0) 1385 (71.0)
Neighborhood Income Quintile*
> 80 % 2694 1121 (41.6) 1573 (58.4)
60 % ~ 80 % 2388 922 (38.6) 1466 (61.4)
40–60 % 2547 967 (38.0) 1580 (62.0)
20 % ~ 40 % 2443 911 (37.3) 1532 (62.7)
< 20 % 2247 809 (36.0) 1438 (64.0)
Missing 54 17 (31.5) 37 (68.5)
Clinical factors Stage*
In Situ 1588 967 (60.9) 621 (39.1)
I 4803 2440 (50.8) 2363 (49.2)
II 3821 1017 (26.6) 2804 (73.4)
III 1489 230 (15.4) 1259 (84.6)
IV 405 43 (10.6) 362 (89.4)
Missing 267 50 (18.7) 217 (81.3)
Histological Grade*
Well differentiated 2359 1165 (49.4) 1194 (50.6)
Moderately differentiated 4976 1977 (39.7) 2999 (60.3)
Poorly or undifferentiated 4408 1331 (30.2) 3077 (69.8)
Unknown/Not stated/Not applicable 630 274 (43.5) 356 (56.5)
Charlson Comorbidity Index*
0 8961 3507 (39.1) 5454 (60.9)
1 2348 912 (38.8) 1436 (61.2)
> =2 1064 328 (30.8) 736 (69.2)
Healthcare factors Time Period*
2004–2006 5004 1732 (34.6) 3272 (65.4)
2007–2010 7369 3015 (40.9) 4354 (59.1)
Usual Provider Continuity*
High continuity (>0.75) 5037 2104 (41.8) 2933 (58.2)
Low continuity (<=0.75) 5731 2139 (37.3) 3592 (62.7)
Minimum doctor visits 1605 504 (31.4) 1101 (68.6)
Community Size and Metropolitan Influence Zone*
Urban 9741 3872 (39.7) 5869 (60.3)
Rural 2632 875 (33.2) 1757 (66.8)
a
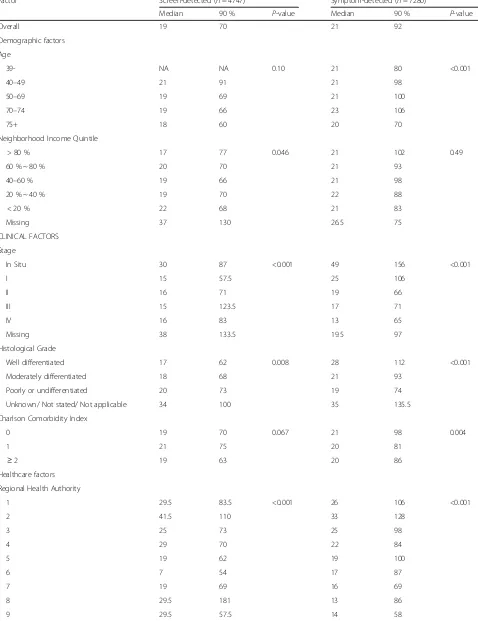
much attenuated in the screen-detected group, however; in situ cancers had a median time of 30 days while all in-vasive cancers (stage I through IV) had a median of about 16 days. There was also significant variation in time to diagnosis by health region: the median diagnos-tic interval ranged from 7 to 42 days in the screen-detected group and from 13 to 33 days in the symptom-detected group.
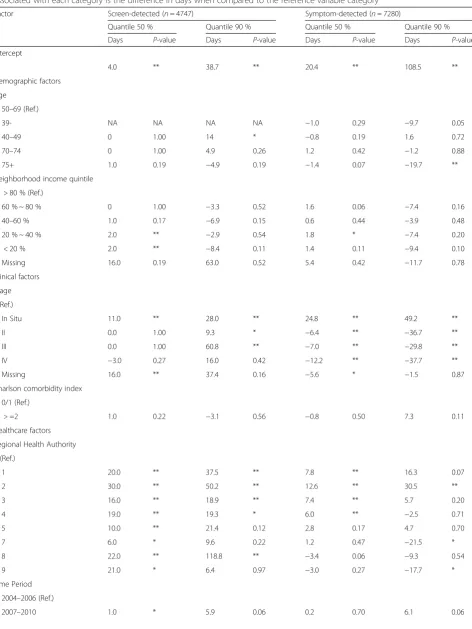
Table 3 shows the results of the quantile regression models for the median and the 90 % quantile for the two detection methods, based on a simplified model that did not include any interaction term.
RHA and cancer stage had the strongest associations with the time to diagnosis for both screen- and symptom-detected cancers, though the associations differed by detection mode. The estimated median time to diagnosis ranged from 4 to 37 days depending
on the RHA in the screen-detected cancers (P< 0.005)
and from 17 to 33 days in the symptom-detected can-cers (P< 0.005), holding other factors at the reference levels. The dissimilar patterns of the adjusted median
and 90th percentile diagnostic intervals depicted in
Fig. 5 illustrate the extent of regional variation. A
longer median (90th percentile) in a given RHA for a
given detection mode does not necessarily translate
into a longer median (90th percentile) for the other
detection mode in the same RHA.
Similarly, cancer stage showed a different pattern of variation in the screen- and symptom-detected groups. In symptom-detected cancers, the estimated median time to diagnosis decreased monotonically with increas-ing stage (45, 20, 14, 13 and 8 days for in situ, stage I, II, II, and IV, respectively, P< 0.005); the estimated median time in screen-detected cancers also decreased with in-creasing stage but had a much smaller range (15, 4, 4, 4 and 1 days for in situ, stage I, II, II, and IV, respectively,
P< 0.005), holding other factors at the reference levels. For symptom-detected patients, the effect of RHA on the length of the diagnostic interval was modified
by the time period.1 Figure 6 illustrates the effect
modification of time period on RHA observed in the
median time to diagnosis. From 2004–2006 to 2007–
2010, the median diagnostic interval increased
dra-matically by 18 days in RHA 2 (P< 0.001), increased
by 3 days in RHAs 1, 3 and 8 (P< 0.001), decreased
by about 6 days in RHA 4 (P< 0.001), and remained
largely the same in RHAs 5, 6, 7, and 9. Overall, the median diagnostic intervals were less than a month
for all RHAs except RHA 2 in 2007–2010, where the
median diagnostic interval was 41 days.
[image:6.595.57.539.86.364.2]Discussion
In Alberta Canada, a province with a free, long-standing, organized screening program, about 38 % of cancers were screen-detected; among the age-eligible population
it was 47 %. In our study, those aged 70–74 were as
likely as those aged 50–69 to have screen-detected
cancer. The median time to diagnosis was similar for
screen- and symptom-detected breast cancers at 19 and 21 days, respectively. At the 90thpercentile, however, the time to diagnosis was 70 days in screen-detected breast cancers compared to 92 days in symptom-detected breast cancers. Region of residence and cancer stage had the strongest associations with both detection mode and time to diagnosis.
The percent of screen-detected cancers varied from about 10 to 50 % by RHA, however, one RHA was re-sponsible for most of the variation as eight of the nine
RHAs ranged from 40–50 % of age-eligible women being
detected. The RHA with only 10 % screen-detected breast cancers is a geographically large rural/re-mote region in the northern-most part of the province; approximately 20 % of the population is Aboriginal [24]. Some of the remote communities only have access to screening mammography through a mobile unit via an ice road during winter months. Other studies have re-ported similar challenges in the screening of breast can-cer among vulnerable populations in such remote regions [25]. The screening program has now developed a special program to encourage screening (for all screeenable cancers) in this region.
As expected, screen-detected cancers were much more likely to be early stage tumours (in situ or stage I) than symptom-detected cancers. In situ can-cers accounted for 20 % of screen-detected cancan-cers and 8 % of symptomatic cancers, similar to findings in other jurisdictions [26]. Compared to
symptom-Fig. 4An illustration of the effect modification on percent screening-detection. The percent screening detected female breast cancers in different RHAs was modified by the time period in women diagnosed in Alberta, Canada in years 2004–2010
[image:7.595.61.537.87.319.2] [image:7.595.57.291.484.684.2]Table 2Median and 90thpercentile in days of the diagnostic interval by detection mode
Factor Screen-detected (n= 4747) Symptom-detected (n= 7280)
Median 90 % P-value Median 90 % P-value
Overall 19 70 21 92
Demographic factors Age
39- NA NA 0.10 21 80 <0.001
40–49 21 91 21 98
50–69 19 69 21 100
70–74 19 66 23 106
75+ 18 60 20 70
Neighborhood Income Quintile
> 80 % 17 77 0.046 21 102 0.49
60 % ~ 80 % 20 70 21 93
40–60 % 19 66 21 98
20 % ~ 40 % 19 70 22 88
< 20 % 22 68 21 83
Missing 37 130 26.5 75
CLINICAL FACTORS Stage
In Situ 30 87 <0.001 49 156 <0.001
I 15 57.5 25 106
II 16 71 19 66
III 15 123.5 17 71
IV 16 83 13 65
Missing 38 133.5 19.5 97
Histological Grade
Well differentiated 17 62 0.008 28 112 <0.001
Moderately differentiated 18 68 21 93
Poorly or undifferentiated 20 73 19 74
Unknown/ Not stated/ Not applicable 34 100 35 135.5
Charlson Comorbidity Index
0 19 70 0.067 21 98 0.004
1 21 75 20 81
≥2 19 63 20 86
Healthcare factors Regional Health Authority
1 29.5 83.5 <0.001 26 106 <0.001
2 41.5 110 33 128
3 25 73 25 98
4 29 70 22 84
5 19 62 19 100
6 7 54 17 87
7 19 69 16 69
8 29.5 181 13 86
detected cancers, screen-detected cancers also tended to have a lower histological grade. Although early detection through screening has long-term survival
advantage [4–6, 27], it also results in “over”
detec-tion leading to over treatment in a propordetec-tion of women [26, 28]. From the current study we are not able to assess this fraction. More research is needed to assess optimal histopathologic diagnosis [29] and treatment for in situ cancers to minimize patient harm and resource waste caused by over treatment.
Cancer patients with a co-morbidity index two or above and those with a low UPC index were less likely to be detected by screening. These findings are consistent with the literature, suggesting that dealing
with chronic diseases may divert patients’ and health
care providers’ attention from preventive cancer care
services [30]. Further, if women have other diseases that are likely to be fatal within a few years, screening
may not be appropriate. Patients ‘attached’ to a
pri-mary care physician are more likely to receive pre-ventive care [31–33].
The patterns of variation in time to diagnosis differed by RHA and stage for each mode of diagno-sis. We hypothesize that the rural regions that had the most extreme diagnostic intervals or diagnostic interval increases over time may suffer from lack of specific resources, such as radiologists or patholo-gists, as shortage of physician and other healthcare
resources is associated with diagnostic delay [33–35].
Time to diagnosis also differed between the two metropolitan areas (RHA 3 and 6) with a larger dif-ference in screen-detected cancers. This is likely ex-plained by a program in RHA 6 that specifies the
radiologist’s role in arranging follow-up tests on the
same day for abnormal mammogram results. It is hypothesized that communication and referral prob-lems could be responsible for variations in diagnostic
intervals in urban and rural centers [36–38]. Closer
inspection of communication, referral patterns and healthcare resources is needed to identify ways to
minimize regional variation in timeliness of diagnos-tic care.
Higher stage cancers that were symptom-detected were diagnosed more quickly than those with a lower stage. This is consistent with other studies that have found shorter diagnostic intervals for the most symp-tomatic cases [39, 40]. Upon further inspection we found that most of the variation in time to diagnosis of symptom-detected cancers by cancer stage was due to a longer time from the PCP visit to the first test for low stage cancers than high stage cancers (data not shown), consistent with clinical practice to prioritize diagnostic tests based on patient symptoms. Interestingly, the in-verse relationship between time and cancer stage was much less evident for screen-detected cancers, as inva-sive cancers of all stages had a median diagnostic inter-val of approximately 16 days. We hypothesize that the procedures and communication between providers fol-lowing screen-detection of breast abnormalities are more established and coordinated compared to that for symptom-detected breast abnormalities, and since mam-mography does not clearly differentiate stage, all are treated alike until biopsy results are available. Clear pro-vider communication of test results, and physician docu-mentation of the follow-up plan have been identified as important factors that facilitate patient receipt of follow-up care [36, 11, 41].
We found that 47 % of screen-eligible women by age were screen-detected, which is a little lower than the 55 % reported in West Midlands, UK [42]. In
2009–10, the overall screening rate in Alberta was
about 57.3 % which is lower than the target 70 % that the Canadian programs set in 2006 [43] but higher than the Canadian average of about 52 % [44]. Although screening uptake is not optimal, there is a clear and significant stage shift towards earlier stage in the screen-detected cancers compared to the symptom-detected ones observed in the current study, sug-gesting that the screening program in Alberta is effective. The large regional variation in both percent screen-Table 2Median and 90thpercentile in days of the diagnostic interval by detection mode(Continued)
Time Period
2004–2006 18 67 0.024 21 87 0.72
2007–2010 20 73 21 97
Usual Provider Continuity
High continuity (>0.75) 19 67 0.48 22 91 <0.001
Low continuity (<=0.75) 20 74 22 99
Minimum doctor visits 18 70 18 63
Community Size and Metropolitan Influence Zone
Urban 17 69 <0.001 21 93 0.01
[image:9.595.58.538.100.243.2]Table 3Quantile regression estimates of the median and 90thpercentile of diagnostic interval by detection mode. The estimate associated with each category is the difference in days when compared to the reference variable category
Factor Screen-detected (n= 4747) Symptom-detected (n= 7280)
Quantile 50 % Quantile 90 % Quantile 50 % Quantile 90 %
Days P-value Days P-value Days P-value Days P-value
Intercept
4.0 ** 38.7 ** 20.4 ** 108.5 **
Demographic factors Age
50–69 (Ref.)
39- NA NA NA NA −1.0 0.29 −9.7 0.05
40–49 0 1.00 14 * −0.8 0.19 1.6 0.72
70–74 0 1.00 4.9 0.26 1.2 0.42 −1.2 0.88
75+ 1.0 0.19 −4.9 0.19 −1.4 0.07 −19.7 **
Neighborhood income quintile > 80 % (Ref.)
60 % ~ 80 % 0 1.00 −3.3 0.52 1.6 0.06 −7.4 0.16
40–60 % 1.0 0.17 −6.9 0.15 0.6 0.44 −3.9 0.48
20 % ~ 40 % 2.0 ** −2.9 0.54 1.8 * −7.4 0.20
< 20 % 2.0 ** −8.4 0.11 1.4 0.11 −9.4 0.10
Missing 16.0 0.19 63.0 0.52 5.4 0.42 −11.7 0.78
Clinical factors Stage I (Ref.)
In Situ 11.0 ** 28.0 ** 24.8 ** 49.2 **
II 0.0 1.00 9.3 * −6.4 ** −36.7 **
III 0.0 1.00 60.8 ** −7.0 ** −29.8 **
IV −3.0 0.27 16.0 0.42 −12.2 ** −37.7 **
Missing 16.0 ** 37.4 0.16 −5.6 * −1.5 0.87
Charlson comorbidity index 0/1 (Ref.)
> =2 1.0 0.22 −3.1 0.56 −0.8 0.50 7.3 0.11
Healthcare factors Regional Health Authority 6 (Ref.)
1 20.0 ** 37.5 ** 7.8 ** 16.3 0.07
2 30.0 ** 50.2 ** 12.6 ** 30.5 **
3 16.0 ** 18.9 ** 7.4 ** 5.7 0.20
4 19.0 ** 19.3 * 6.0 ** −2.5 0.71
5 10.0 ** 21.4 0.12 2.8 0.17 4.7 0.70
7 6.0 * 9.6 0.22 1.2 0.47 −21.5 *
8 22.0 ** 118.8 ** −3.4 0.06 −9.3 0.54
9 21.0 * 6.4 0.97 −3.0 0.27 −17.7 *
Time Period 2004–2006 (Ref.)
detected and time to diagnosis, however, suggests there is significant room for improvement.
The major strength of the study is that we studied a population-based incident case cohort that included all women with a first-ever breast cancer diagnosis over a 6-year period. Thus, survivor bias is minimal in our study. It also allows for the assessment of changes over time. The major limitations of this study are: 1) lack of patient level information that may have explained some of the variation in percent screen-detected cancer based on patient choice due to education, screening awareness and different values placed on screening; 2) lack of
detailed clinical information that could affect time to diagnosis, such as breast density, which may explain the shorter diagnostic interval at 90th percentile for older patients; and 3) lack of registry data on molecular bio-markers, e.g. ER, PR and triple negative, which is im-portant to understand the implications of delay in diagnosis for the more aggressive phenotypes. Addition-ally, issues related to access to healthcare services such as access to a PCP, screening mammography, biopsy and pathologist were not investigated due to the limitation of the data sources, however, the RHA variable served as a proxy for the access factors to some extent.
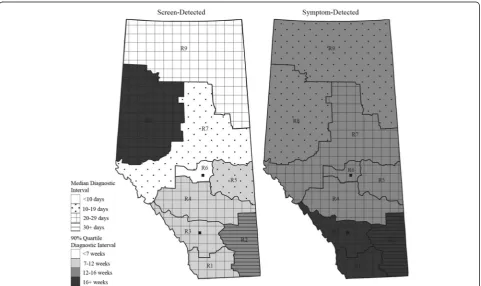
[image:11.595.57.541.113.214.2]Fig. 5Maps of Alberta displaying regional variation in diagnostic interval by detection mode. The model based median and 90thpercentile estimates of the diagnostic interval are for urban patients with stage I cancer, in age group 50–69, and diagnosed in years 2004–2006. The map legends R1–R9 represent RHA1–RHA9. The two solid squares in R3 and R6 indicate the location of the two metropolitan areas
Table 3Quantile regression estimates of the median and 90thpercentile of diagnostic interval by detection mode. The estimate associated with each category is the difference in days when compared to the reference variable category(Continued)
Usual Provider Continuity High continuity (>0.75, Ref.)
Low continuity (<=0.75) −0.0 1.00 5.4 0.12 0.4 0.50 2.9 0.46
Minimum doctor visits −1.0 0.26 −2.77 0.62 −2.0 * −19.2 **
Community Size and Metropolitan Influence Zone Urban (Ref.)
Rural 3.0 * −2.3 0.66 −1.2 0.20 1.7 0.75
[image:11.595.58.540.406.692.2]Conclusions
Population-based studies are important for assessing healthcare efficiency and identifying disparities within the typical clinical practice environment. The significant variation in mode of detection and time to diagnosis across RHAs found in the current study suggests there are important differences in local coordination of breast cancer diagnosis. Similar regional variation in healthcare has been reported in several other jurisdictions, and for other diseases, indicating a need for routine monitoring within and/or across provinces (insurance providers) [45–48]. The public reporting efforts that have begun in
the United Kingdom, Canada, and elsewhere [49–51] are
good starting points for identifying variation but local insurers and/or healthcare providers must take it upon themselves to properly identify and address root causes to healthcare variation through programming and moni-toring in order to properly address them.
Endnote 1
In the analysis of effect modification, health regions have been grouped according to their median diagnostic interval estimates and their changes over time, in order to make Fig. 6 less busy while keeping the important findings intact.
Abbreviations
ICD-O:International Classification of Disease for Oncology; PCP: primary care physician; RHA: regional health authority; UPC: usual provider continuity score.
Competing interests
The author(s) declare that they have no competing interests.
Authors’contributions
All authors were involved in interpretation of the results and revision and approval of the submitted version. Additionally: YY contributed to the study conception and design, data analysis and drafting of the manuscript. MW contributed to the study conception and design, data acquisition, analysis, and drafting of the manuscript. ML and YJ contributed to the analysis of data. TE, KD and JD contributed to the study conception and provided clinical insight. SF contributed to the drafting of the manuscript. All authors approved the submitted version.
Acknowledgement
The authors would like to thank the Alberta Breast Cancer Screening Program for providing Screen Test data and program staff, Bonnie Chiang and Sarah VanDusen, for their insightful comments. This work was supported by the Medical Services (Alberta) Incorporated Foundation [Grant number 869 to Y.Y.]; and the Canadian Institute of Health Research [DC0190GP to M.W.].
Declarations
Signed confidentiality agreements prevent us from sharing the data.
Author details 1
School of Public Health, University of Alberta, Edmonton, Alberta T6G 1C9, Canada.2Cancer Control Alberta, Alberta Health Services, Edmonton, Alberta T5J 3H1, Canada.3Department of Diagnostic Imaging, Foothills Medical Centre, Calgary, Alberta T2N 2T9, Canada.4Department of Surgery, University of Alberta, Edmonton, Alberta T6G 1C9, Canada.5Family Medicine and Community Health Sciences, University of Calgary, Calgary, Alberta T2N 4N1, Canada.6Divison of General Medical Disciplines, Stanford University School of Medicine, Stanford, CA 94305, USA.
Received: 11 June 2015 Accepted: 10 February 2016
References
1. Canadian Cancer Society. Canadian Cancer Society’s Advisory Committee on Cancer Statistics. Canadian cancer statistics 2013. Toronto: The Society; 2013. 2. Morrison BJ. Screening for breast cancer. In: The Canadian guide to clinical
preventive health care. Ottawa: Health Canada; 1994.
3. Canadian Association of Radiologists. CAR Practice Guidelines and Technical Standards for Breast Imaging and Intervention 2013. Available from: http:// www.car.ca/uploads/standards%20guidelines/20131024_en_breast_ imaging_practice_guidelines.pdf.
4. Bjurstam N, Bjorneld L, Warwick J, et al. The Gothenburg breast screening trial. Cancer. 2003;97(10):2387–96.
5. Nystrom L, Andersson I, Bjurstam N, Frisell J, Nordenskjold B, Rutqvist LE. Long-term effects of mammography screening: updated overview of the Swedish randomised trials. Lancet. 2002;359(9310):909–19.
6. Moss SM, Cuckle H, Evans A, et al. Effect of mammographic screening from age 40 years on breast cancer mortality at 10 years’follow-up: a randomised controlled trial. Lancet. 2006;368:2053–60.
7. Allen JD, Shelton RC, Harden E, Goldman RE. Follow-up of abnormal screening mammograms among low-income ethnically diverse women: findings from a qualitative study. Patient Educ Couns. 2008;72(2):283–92. doi:10.1016/j.pec.2008.03.024.
8. Heckman BC, Fisher EB, Monsees B, Merbaum M, Ristvedt S, Bishop C. Coping and anxiety in women recalled for additional diagnostic procedures following an abnormal screening mammogram. Health Psychol. 2004;23(1): 42–8. doi:10.1037/0278-6133.23.1.42.
9. Kothari A, Fentiman IS. 22. Diagnostic delays in breast cancer and impact on survival. Int J Clin Pract. 2003;57(3):200–3.
10. Richards MA, Westcombe AM, Love SB, Littlejohns P, Ramirez AJ. Influence of delay on survival in patients with breast cancer: a systematic review. Lancet. 1999;353(9159):1119–26. doi:10.1016/S0140-6736(99)02143-1. 11. Kerner JF, Yedidia M, Padgett D, Muth B, Washington KS, Tefft M, et al.
Realizing the promise of breast cancer screening: clinical follow-up after abnormal screening among Black women. Prev Med. 2003;37(2):92–101. doi:10.1111/j.1525-1497.2005.40281.x.
12. Fritz A, Percy C, Jack A, et al., editors. International Classification of Diseases for Oncology. 3rd ed. Geneva, Switzerland: World Health Organization; 2000. 13. Statistics Canada, Demography Division. Report on the Demographic
Situation of Canada. Population growth: Canada, provinces and territories,
[image:12.595.58.291.87.225.2]2010. Available from: http://www.statcan.gc.ca/pub/91-209-x/2011001/ article/11508-eng.pdf.
14. Statistics Canada. Alberta and Canada (table). Health Profile. Statistics Canada Catalogue no. 82-228-XWE. Ottawa. Released December 12, 2013. Available from: http://www12.statcan.gc.ca/health-sante/82-228/details/ page.cfm?Lang=E&Tab=1&Geo1=HR&Code1=4831&Geo2=PR&Code2= 48&Data=Rate&SearchText=South%20Zone&SearchType=Contains& SearchPR=01&B1=All&Custom=&B2=All&B3=All.
15. Greene FL, Page DL, Fleming ID, et al., editors. American Joint Committee on Cancer Cancer Staging Manual. 6th ed. New York: Springer; 2002. 16. Wilson R, Peters PA. PCCF+ Version 5K user’s guide. Automated geographic
coding based on the Statistics Canada postal code conversion files, including postal codes through May 2011. Catalogue no. 82F0086-XDB. Ottawa: Health Statistics Division, Statistics Canada; 2012.
17. Quan H, Sundararajan V, Hlafon P, et al. Coding algorithms for defining comorbidities in ICD-9-CM and ICD-10 administrative data. Med Care. 2005;43(11):1130–9.
18. Sundararajan V, Henderson T, Perry C, et al. New ICD-10 version of the Charlson Comorbidity index predicting in-hospital mortality. J Clin Epidmeiol. 2004;57(12):1288–94.
19. Reid R, Haggerty J, McKendry R. Defusing the confusion: Concepts and measures of continuity of healthcare. Canadian Health Services Research Foundation 2002. Available from: http://www.cfhi-fcass.ca
20. Breslau N, Reeb KG. Continuity of care in a university-based practice. J Med Educ. 1975;50(10):965–9.
21. Yuan Y, Li M, Yang J, Winget M. Using administrative data to estimate time to breast cancer diagnosis and percent of screen-detected breast cancers - a validation study in Alberta, Canada. Eur J Cancer Care. 2015;24:367–75. 22. Toward Optimized Practice (TOP) Guideline For The Early Detection of
Breast Cancer 2007 Update. Available from: http://www.cbcn.ca/documents/ breast_cancer_guideline.pdf.
23. Toward Optimized Practice (TOP) Working Group for Breast Cancer Screening. 2013 Sep. Breast cancer screening: clinical practice guideline. Edmonton, AB: Toward Optimized Practice. Available from: http://www. topalbertadoctors.org/download/243/breast_cancer_guideline.pdf?_ 20160129141842
24. Statistics Canada. Northern Lights health region, Alberta (Code4829) (table). Aboriginal population profile. 2006 Census. Statistics Canada Catalogue no. 92-594-XWE. Ottawa. Released January 15, 2008. Available from: http://www12.statcan.ca/census-recensement/2006/dp-pd/prof/92-594/ index.cfm?Lang=E.
25. Nguyen-Pham S, Leung J, McLaughlin D. Disparities in breast cancer stage at diagnosis in urban and rural adult women: a systematic review and meta-analysis. Ann Epidemiol. 2014;24(3):228–35. doi:10.1016/j.annepidem. 2013.12.002.
26. Jorgensen KJ, Gotzsche PC. Overdiagnosis in publicly organized mammography screening programmes: systematic review of incidence trends. BMJ. 2009;339:b2587. doi:10.1136/bmj.b2587.
27. Canadian Task Force on Preventative Health Care, Tonelli M, Connor Gorber S, et al. Recommendations on screening for breast cancer in average-risk women aged 40–74 years. CMAJ. 2011;183(17):1991–2001. doi:10.1503/cmaj.11033. 28. Independent UK Panel on Breast Cancer Screening. The benefits and
harms of breast cancer screening: an independent review. Lancet. 2012;380(9855):1778–86. doi:10.1016/S0140-6736(12)61611-0. 29. Elmore JG, Longton GM, Carney PA, Geller BM, Onega T, Tosteson AN,
et al. Diagnostic concordance among pathologists interpreting breast biopsy specimens. JAMA. 2015;313(11):1122–32. doi:10.1001/jama.2015.1405. PMID: 25781441.
30. Kiefe CI, Funkhouser E, Fouad MN, May DS. Chronic disease as a barrier to breast and cervical cancer screening. J Gen Intern Med. 1998;13(6):357–65. 31. Litaker D, Tomolo A. Association of contextual factors and breast cancer
screening: finding new targets to promote early detection. J Women’s Health (Larchmt). 2007;16(1):36–45.
32. Schuler KM, Chu PW, Smith-Bindman R. Factors associated with
mammography utilization: a systematic quantitative review of the literature. J Women’s Health (Larchmt). 2008;17(9):1477–98.
33. Gorey KM, Luginaah IN, Holowaty EJ, Kung KY, Hamm C. Associations of physician supplies with breast cancer stage at diagnosis and survival in Ontario, 1988 to 2006. Cancer. 2009;115(15):3563–70. doi:10.1007/s10620-010-1284-4.
34. Blankart CR. Does healthcare infrastructure have an impact on delay in diagnosis and survival? Health Policy. 2012;105(2–3):128–37. doi:10.1016/j. healthpol.2012.01.006.
35. Wujcik D, Fair AM. Barriers to diagnostic resolution after abnormal mammography: a review of the literature. Cancer Nurs. 2008;31(5):E16–30. doi:10.1097/01.NCC.0000305764.96732.45.
36. Poon EG, Haas JS, Puopolo AL, Gandhi TK, Burdick E, Bates DW, et al. Communication factors in the follow-up of abnormal mammograms. J Gen Intern Med. 2004;19(4):316–23. doi:10.1111/j.1525-1497.2004.30357.x. 37. Maddison AR, Asada Y, Urguhart R. Inequity in access to cancer care: a
review of the Canadian literature. Cancer Causes Control. 2011;22(3):359–66. doi:10.1007/s10552-010-9722-3.
38. Neal RD, Din NU, Hamilton W, et al. Comparison of cancer diagnostic intervals before and after implementation of NICE guidelines: analysis of data from the UK General Practice Research Database. Br J Cancer. 2014; 110(3):584–92. doi:10.1038/bjc.2013.791.
39. Olivotto IA, Gomi A, Bancej C, et al. Influence of delay to diagnosis on prognostic indicators of screen-detected breast carcinoma. Cancer. 2002;94(8):2143–50. 40. Montella M, Crispo A, D’Aiuto G, et al. Determinant factors for diagnostic
delay in operable breast cancer patients. Eur J Cancer Prev. 2001;10(1):53–9. doi:10.1097/00008469-200102000-00006.
41. Burack RC, Simon MS, Stano M, George J, Coombs J. Follow-up among women with an abnormal screening mammogram in an HMO: is it complete, timely and efficient? Am H Manage Care. 2000;6(10):1102–13. 42. Nagtegaal ID, Allgood PC, Duffy SW, et al. Prognosis and pathology of
screen-detected carcinomas: how different are they? Cancer. 2011;117(7):1360–8. 43. Evaluation Indicators Working Group. Guidelines for monitoring breast
cancer screening program performance: Report from the Evaluation Indicators Working Group. 2nd ed. Ottawa: Public Health Agency of Canada; 2007. Available from: http://www.phac-aspc.gc.ca/publicat/2007/gmbspp-ldsppdcs/pdf/gmbspp-ldsppdcs_e.pdf.
44. Cancer CPA. Breast cancer control in Canada: A system performance special focus report. Toronto: Canadian Partnership Against Cancer; 2012. 45. Wouters MWJM, Siesling S, Jansen-Landheer ML, et al. Variation in treatment
and outcome in patients with non-small cell lung cancer by region, hospital type and volume in the Netherlands. Eur J Surg Oncol. 2010;36 Suppl 1:S83–92. doi:10.1016/j.ejso.2010.06.020.
46. Vogt V, Siegel M, Sundmcher L. Examining regional variation in the use of cancer screening in Germany. Soc Sci Med. 2014;110:74–80. doi:10.1016/j. socscimed.2014.03.033.
47. Sant M, Minicozzi P, Allemani C, et al. Regional inequalities in cancer care persist in Italy and can influence survival. Cancer Epidemiol. 2012;36(6):541–7. doi:10.1016/j.canep.2012.06.006.
48. Fisher S, Gao H, Yasui Y, Dabbs K, Winget M. Treatment variation in patients diagnosed with early stage breast cancer in Alberta from 2002 to 2010: a population-based study. BMC Health Serv Res. 2015;15(1):35.
49. Canadian Institute for Health Information. Breast cancer surgery in Canada, 2007–2008 to 2009–2010. Ottawa: CIHI; 2012.
50. Canadian Partnership Against Cancer. Cervical cancer screening in Canada: monitoring program performance 2006–2008. Toronto: CIHI; 2011. 51. National Cancer Intelligence Network. Second all breast cancer report. 2011.
Available from: http://www.ncin.org.uk/publications/
• We accept pre-submission inquiries
• Our selector tool helps you to find the most relevant journal • We provide round the clock customer support
• Convenient online submission • Thorough peer review
• Inclusion in PubMed and all major indexing services • Maximum visibility for your research
Submit your manuscript at www.biomedcentral.com/submit