RESEARCH
Non-caloric sweetener provides
magnetic resonance imaging contrast for cancer
detection
Puneet Bagga
1†, Mohammad Haris
2†, Kevin D’Aquilla
1, Neil E. Wilson
1, Francesco M. Marincola
2,
Mitchell D. Schnall
1, Hari Hariharan
1and Ravinder Reddy
1*Abstract
Background: Image contrast enhanced by exogenous contrast agents plays a crucial role in the early detection, characterization, and determination of the precise location of cancers. Here, we investigate the feasibility of using a non-nutritive sweetener, sucralose (commercial name, Splenda), as magnetic resonance imaging (MRI) contrast agent for cancer studies.
Methods: High-resolution nuclear-magnetic-resonance spectroscopy and MR studies on sucralose solution phan-tom were performed to detect the chemical exchange saturation transfer (CEST) property of sucralose hydroxyl protons with bulk water (sucCEST). For the animal experiments, female Fisher rats (F344/NCR) were used to generate 9L-gliosarcoma model. MRI with CEST experiments were performed on anesthetized rats at 9.4 T MR scanner. Follow-ing the baseline CEST scans, sucralose solution was intravenously administered in control and tumor bearFollow-ing rats. CEST acquisitions were continued during and following the administration of sucralose. Following the sucCEST, Gadolinium-diethylenetriamine pentaacetic acid was injected to perform Gd-enhanced imaging for visualizing the tumor.
Results: The sucCEST contrast in vitro was found to correlate positively with the sucralose concentration and nega-tively with the pH, indicating the potential of this technique in cancer imaging. In a control animal, the CEST contrast from the brain was found to be unaffected following the administration of sucralose, demonstrating its blood–brain barrier impermeability. In a 9L glioma model, enhanced localized sucCEST contrast in the tumor region was detected while the unaffected brain region showed unaltered CEST effect implying the specificity of sucralose toward the tumorous tissue. The CEST asymmetry plots acquired from the tumor region before and after the sucralose infusion showed elevation of asymmetry at 1 ppm, pointing towards the role of sucralose in increased contrast.
Conclusions: We show the feasibility of using sucralose and sucCEST in study of preclinical models of cancer. This study paves the way for the potential development of sucralose and other sucrose derivatives as contrast agents for clinical MRI applications.
Keywords: CEST, MRI, Glioma, Cancer, Gadolinium, Sucralose
© The Author(s) 2017. This article is distributed under the terms of the Creative Commons Attribution 4.0 International License (http://creativecommons.org/licenses/by/4.0/), which permits unrestricted use, distribution, and reproduction in any medium, provided you give appropriate credit to the original author(s) and the source, provide a link to the Creative Commons license, and indicate if changes were made. The Creative Commons Public Domain Dedication waiver (http://creativecommons.org/ publicdomain/zero/1.0/) applies to the data made available in this article, unless otherwise stated.
Background
Medical imaging can provide morphological, structural, metabolic and functional information of tumors and is
an essential part of cancer clinical protocols. In order to accurately detect and characterize tumors, exog-enous contrast agents are often used. Positron emission tomography (PET) imaging of 18fluoro-2-deoxy-glucose
(18FDG), an analogue of glucose, is most widely used to
characterize cancers based on the high uptake rate and glycolytic activity of tumors compared to healthy tissue [1–5]. Although 18FDG-PET provides valuable functional
and metabolic information of cancers, it may be limited
Open Access
*Correspondence: krr@upenn.edu
†Puneet Bagga and Mohammad Haris contributed equally to this work 1 Department of Radiology, Center for Magnetic Resonance and Optical
by the lack of specificity of 18FDG uptake and the patients
exposure to ionizing radiation [6].
Magnetic resonance imaging (MRI) coupled with administration of gadolinium based contrast agents (GBCAs) provides exquisite contrast between nor-mal and tumorous tissues without exposure to ionizing radiation and helps with clinical decision-making [7]. However, recent studies have reported the deposition of GBCAs in brain and bone matrix found by MRI and mass spectrometry [8–13]. Further studies are required to evaluate the long-term effects of gadolinium detected in the brain tissues or other organs on normal functioning of the organs. This provides an impetus to explore new MRI contrast agents that are non-toxic and non-metabo-lized. Ideal contrast agents would also be inexpensive.
Magnetic resonance imaging based on the chemical exchange saturation transfer (CEST) effect has gained widespread attention for its ability to image certain metabolites indirectly at high resolution [14–19]. In CEST, a long, frequency-selective radiofrequency pulse saturates the labile protons of a metabolite solute. The exchange of the saturated magnetization of the solute with the bulk water protons leads to a reduction in the bulk water signal compared to the signal without satu-ration [20–23]. The CEST method has been shown to provide higher sensitivity than direct observation with traditional proton MR spectroscopy (MRS) and was applied in monitoring the changes in metabolite and macromolecular levels in various human diseases [15,
24–28]. Recently, Glucose and its analogues have been used as CEST contrast agents (glucoCEST) to image cancers in animal models [17, 29–31] and human cancer patients [32]. However, there are a couple of confounding factors in the glucoCEST contrast because of how read-ily glucose is metabolized, and care must be taken with regards to differences in its metabolism in healthy and tumorous tissues, glucose’s metabolic products, and the accumulation in the extracellular and extravascular. The extent of these contributions to the glucoCEST contrast is currently unknown [33]. Nonetheless, the CEST aris-ing in the tumor region followaris-ing the glucose administra-tion has been aptly labeled as glucoCEST.
In this study, we demonstrate the feasibility of using the popular sweetener sucralose (commercial name “Splenda”) as an MRI contrast agent to detect cancer. Sucralose does not metabolize but accumulates into tumor tissue due to the enhanced permeability and retention effect, and it exhibits CEST contrast through its labile hydroxyl protons. We termed this new method as ‘sucCEST’. The concentration and pH dependence of sucCEST contrast was measured in vitro in solution phantoms, and the sucCEST contrast was evaluated in a rat brain gliosarcoma model and compared with the
gadolinium-diethylenetriamine pentaacetic acid (Gd-DTPA) contrast enhanced image. Finally, the application of sucCEST in cancer and other pathological conditions in humans is discussed.
Methods
Phantom preparations
For high-resolution 1H NMR spectra, 200 mM of
sucra-lose (Sigma Aldrich, USA) solution was prepared in phosphate buffered saline (PBS) at pH 7. For imaging, phantoms were prepared in PBS and experiments were performed at 37 °C. To measure the pH dependence of sucCEST, phantoms with 10 mM sucralose concentra-tion in PBS were prepared at a varying pH from 6.6 to 7.4 in step of 0.2 pH unit. The pH was adjusted using 1 N NaOH/HCl. For measuring concentration dependence of sucCEST contrast, phantoms with 2, 4, 6, 8, and 10 mM concentrations of sucralose were prepared in PBS at pH 7.
To obtain the SplendaCEST, we purchased Splenda from local market and prepared 0.1, 0.3 and 0.5% of Splenda solutions at pH 7.
Phantom imaging
High-resolution 1H NMR phantom experiments from
200 mM sucralose solution were performed on a verti-cal bore Bruker Avance DMX 400 MHz spectrometer (Bruker Corporation, Germany) equipped with a 5 mm PABBI proton probe using TR = 4 s and 128 averages. The proton MRS spectrum was gathered at different tem-peratures (5, 15, 25, and 37 °C).
The sucCEST imaging of phantom was performed on a 9.4 T, 30 cm horizontal bore magnet (Agilent, USA) interfaced to a Varian console, with a 20-mm volume coil (M2M Imaging, USA) using a custom-programmed GRE readout pulse sequence with a frequency selec-tive continuous wave preparation pulse for saturation. The sequence parameters were as follows: field of view (FOV) = 20 × 20 mm2, slice thickness = 10 mm, flip
angle (FA) = 15°, repetition time (TR) = 6.2 ms, echo time (TE) = 2.9 ms, matrix size = 128 × 128. Satura-tion was applied every 15 s and immediately followed by 128 segment acquisitions before a long delay to allow for T1 recovery. CEST images were collected using vari-able saturation lengths (1 through 3 s) and saturation pulse amplitudes (B1rms: 2.35, 3.5, 4.7, 5.9, 7, 8.2, 9.4, 10.6,
11.7 µT). For concentration and pH dependent studies, CEST images were collected using 1 s saturation pulse at B1rms of 7 µT for multiple frequencies (−3.6 to +3.6 ppm
in 0.2 ppm steps) from bulk water.
B0 and B1 field maps were also gathered and used
acquired from −1 to 1 ppm at step size of 0.2 ppm to find the spatial dependence of the frequency of water. This spatially-dependent frequency shift is then used to cor-rect the sucCEST z-spectra using a quadratic polynomial interpolation.
For B1 correction, two images were obtained using
preparation square pulses with duration (τ) and pre-scribed flip angles of 30° and 60°. The RF pulse amplitude for a 30° flip angle was used as the reference B1 or B1ref. B1
maps were generated by solving the equation:
where S (φ) and S (2φ) denote pixel signals in an image with preparation flip angle φ and 2φ respectively. From the flip angle map, a B1 field map can be obtained using
the relation, B1 = φ*(360τ)−1. B1 is then corrected
assum-ing a linear dependence of sucCEST contrast.
Rat tumor model preparation
To validate the sucCEST in vivo, 9L-gliosarcoma rat brain tumor model was used. It is well known that brain tumors disrupt the function of blood–brain barrier (BBB) locally in a nonhomogeneous manner [35]. The compro-mised BBB and enhanced permeability of tumor vascula-ture will enable the nonhomogeneous distribution of the injected sucralose in the tumor region.
To develop intracranial tumors, rat gliosarcoma cells (9L) were used. Syngeneic female Fisher rats (F344/ NCR, 4–6 weeks old) weighing 130–150 g were used as described previously [36]. General anesthesia was induced using 2% isoflurane mixed with 1 l/min oxy-gen followed by 1–2% isoflurane. A 10 µl suspension of 50,000 9L cells in PBS was injected into the cortex at a depth of 3 mm with a Hamilton syringe and a 30-gauge needle using stereotactic apparatus (3 mm lateral and 3 mm posterior to the bregma). 5 weeks after implanta-tion of tumor cells, the rats were subjected to MRI.
Rat MR imaging
Rats (n = 5) with brain tumors were anesthetized with isoflurane (3% for induction, 1.5% maintenance) and a polyethylene catheter (PE50) was inserted into the tail vein for sucralose injection. Rats were transferred to a 9.4 T horizontal bore small animal MR scanner (Varian, Palo Alto, CA) and placed in a 35-mm diameter commer-cial quadrature proton volume head coil (m2m Imaging Corp., Cleveland, OH). Rats were kept under anesthesia (1.5% isoflurane in 1 l/min oxygen) and their body tem-perature maintained at 37 °C with the air generated and blowing through a heater (SA Instruments, Inc., Stony Brook, NY). Respiration and body temperature were
cos(2φ)
cos(φ) =
S(2φ)
S(φ)
continuously monitored using an MR compatible small animal monitoring system (SA Instruments, Inc., Stony Brook, NY).
Fast-spin-echo T2 weighted MRI was performed prior to the CEST experiments to determine the slice positioning of glioma. The parameters for T2 weighted imaging were: TR = 8000 ms, TE = 50 ms, FA = 90°, echo train length = 16, number of slices = 12, slice thickness = 2 mm, FOV = 30 × 30 mm2, matrix
size = 128 × 128 and number of averages (NA) = 2. Following the whole brain T2 weighted brain imag-ing, a single slice 3 mm thick containing the tumorous region was acquired. This led to an in-plane resolution of 0.234 × 0.234 mm2. This same slice was used for all the
subsequent sucCEST and Gd-DTPA experiments.
Chemical exchange saturation transfer imaging of rat brain tumor was performed using similar pulse sequence parameters as the phantom imaging experiments except FOV 30 × 30 mm2 B
1rms = 2.35 µT, saturation
dura-tion = 2 s and T1 delay = 8 s, slice thickness = 3 mm, NA = 4. After baseline imaging, the rats were injected with 2 ml of 200 mM sucralose solution at a rate of 0.2 ml/min through a catheter inserted in a tail vein (for 10 min). Following sucralose administration, CEST imag-ing was performed every 30 min.
Gadolinium weighted imaging
Following the CEST imaging, a baseline T1-weighted image was acquired using the following parameters: FOV 30 × 30 mm2, TR = 6.22 ms, TE = 2.9 ms, FA = 20°,
slice thickness = 3 mm, and NA = 12. Gd-DTPA (100 µl, 287 mg/ml) was injected as a bolus in 5 s through tail vein and another T1-weighted image was acquired to see Gd enhanced signal in the glioma.
CEST image processing
First the acquired CEST weighted images were corrected for the B0 inhomogeneity and used to generate sucCEST
[magnetization transfer ratio asymmetry, (MTRasym)]
contrast map using Eq. [1].
where S−ve, S+ve, and S0 are the B0 corrected MR signals
at −1, 1 and 20 ppm, respectively. The CEST contrast map was further corrected for B1 inhomogeneity and
overlayed onto anatomical proton image as false colors. Regions of interests (ROIs) were manually drawn on tumor and normal appearing brain regions. All image processing and data analysis were performed using soft-ware routines written in MATLAB (R2015b) as described in details elsewhere [16, 24].
(1)
MTRasym(%)=100×
S−ve−S+ve
S0
Results
CEST effect from sucralose
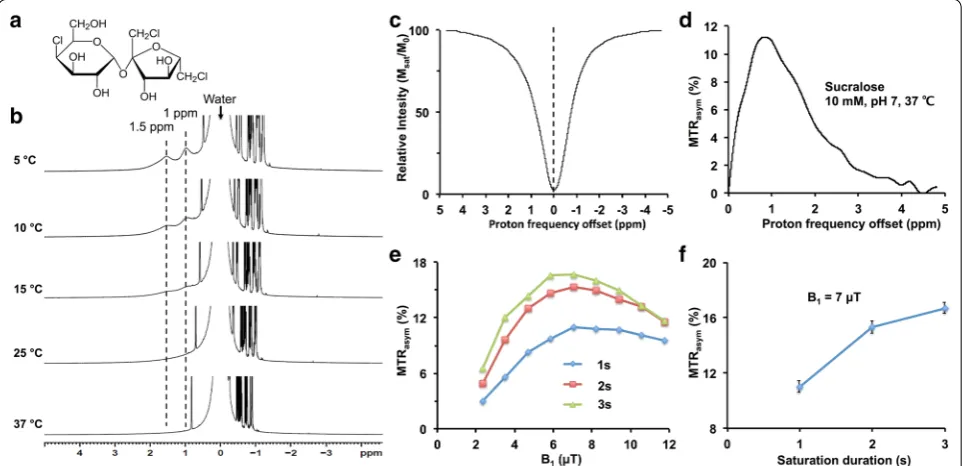
Sucralose, a chlorinated analog of sucrose, has five hydroxyl groups (–OH) that exchange with water protons in the solution (Fig. 1a). To determine the labile –OH proton resonance, high-resolution NMR spectra from a sucralose solution (200 mM, pH 7) were acquired at different temperatures (5, 15, 25, and 37 °C) on a 9.4 T NMR-spectrometer. At 5 °C, the spectrum showed two peaks at 1 and 1.5 ppm downfield to the water resonance in the NMR spectrum due to slower exchange of the – OH protons with water protons (Fig. 1b). With increase in temperature, both the hydroxyl peaks broadened due to the faster chemical exchange between the –OH pro-tons and water propro-tons until the –OH peaks became completely indistinguishable from baseline at 37 °C (Fig. 1b).
Z-spectra (Fig. 1c) and MTRasym curves (Fig. 1d)
from 10 mM sucralose solution (pH 7, 37 °C) showed a broad CEST effect between 0 and 3 ppm, which peaked at ~1 ppm downfield of water resonance. The sucCEST contrast (MTRasym at 1 ppm) from 10 mM sucralose
solution was measured at different pulse amplitudes (B1)
and durations of the RF saturation pulse to determine the optimal saturation parameters. For all the saturation durations, the maximum sucCEST contrast was observed at a B1 of 7 µT in the solution (Fig. 1e). Generally, the
sucCEST contrast increased with higher saturation dura-tion for a given B1 and started to level off after 2 s (Fig. 1f).
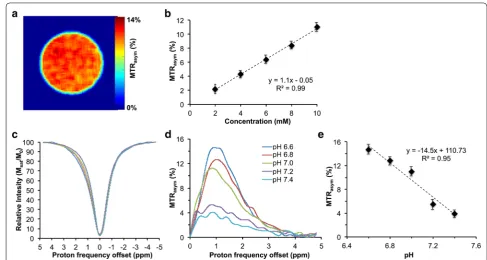
Concentration and pH dependence of sucCEST
The sucCEST map from 10 mM sucralose solution showed ~11% contrast at physiological temperature (37 °C) and pH (7) (Fig. 2a), and contrast was found to be linearly proportional to the sucralose concentration with a slope of 1.1% per mM of sucralose (Fig. 2b). Addition-ally, z-spectra and MTRasym plots for 10 mM sucralose
solution at different pHs (6.6, 6.8, 7.0, 7.2, 7.4), showed increased sucCEST contrast with decrease in pH (Fig. 2c, d). The sucCEST contrast increased 14.5% per unit decrease in the pH (Fig. 2e).
The phantom studies of Splenda showed a broad MTRasym which peaked at ~1.5 ppm downfield of the
water resonance. The Splenda CEST map generated at 1 ppm from 0.5% Splenda concentration showed ~20% contrast. The concentration-dependent graph showed a linear correlation of Splenda CEST contrast with Splenda concentration (Additional file 1: Figure S1).
SucCEST experiments with normal rat
In vivo study of sucCEST contrast from sucralose was evaluated in normal rats (n = 5) at 9.4 T horizon-tal bore MR scanner. CEST acquisitions with satura-tion frequency offsets from 0 to 3.6 ppm in step sizes of
Fig. 1 CEST effect from sucralose. a Chemical structure of sucralose shows the exchangeable –OH groups. b High resolution NMR spectrum of 200 mM sucralose solution in PBS shows two peaks from exchangeable hydroxyl protons (–OH) respectively at 1.0 and 1.5 ppm at 5 °C tempera-ture. The peaks broadened with increase in temperature and were completely broadened at 37 °C. c, d Z-spectra and MTRasym curves from 10 mM
of sucralose (pH 7, 37 °C) show broad resonance (0–3 ppm), which peaked around 1 ppm. e The dependence of sucCEST contrast on saturation power and duration. The optimal B1 for the sucCEST contrast in the phantom was 7 µT. f The graph shows sucCEST contrast from 10 mM sucralose
[image:4.595.58.540.425.658.2]0.2 ppm were used to generate z-spectra and MTRasym
maps from a coronal slice placed in the mid-brain region (Fig. 3a) with the following saturation pulse parameters: B1 = 2.35 µT, duration 2 s. In the baseline scans, ~3.5% contrast was observed at 1 ppm in the healthy rat brain (Fig. 3b). Following the baseline scans, sucralose (200 mM in PBS, pH 7) was injected intravenously (for 10 min, 0.2 ml/min) and CEST images from the rat brain were acquired at every 30-min time interval (Fig. 3c, d). SucCEST contrast was unchanged in the normal rat brain following sucralose administration suggesting that sucralose does not cross the intact BBB (Fig. 3e).
The MTRasym curves over an ROI placed over the brain
in the anatomical slice showed two peaks at 1 and 2 ppm downfield of water (Fig. 3f). The contrast at 1 ppm may be due to the endogenous –OH groups predominantly on glucose, myo-inositol or other metabolites containing hydroxyl protons [14, 17]. The 2 ppm peak in MTRasym
curve may be due to the –NH2 protons of creatine
pre-sent in the brain [15, 37]. The MTRasym curves obtained
pre- and post- administration of sucralose did not change (Fig. 3f), demonstrating that normal BBB is impermeable to sucralose.
SucCEST experiments with glioma rats
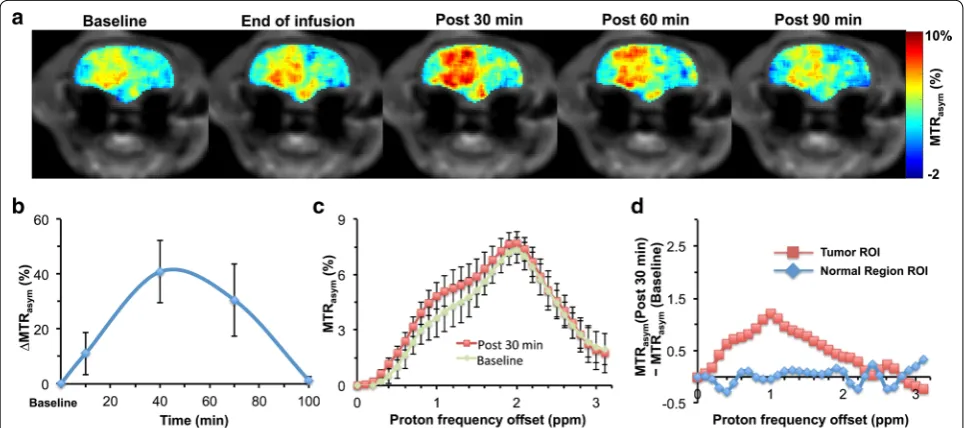
We evaluated the sucCEST contrast from sucralose in the 9L cell gliosarcoma rat brain tumor model (n = 5) in the
same way as the normal rats. The anatomical MR slice was obtained in the tumor region before the CEST acquisitions (Fig. 4a). Immediately following the sucralose adminis-tration, the sucCEST contrast was found to be higher in the tumor region (Fig. 4b). The maximum increase in the sucCEST contrast was observed at 30 min post injection, (4.8%) (Fig. 4a). The elevated sucCEST contrast returned to the baseline value ~90 min post infusion (Fig. 4a–c). However, in the normal-appearing brain region of these rats, sucCEST contrast did not change appreciably over the course of 90 min, again indicating that sucralose did not get into the healthy regions of the brain (Fig. 4d).
The MTRasym curves from tumor acquired pre- and
post sucralose injection clearly observed a difference at 1 ppm (Fig. 4c), indicating that the change in the CEST contrast is due to the sucralose accumulation in the tumor region. Additionally, there was no significant dif-ference between the asymmetry plots from the normal region of the brain pre- and post sucralose administra-tion (Fig. 4d).
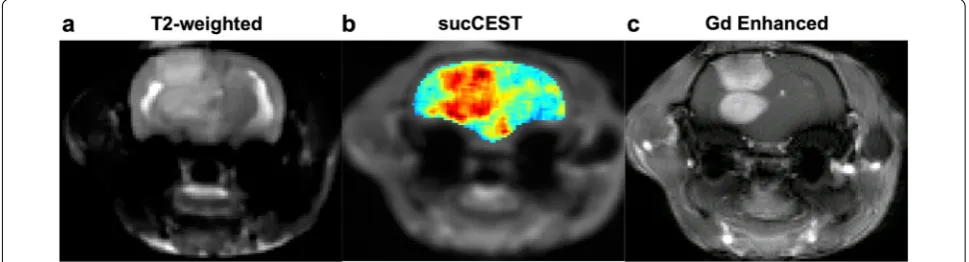
Qualitative comparison of sucCEST images with Gd‑enhanced images
The sucCEST maps provided both visual and quantita-tive detection of tumor in rat brain and were qualitaquantita-tively comparable with the Gd-DTPA enhanced images in the tumor region as shown in Fig. 5.
Fig. 2 SucCEST map of sucralose. a sucCEST map obtained from 10 mM sucralose phantom at 37 °C shows ~11% contrast. b The graph shows linear increase in the sucCEST contrast with increase in sucralose concentration. c, d Z-Spectra and MTRasym curves from different pHs show higher
[image:5.595.51.539.86.346.2]Fig. 3 SucCEST imaging in normal rat brain. a T2 weighted image of the 3-mm thick coronal brain slice in a normal rat brain. b Baseline sucCEST contrast map using parameters (B1 2.35 µT, duration 2 s). c, d The images show no appreciable change in the sucCEST contrast following the administration of sucralose in normal rats. e Plot of MTRasym (%) at 1 ppm from all the normal rats depicts no change in sucCEST in the normal brain.
f Baseline and 30 min post sucralose asymmetry curves show no observable change in the MTRasym curve at 1 ppm
[image:6.595.58.542.89.340.2] [image:6.595.57.540.414.628.2]Discussion
In the current study, we evaluated the use of the inex-pensive, non-caloric sweetener sucralose as an MRI contrast agent based on chemical exchange to image tumors in vivo. In the normal rat brain, no change in the sucCEST contrast was observed following intravenous injection of sucralose, suggesting that sucralose does not cross the BBB and therefore can be used to image BBB disruption. Increased sucCEST contrast was observed in the tumor region, which is presumably due to the accu-mulation of sucralose in the extravascular extracellular space (EES) of the tumor. The brain tumor compromises the BBB and allows sucralose to enter the tumor EES. SucCEST sensitivity of 1.1% per mM sucralose translates to a ~1000-fold higher sensitivity than the direct detec-tion with MRS, enabling the detecdetec-tion of millimolar concentrations.
Recently, d-glucose has been used as a CEST MRI con-trast agent to image cancers (glucoCEST) [17, 29]. How-ever, the interpretation of glucoCEST results might be intricate as the d-glucose is readily metabolized by both tumors and healthy tissue. Glucose analogues such as 2-deoxy-d-glucose (2-DG) and 2-fluoro-deoxy-d-glucose (FDG) were also shown to have higher CEST effect com-pared to glucose [31, 38]. This may be due to rapid con-version of glucose into lactate by the tumors [39] whereas 2-DG and FDG are not metabolized. As tumors are highly glycolytic, the injected glucose or pyruvate rap-idly metabolize into lactate. Using the recently developed LATEST method to measure CEST contrast from lactate [18], it may be possible to map the glycolytic behavior of tumors as well as probe the kinetics of LDH activity in tumor. Another glucose derivative, 3-O-methyl-glucose (3-OMG) has recently been used as an MRI contrast agent to image cancer in orthotopic xenograft of a mam-mary adenocarcinoma model [40]. 3-OMG is taken up rapidly and preferentially by the tumor cells and stored. This contrasts with 2-DG and FDG, which undergo
phosphorylation. Studies have shown that 3-OMG dif-fuses into normal brain tissue [30], though, limiting its use in the brain tumor imaging.
Unlike other CEST methods, sucCEST selectively high-lighted the tumor. As sucralose is not metabolized in the body, the tumor sucCEST kinetics may be governed by the wash-in/wash-out of sucralose. Although we dem-onstrated the sucCEST in the brain tumor model, the method can potentially be useful to image other types of tumors and to monitor anti-tumor drug efficacy.
Sucralose phantom studies showed the highest CEST effect for saturation parameters of 7 µT and 3 s duration in vitro. However, in vivo T2 of water in the brain is much shorter (~40 ms) [41]. Short T2 leads to a large direct sat-uration effect when using relatively large B1 amplitudes for saturation and can obscure the desired CEST contrast [42]. Hence, we optimized the saturation B1 amplitude and duration separately in vivo and found that 2.35 µT and 2 s RF saturation pulse gave reliable 1 ppm MTRasym
in the brain.
The acute and sub chronic toxicity effect of oral admin-istration of sucralose has been evaluated previously in animals, and no sucralose-related adverse effects were observed following the dietary administration of sucra-lose in mice (16 g/kg), rats (10 g/kg) and dogs (900 mg/ kg/day) [43]. Another study in human volunteers showed no adverse effect of acute or chronic oral dosage of sucra-lose [44]. These studies established that sucralose is non-toxic following high acute oral administration. While other studies reported no toxic effect of intravenous administration of sucralose at lower dosage (20 mg/kg) in mice and rats [45, 46], we are not aware of any published toxicity result at the intravenous administration dosage (500 mg/kg) used in the present study. In this preliminary study, we did not observe any adverse effect of intrave-nously injected sucralose in normal or tumor-bearing rats. However, immediately following the start of the infusion of sucralose, the respiration rate of the rats was
[image:7.595.56.541.567.698.2]found to increase by ~20 breath/min before getting back to the baseline rate in ~2 to 3 min. For the future stud-ies, the optimum concentration and the rate of injected sucralose may be explored.
We suggest that sucCEST with intravenous infusion of sucralose can serve as a diagnostic and therapeutic response monitoring tool in preclinical studies of tumors. While it is possible to use this method to study cancer patients at ultrahigh fields, more detailed toxicity stud-ies of intravenously administered sucralose are required before undertaking such studies.
Conclusion
This inexpensive, non-caloric sweetener can be readily used for routine examination of various tumors on ultra-high field MRI scanners based on contrast generated from the chemical exchange of its labile hydroxyl protons with water. In addition, it can potentially be used to study BBB derangements, noninvasively. This preliminary study paves the way for the development of sucralose and other sucrose derivatives as MRI contrast agents for a variety of human clinical imaging applications as well as to monitor therapeutic response.
Abbreviations
CEST: chemical exchange saturation transfer; PET: positron emission tomog-raphy; 18FDG: 18fluoro-2-deoxy-glucose; MRI: magnetic resonance imaging;
GBCA: gadolinium based contrast agents; MRS: MR spectroscopy; Gd_DTPA: gadolinium-diethylenetriamine pentaacetic acid; PBS: phosphate buffered saline; BBB: blood–brain barrier; OH: hydroxyl groups; MTRasym: magnetization
transfer ratio asymmetry; FOV: field of view; TR: repetition time; TE: echo time; FA: flip angle; NA: number of averages; ROIs: regions of interests; MTRasym:
magnetization transfer ratio asymmetry; EES: extravascular extracellular space; 2-DG: 2-deoxy-d-glucose; FDG: 2-fluoro-deoxy-d-glucose; 3-OMG:
3-O-methyl-glucose.
Authors’ contributions
PB, MH contributed to conception and design of the study, performed experi-ments, analyzed data and wrote the manuscript. FM, NEW and MDS contrib-uted to manuscript writing and editing, HH provided the technical support and helped with manuscript editing. RR provided conception and overall experimental design and contributed to manuscript writing and editing. All authors read and approved the final manuscript.
Author details
1 Department of Radiology, Center for Magnetic Resonance and Optical
Imag-ing, Perelman School of Medicine, University of Pennsylvania, 422 Curie Blvd, B1-Stellar-Chance Laboratories, Philadelphia, PA, USA. 2 Research Branch, Sidra
Medical and Research Center, Doha, Qatar.
Acknowledgements
We acknowledge Damodara Reddy for help with Animal Model preparation and Stephen Pickup for his technical assistance in using the 9.4 T animal MR
Additional file
Additional file 1: Figure S1. CEST imaging of Splenda. a, b Z-spectra and MTRasym curves show a broad asymmetry, which peaks at ~1.5 ppm.
c The CEST map from 0.5% Splenda shows ~20% contrast at 1 ppm. d SplendaCEST contrast was linearly proportional to the Splenda concentration.
scanner. We sincerely thank Dr. Marc A. Dichter and Dr. Halvor Jul for providing assistance with rat glioma model preparation.
Competing interests
The authors declare that they have no competing interests.
Availability of data and materials
Please contact author for data requests.
Ethics approval and consent to participate
All rat experiments were performed according to an approved Institutional Animal Care and Use Committee protocol.
Funding
This work was supported by the NIBIB under Grant No. P41 EB015893 and a grant from Sidra Medical and Research Center.
Publisher’s Note
Springer Nature remains neutral with regard to jurisdictional claims in pub-lished maps and institutional affiliations.
Received: 26 March 2017 Accepted: 19 May 2017
References
1. Zhu A, Lee D, Shim H. Metabolic positron emission tomography imaging in cancer detection and therapy response. Semin Oncol. 2011;38:55–69. 2. Schoder H, Larson SM. Positron emission tomography for prostate,
blad-der, and renal cancer. Semin Nucl Med. 2004;34:274–92.
3. Kubota K. From tumor biology to clinical pet: a review of positron emis-sion tomography (PET) in oncology. Ann Nucl Med. 2001;15:471–86. 4. Kubota K, Yokoyama J, Yamaguchi K, Ono S, Qureshy A, Itoh M, et al. FDG-PET delayed imaging for the detection of head and neck cancer recurrence after radio-chemotherapy: comparison with MRI/CT. Eur J Nucl Med Mol Imaging. 2004;31:590–5.
5. Chen W, Silverman DH, Delaloye S, Czernin J, Kamdar N, Pope W, et al. FDOPA PET imaging of brain tumors: comparison study with 18F-FDG PET and evaluation of diagnostic accuracy. J Nucl Med Off Publ Soc Nucl Med. 2006;47:904–11.
6. Schoder H, Gonen M. Screening for cancer with PET and PET/CT: poten-tial and limitations. J Nucl Med Off Publ Soc Nucl Med. 2007;48(Suppl 1):4S–18S.
7. Zhou Z, Lu ZR. Gadolinium-based contrast agents for magnetic reso-nance cancer imaging. Wiley Interdiscip Rev Nanomed Nanobiotechnol. 2013;5:1–18.
8. Kanda T, Fukusato T, Matsuda M, Toyoda K, Oba H, Kotoku J, et al. Gadolinium-based contrast agent accumulates in the brain even in subjects without severe renal dysfunction: evaluation of autopsy brain specimens with inductively coupled plasma mass spectroscopy. Radiol-ogy. 2015;276:228–32.
9. McDonald RJ, McDonald JS, Kallmes DF, Jentoft ME, Murray DL, Thielen KR, et al. Intracranial gadolinium deposition after contrast-enhanced MR imaging. Radiology. 2015;275:772–82.
10. Roberts DR, Holden KR. Progressive increase of T1 signal intensity in the dentate nucleus and globus pallidus on unenhanced T1-weighted MR images in the pediatric brain exposed to multiple doses of gadolinium contrast. Brain Dev. 2016;38:331–6.
11. Kanal E, Tweedle MF. Residual or retained gadolinium: practical implica-tions for radiologists and our patients. Radiology. 2015;275:630–4. 12. Gibby WA, Gibby KA, Gibby WA. Comparison of Gd DTPA-BMA (Omniscan)
versus Gd HP-DO3A (ProHance) retention in human bone tissue by inductively coupled plasma atomic emission spectroscopy. Invest Radiol. 2004;39:138–42.
• We accept pre-submission inquiries
• Our selector tool helps you to find the most relevant journal • We provide round the clock customer support
• Convenient online submission • Thorough peer review
• Inclusion in PubMed and all major indexing services • Maximum visibility for your research
Submit your manuscript at www.biomedcentral.com/submit
Submit your next manuscript to BioMed Central
and we will help you at every step:
14. Haris M, Cai K, Singh A, Hariharan H, Reddy R. In vivo mapping of brain myo-inositol. Neuroimage. 2011;54:2079–85.
15. Haris M, Singh A, Cai K, Kogan F, McGarvey J, Debrosse C, et al. A tech-nique for in vivo mapping of myocardial creatine kinase metabolism. Nat Med. 2014;20:209–14.
16. Cai K, Haris M, Singh A, Kogan F, Greenberg JH, Hariharan H, et al. Mag-netic resonance imaging of glutamate. Nat Med. 2012;18:302–6. 17. Walker-Samuel S, Ramasawmy R, Torrealdea F, Rega M, Rajkumar V,
Johnson SP, et al. In vivo imaging of glucose uptake and metabolism in tumors. Nat Med. 2013;19:1067–72.
18. DeBrosse C, Nanga RP, Bagga P, Nath K, Haris M, Marincola F, et al. Lactate chemical exchange saturation transfer (LATEST) imaging in vivo A bio-marker for LDH activity. Sci Rep. 2016;6:19517.
19. Haris M, Singh A, Reddy S, Bagga P, Kneeland JB, Tjoumakaris FP, Hariharan H, Marincola FM, Reddy R. Characterization of viscosupplementation formulations using chemical exchange saturation transfer (ViscoCEST). J Transl Med. 2016;14:92.
20. Sherry AD, Woods M. Chemical exchange saturation transfer contrast agents for magnetic resonance imaging. Annu Rev Biomed Eng. 2008;10:391–411.
21. Vinogradov E, Sherry AD, Lenkinski RE. CEST: from basic princi-ples to applications, challenges and opportunities. J Magn Reson. 2013;229:155–72.
22. van Zijl PC, Yadav NN. Chemical exchange saturation transfer (CEST): what is in a name and what isn’t? Magn Reson Med. 2011;65:927–48. 23. Haris M, Nanga RP, Singh A, Cai K, Kogan F, Hariharan H, et al. Exchange
rates of creatine kinase metabolites: feasibility of imaging cre-atine by chemical exchange saturation transfer MRI. NMR Biomed. 2012;25:1305–9.
24. Haris M, Singh A, Mohammed I, Ittyerah R, Nath K, Nanga RP, et al. In vivo magnetic resonance imaging of tumor protease activity. Sci Rep. 2014;4:6081.
25. Haris M, Nath K, Cai K, Singh A, Crescenzi R, Kogan F, et al. Imaging of glu-tamate neurotransmitter alterations in Alzheimer’s disease. NMR Biomed. 2013;26:386–91.
26. Crescenzi R, DeBrosse C, Nanga RP, Reddy S, Haris M, Hariharan H, et al. In vivo measurement of glutamate loss is associated with synapse loss in a mouse model of tauopathy. Neuroimage. 2014;101:185–92.
27. Zhou J, Payen JF, Wilson DA, Traystman RJ, van Zijl PC. Using the amide proton signals of intracellular proteins and peptides to detect pH effects in MRI. Nat Med. 2003;9:1085–90.
28. Bagga P, Crescenzi R, Krishnamoorthy G, Verma G, Nanga RP, Reddy D, et al. Mapping the alterations in glutamate with GluCEST MRI in a mouse model of dopamine deficiency. J Neurochem. 2016;139:432–9. 29. Chan KW, McMahon MT, Kato Y, Liu G, Bulte JW, Bhujwalla ZM, et al.
Natu-ral d-glucose as a biodegradable MRI contrast agent for detecting cancer.
Magn Reson Med. 2012;68:1764–73.
30. Jay TM, Dienel GA, Cruz NF, Mori K, Nelson T, Sokoloff L. Metabolic stabil-ity of 3-O-methyl-d-glucose in brain and other tissues. J Neurochem.
1990;55:989–1000.
31. Nasrallah FA, Pages G, Kuchel PW, Golay X, Chuang KH. Imaging brain deoxyglucose uptake and metabolism by glucoCEST MRI. J Cereb Blood Flow Metab. 2013;33:1270–8.
32. Xu X, Yadav NN, Knutsson L, Hua J, Kalyani R, Hall E, et al. Dynamic glucose-enhanced (DGE) MRI: translation to human scanning and first results in glioma patients. Tomography. 2015;1:105–14.
33. Timm KN, Kennedy BW, Brindle KM. Imaging tumor metabolism to assess disease progression and treatment response. Clin Cancer Res. 2016;22:5196–203.
34. Kim M, Gillen J, Landman BA, Zhou J, van Zijl PC. Water saturation shift referencing (WASSR) for chemical exchange saturation transfer (CEST) experiments. Magn Reson Med. 2009;61:1441–50.
35. Siegal T, Zylber-Katz E. Strategies for increasing drug delivery to the brain: focus on brain lymphoma. Clin Pharmacokinet. 2002;41:171–86. 36. Kim S, Pickup S, Hsu O, Poptani H. Diffusion tensor MRI in rat
mod-els of invasive and well-demarcated brain tumors. NMR Biomed. 2008;21:208–16.
37. Cai K, Singh A, Poptani H, Li W, Yang S, Lu Y, et al. CEST signal at 2 ppm (CEST@2 ppm) from Z-spectral fitting correlates with creatine distribution in brain tumor. NMR Biomed. 2015;28:1–8.
38. Rivlin M, Horev J, Tsarfaty I, Navon G. Molecular imaging of tumors and metastases using chemical exchange saturation transfer (CEST) MRI. Sci Rep. 2013;3:3045.
39. Warburg O. On the origin of cancer cells. Science. 1956;123:309–14. 40. Rivlin M, Tsarfaty I, Navon G. Functional molecular imaging of tumors
by chemical exchange saturation transfer MRI of 3-O-Methyl-d-glucose.
Magn Reson Med. 2014;72:1375–80.
41. de Graaf RA, Brown PB, McIntyre S, Nixon TW, Behar KL, Rothman DL. High magnetic field water and metabolite proton T1 and T2 relaxation in rat brain in vivo. Magn Reson Med. 2006;56:386–94.
42. Woessner DE, Zhang S, Merritt ME, Sherry AD. Numerical solution of the Bloch equations provides insights into the optimum design of PARACEST agents for MRI. Magn Reson Med. 2005;53:790–9.
43. Goldsmith LA. Acute and subchronic toxicity of sucralose. Food and chemical toxicology: an international journal published for the British Industrial Biological Research Association. 2000;38(Suppl 2):S53–69. 44. Baird IM, Shephard NW, Merritt RJ, Hildick-Smith G. Repeated dose study
of sucralose tolerance in human subjects. Food and chemical toxicology: an international journal published for the British Industrial Biological Research Association. 2000;38(Suppl 2):S123–9.
45. John BA, Wood SG, Hawkins DR. The pharmacokinetics and metabolism of sucralose in the mouse. Food Chem Toxicol. 2000;38(Suppl 2):S107–10. 46. Sims J, Roberts A, Daniel JW, Renwick AG. The metabolic fate of sucralose