1
< BACK TO CONTENTS >Examining the
effectiveness of support
for UK wave energy
innovation since 2000
Lost at s
ea or a
new w
ave of
innov
ation?
Table of contents
4 Methodology ... 18
4.1 Qualitative ... 19
4.1.1 Industry expert interviews ... 19
4.1.2 Documentary analysis ... 19
4.2 Quantitative ... 19
4.2.1 UK marine energy RD&D public grant database ... 19
4.2.2 Scientific publications ... 20
4.2.3 Patents ... 20
4.2.4 Global marine energy installed capacity database ... 21
4.2.5 Test facilities ... 21
5 Mapping the structure and evolution of the UK’s wave energy innovation system ... 22
5.1 Actors ... 23
5.1.1 Knowledge and education ... 25
5.1.2 Industry actors... 25
5.1.3 Government and non-departmental public bodies ... 27
5.1.4 Supporting organisations ... 29
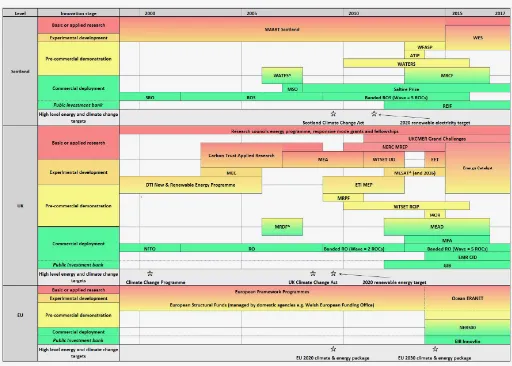
5.2 Institutions ... 30
5.2.1 EU ... 32
5.2.2 UK ... 33
5.2.3 Scotland ... 36
5.3 Networks ... 39
5.3.1 Scientific and educational networks ... 41
5.3.2 Industry networks ... 43
5.3.3 Government networks ... 43
5.4 Technology and infrastructure ... 45
5.4.1 Complementary technologies ... 46
5.4.2 Wave energy test infrastructure ... 46
Executive summary ... iii
Overview and key findings ... iii
Rationale ... v
Research questions and methodology ... v
Key findings... vi
Structure and evolution of the UK wave energy innovation system ... vi
UK wave energy innovation performance ... vii
Structural drivers of and barriers to wave energy innovation ... ix
Policy recommendations ... xiii
Wider lessons for supporting energy technology innovation ...xv
Recommendations for future research ...xvii
List of figures ... xix
List of tables ... xxi
List of acronyms and abbreviations ... xxii
1 Introduction ...1
1.1 Rationale ...2
1.2 Research questions ...3
1.3 Structure of this report ...3
2 Literature review: fundamentals and drivers of wave energy technology innovation ...4
2.1 Fundamentals of wave energy technology ...5
2.2 Drivers of wave energy technology innovation ...9
3 Analytical framework ... 10
3.1 Step 1 – mapping the structure and evolution of the TIS ... 12
3.2 Step 2 – measuring performance of TIS functions ... 12
3.3 Step 3 – structure–function analysis of innovation inducement and blocking mechanisms ... 16
3.4 Contribution to wider TIS literature ... 17
< BACK TO CONTENTS > II
6 Assessing wave energy innovation system
performance ... 50
6.1 Knowledge development ... 56
6.1.1 Number of scientific publications ... 56
6.1.2 Number of scientific publication citations ... 56
6.1.3 Patents ... 57
6.2 Knowledge exchange ... 58
6.2.1 Inter-organisational connectivity ... 58
6.2.2 International collaboration ... 58
6.2.3 Cross-sectoral fertilisation ... 60
6.2.4 University–industry connectivity ... 60
6.3 Entrepreneurial experimentation ... 62
6.3.1 Convergence around a single device design ... 62
6.3.2 Rated power capacity ... 65
6.3.3 Levelised cost of electricity ... 68
6.4 Guidance of the search ... 68
6.4.1 Wave energy technology foresight reports ... 68
6.5 Resource mobilisation ... 70
6.5.1 Financial resources ... 70
6.5.2 Human resources ... 73
6.6 Market formation ... 75
6.6.1 Number of wave energy developers... 75
6.6.2 Installed capacity ... 75
6.7 Legitimation ... 76
6.7.1 Government support for marine energy ... 76
6.7.2 Public support for wave energy ... 78
7 Blocking and inducement mechanisms of wave energy innovation ... 79
7.1 Actors ... 80
7.1.1 Technology developer capabilities ... 82
7.1.2 Supply chain capabilities ... 83
7.1.3 Entry of market incumbents ... 84
7.1.4 Government policy learning ... 85
7.2 Institutions ... 86
7.2.1 Sustained early- to mid-stage RD&D support ... 88
7.2.2 Long-term strategy for wave energy innovation ... 89
7.2.3 High-level RD&D support ... 90
7.2.4 Critical assessment of technological potential ... 92
7.3 Networks ... 94
7.3.1 Inter-actor collaboration ... 96
7.3.2 Industry–science collaboration ... 97
7.3.3 International collaboration ... 98
7.3.4 Inter-governmental coordination and knowledge exchange ... 99
7.4 Technology and infrastructure ...100
7.4.1 Technological characteristics and cross-fertilisation ...102
7.4.2 Marine energy test infrastructure ...103
8 Conclusions and policy recommendations ...106
8.1 Synopsis ...107
8.2 Key findings ...107
8.3 Policy recommendations ...109
8.4 Wider lessons for supporting energy technology innovation ...110
8.5 Recommendations for future work ...112
8.5.1 Wave and marine energy innovation ...112
8.5.2 Energy technology innovation ...113
Acknowledgements ...114
References ...115
Appendix A – List of interviewees ...129
Appendix B – Breakdown of technology innovation chain ...130
Appendix C – List of major UK-eligible public funding programmes for wave energy innovation ...131
Appendix D – List of major wave energy test tanks ...134
Almost 20 years after the UK’s first wave energy innovation programme came to an end in the
1980s, a new programme to accelerate the development of wave energy technology was launched.
It was believed that wave energy could play a central role in helping to deliver a low-carbon,
secure and affordable energy system, as well as provide an important boost to the UK economy
through the growth of a new domestic industry. However, despite almost £200m of public funds
being invested in UK wave energy related innovation since 2000, wave energy technology remains
some distance away from commercialisation. Consequently, this report examines the extent to which
the failure to deliver a commercially viable wave energy device can be attributed to weaknesses in
both government and industry’s support for wave energy innovation in the UK.
A summary of the key findings is presented below.
Executive summary
Overview and key findings
n
Wave energy’s failure to reach market
can, in part, be attributed to weaknesses
in government and industrial strategy to
support wave energy innovation in the UK,
most notably a premature emphasis on
commercialisation and a lack of knowledge
exchange.
n
These weaknesses have resulted in a poor
performance against some key innovation
indicators. Examples include market leaders
entering administration (e.g. Pelamis),
a fall in installed and rated capacity of
devices, and a lack of convergence around a
dominant device design.
n
The downturn in UK wave energy innovation
performance led to multi-national
incumbents (e.g. energy utilities, Original
Equipment Manufacturers (OEMs)) and
investors withdrawing from the sector. This
led to a concerted effort from the public
sector to learn from past policy mistakes via
knowledge capture initiatives, led primarily
by the Scottish Government.
n
Policy learning resulted in a reconfiguration
of the UK’s wave energy innovation system
in a bid to address these issues. Changes
included a re-design of government RD&D
programmes, the formation of new actor
networks and the commissioning of
world-class test infrastructure. These changes
have already yielded some positive trends
in measurable innovation performance
(e.g. knowledge exchange), however, the
full impact of this reconfiguration has yet
to emerge.
n
Today, the UK is home to an innovation
< BACK TO CONTENTS > EXECUTIVE SUMMARY IV Overview and key findings
This report examines the extent
to which the failure to deliver a
commercially viable wave energy
device can be attributed to
weaknesses in both government and
industry’s support for wave energy
innovation in the UK.
Rationale
The report responds to a gap in the literature, by providing an up-to-date, mixed-method and systematic analysis of the UK’s wave energy innovation system, examining its structure, performance, drivers and barriers over a 17-year period since 2000. The report’s findings are aimed primarily at government and industry in a bid to help improve the effectiveness of future wave energy innovation support in the UK and accelerate the technology’s journey towards commercialisation. Importantly, lessons are drawn from the case study of wave energy to help inform the design and improve the efficacy of energy innovation policy more broadly. It is hoped that these lessons will shape the UK’s low-carbon energy innovation strategy and help it meet its Paris Agreement commitment to limit global temperature rise this century below 2oC above pre-industrial levels.
Research questions
and methodology
The research does not assess the technical feasibility of wave energy technology nor consider whether wave energy should be a priority for UK RD&D funding. Instead it examines the effectiveness of UK innovation support between 2000 and 2017, focusing on the following five questions:
1. How is the UK’s wave energy innovation system
structured and how has it evolved?
2. How well has the UK’s wave energy innovation system
performed and how has its performance changed over time?
3. Which factors have supported and undermined wave
energy innovation in the UK?
4. What actions could be taken by the UK to accelerate
wave energy innovation in the future?
5. What lessons can we learn from the case of UK wave
energy innovation to help support innovation of other energy technologies?
It utilises a Technology Innovation System (TIS) framework to guide the analysis of how the UK’s wave energy
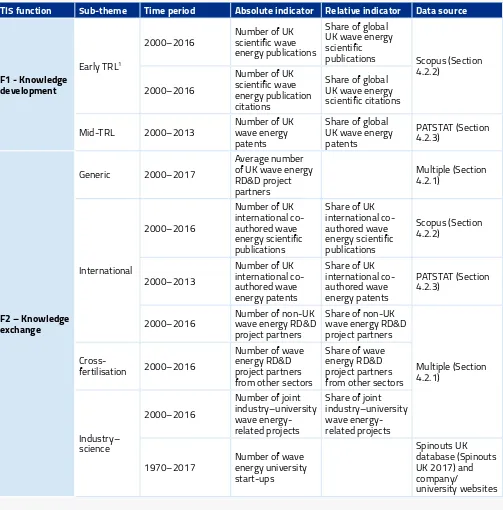
innovation system’s structure and performance evolved during the period since 2000, and crucially the factors responsible for shaping these changes. To mobilise this framework, the analysis utilises a combination of quantitative (e.g. patents, bibliometrics, public RD&D grants) and qualitative data (e.g. expert interviews, documentary evidence). Innovation performance is measured via a set of 22 indicators, measuring both absolute and relative changes in wave energy innovation performance, the latter situating performance against other countries or energy technologies as a benchmark. Each indicator is coupled with one of the seven TIS functions outlined in Table 1.
The report’s findings are aimed
primarily at government and
industry in a bid to help improve
the effectiveness of future
wave energy innovation support
in the UK and accelerate the
technology’s journey towards
commercialisation.
< BACK TO CONTENTS > VI
Table 1:Description of TIS functions
TIS Function Description
F1 – Knowledge
development The creation of technological variety achieved by a broadening and deepening of a codified knowledge
1 base via research and development (R&D).
F2 – Knowledge
exchange Exchange of information between actors facilitated by inter-actor networks. F3 – Entrepreneurial
experimentation Entrepreneurs recognise the latent value proposition of emergent technologies and seek to realise this potential via commercial experiments. These experiments typically generate a form of tacit knowledge and in turn reduce the degree of uncertainty associated with a technology, either through success or failure.
F4 – Guidance of the
search Pressures that encourage actors to enter a technological field and subsequently guide the stage and focus of innovation activities they undertake, such as policy targets and technology roadmaps.
F5 – Resource
mobilisation Mobilisation of financial, human and physical resources critical to the technology innovation process. F6 – Market formation Mechanisms that create niche markets or ‘protected spaces’ enabling technologies to compete against
initially superior incumbent technologies in order to boost levels of adoption, such as favourable tax regimes or new industry standards.
F7 – Legitimation The act of granting legitimacy to an emerging technology by strengthening its ‘fitness’ with the prevailing institutional regime. TIS actors seek to achieve this by shaping existing institutions to galvanise support for this new technology amongst actors, for example via political lobbying.
1 Codified knowledge means ‘reproducible, transparent, accessible knowledge documented or enshrined in blueprints, manuals, or sets of instructions’ (Wilson & Grübler 2014 p.17).
Key findings
Structure and evolution of the UK wave energy
innovation system
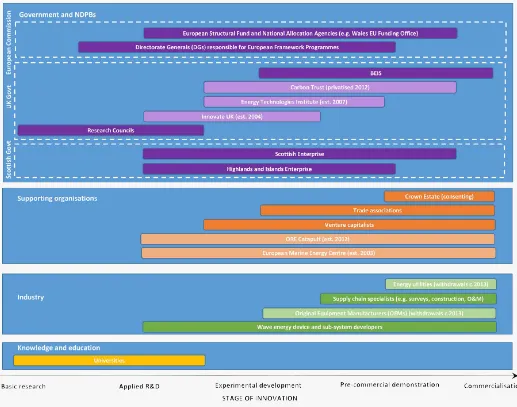
We consider the evolution of the UK wave energy innovation system in relation to four structural elements of a TIS: actors, institutions, networks and technology/
infrastructure.
Analysis of the wave energy actor landscape identifies a wealth of world-class universities, a burgeoning supply chain and a wide range of government, NDPB and other supporting organisations (e.g. test facilities, trade associations) offering support across the entire innovation chain. Importantly, we find that many important additions have been made to the actor landscape since 2000, such as the introduction of new funding bodies with a strong focus on mid-stage energy innovation support previously missing in the UK (e.g. Energy Technologies Institute (ETI)). The European Marine Energy Centre (EMEC) was also established in 2003, which has played a key role in assisting technology demonstration, knowledge capture
and developing industry standards. However, we also find that some actors have exited the sector, most notably OEMs and energy utilities during the early 2010s, who no longer viewed wave energy as an investment priority. Turning to institutions, we find an extremely complex wave energy innovation policy landscape, managed by numerous different funding agencies across three levels of government (Scotland, the UK and the EU). This landscape has also been fast changing, with a succession of new schemes emerging, each with their own eligibility criteria and objectives. An important change has been the clear shift from commercially focused, full-scale device RD&D programmes in the mid-2000s and early 2010s, some with an explicit focus on arrays (e.g. Marine Energy Array Demonstrator (MEAD)), to innovation programmes supporting early-stage development through to large-scale prototype demonstration (e.g. Wave Energy Scotland
(WES)). Many of these policy changes have unfolded against a backdrop of ambitious, high-level energy and climate change commitments from government, creating an imperative for such action.
With respect to actor networks the research finds a long-standing presence of scientific and industry networks since the early 2000s, whilst networks co-ordinating test facility, training and government activities were much slower to form. Following the formation of these networks, innovation system actors are much better connected than they were 15 years ago, offering linkages both nationally and internationally. Furthermore, the growth in the number and diversity of networks has meant that networks now offer excellent coverage across six key intermediary functions, ranging from: 1) relationship building, 2) capacity building, 3) knowledge transfer, 4) technology foresighting, 5) RD&D co-ordination and 6) policy advocacy. There is, however, some evidence of overlapping networks (e.g. trade associations, centres for doctoral training (CDTs), signalling some duplication of resources.
Finally, turning to infrastructure, the research identifies a very clear progression in the capabilities of wave energy test facilities with the introduction of large-scale multi-directional wave tanks (e.g. FloWaveTT), as well as part-, full- and array-scale open-ocean test facilities (e.g. EMEC, WaveHub). With regards to technology, the research finds that wave energy exists alongside a wide range of mature energy (e.g. offshore wind) and non-energy technologies (e.g. shipping, aviation, offshore construction), offering a small number of valuable opportunities for cross-fertilisation.
UK wave energy innovation performance
The study finds that UK wave energy innovation performance was measurably stronger against most indicators in the second half of the period since 2000 (c. 2008–2016) than the first (c. 2000–2007) both in absolute and relative terms but that performance has started to decline in recent years across some of these indicators, such as number of patents and level of installed capacity. Looking across the whole period since 2000, performance was strongest in terms of knowledge development (F1),
knowledge exchange (F2) and resource mobilisation (F5)
and weakest against entrepreneurial experimentation
(F3) and market formation (F6), with a mixed performance
against guidance of the search (F4) and legitimation (F7). The UK performed strongly in terms of knowledge
development (F1), as an international leader in scientific
publications and wave energy patents. Despite being a global leader in wave energy patents the UK did witness a significant decline in total patents from 2010 and a reduction in its share of global wave energy patents since 2005. The UK also performed strongly in terms of
knowledge exchange (F2), with an increase in the average
number of wave energy project partners, as well as an increase in the number of projects with partners from both industry and science, and from outside the wave energy sector, evidencing cross-fertilisation.
The UK also performed strongly in terms of resource
mobilisation (F5), with funding in the second half of the
period almost four times higher than the first in real terms. Furthermore, the UK Government’s budget for ocean energy RD&D as a share for all renewables also grew to 31% in 2014, up from a 19% average share during the period. Human resources also measured strongly, with a large number of higher education engineering degrees, although half of the companies engaged in publicly funded wave energy projects since 2000 had fewer than 50 employees, suggesting a large number of small companies working in the sector with relatively few staff and
< BACK TO CONTENTS > VIII
The UK performed poorly in terms of market formation (F6) with the number of wave energy developers steadily falling from 30 in 2011 to 24 in 2016, with 14 developers filing for administration during this time, including market leaders Pelamis and Aquamarine Power. The other indicator is cumulative installed capacity, which, despite growing from 0.5MW in 2008 to 3.6MW in 2012, dropped to 0.7MW in 2016. Both indicators suggest a shrinking market.
The UK also performed poorly in terms of entrepreneurial experimentation (F3), with a clear divergence of technology design rather than a convergence identified through RD&D grants (Figure 1) and installed capacity. There was also little evidence of technology maturation with the average rated capacity of devices falling by 56% in the second half of the period versus the first and wave energy’s levelised cost of electricity (LCOE) growing from 2009 and remaining very high compared to other renewables.
Figure 1: Share of RD&D funding committed to different wave energy device designs 2000–2017 (source: author)
NOTE: Funding for 2017 only for grants up to 1st June 2017. Covers both experimental development and demonstration.
EXECUTIVE SUMMARY
The research found a mixed performance in terms of the
guidance of the search (F4). The analysis identified an
increase in the number of foresight reports in recent years, albeit with a shift in focus from later stage demonstration and commercialisation to more fundamental
experimentation. However, in parallel, explicit government targets for wave energy deployment have steadily reduced in ambition before being removed altogether by the UK Government.
Legitimation (F7) of wave energy technology also
exhibited a mixed performance. Whilst there was a large number of UK government publications (e.g. white papers, parliamentary reports) calling for the need to support wave energy, there was a clear change in direction from the early 2010s, with a removal of formal wave energy deployment targets and a decline in vocal support from government ministers. This was at odds with the UK general public’s support for wave and tidal energy, which averaged 74% since 2012, greater than the figure for onshore wind (67%) and equal to that for offshore wind (74%).
Structural drivers of and barriers to wave
energy innovation
The study considered the structural mechanisms that have served to block or induce wave energy innovation in the UK. We categorise these drivers and barriers according to four structural dimensions: actors, institutions, networks and technology/infrastructure.
Actors
Knowledge exchange (F2) was hindered by a lack of
knowledge codification, meaning that knowledge generated from RD&D projects remained tacit and was limited to the experiences of their staff rather than the wider sector. However, investments in knowledge capture schemes and a requirement to licence intellectual property (IP), for example via Scotland’s WES, have helped to address this problem. These efforts to learn from past experience, coupled with a government capacity to translate learning into policy actions, have led to wide-ranging structural changes to the UK’s wave energy innovation system, albeit mostly constrained to efforts led by the Scottish Government.
The limited breadth of technical and business expertise, linked to the very small size of UK wave energy developers, has negatively impacted on their capacity for knowledge development (F2) and entrepreneurial experimentation (F3). This was exacerbated by a culture of undertaking most activities in-house because of a desire to build up internal capabilities and the view that some highly specialised activities could be outsourced to the wider supply chain. Even so, the UK wave energy supply chain was overall considered to be strong, underpinned by a steady supply of skilled personnel and centred around the formation of niche markets (e.g. off-grid islands, aquaculture) and test facilities (e.g. the EMEC). Nonetheless, intermittent funding and the lack of a long-term strategy were considered to have led to a leakage of skilled personnel outside the sector. Human and financial resources were also dramatically improved and then subsequently reduced by the entry and exit of market incumbents (e.g. energy utilities, OEMs). They had been enticed in part by the introduction of market–pull mechanisms but lost confidence in wave energy following a lack of technological progress against initial expectations.
Institutions
< BACK TO CONTENTS > X
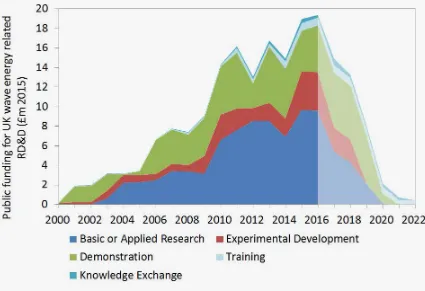
Figure 2: UK public RD&D funding for wave energy-related projects by innovation stage since 2000 (source: author)
NOTE: Includes RD&D activity explicitly related to wave energy or cross-cutting marine energy. Excludes test infrastructure. RD&D grants covered up to 1st June 2017.
Another issue was that a large proportion of the UK’s budget for wave energy RD&D went unspent because developers could not meet over-ambitious funding criteria and/or struggled after the financial crisis to secure the necessary private sector match funding required to access these public funds. Finally, financial resources (F5) were channelled away from wave and towards more mature technologies because of wave energy RD&D grant funding being bundled with tidal energy and long-term revenue payments with other renewables such as offshore wind for Contracts for Difference (CfDs). To address this, an explicitly wave energy-focused, 100% funded, earlier stage innovation programme called WES was established, with an objective and transparent stage-gated funding allocation procedure. Finally, the lack of a long-term strategy for wave energy innovation (guidance of the search (F4)) was blamed on a combination of short-term public
spending review periods and a lack of political commitment to foresight reports (e.g. roadmaps), due to a lack of consensus building and detail relating to next steps.
Networks
Actor knowledge exchange (F2) was considered to be constrained by a combination of: (1) a culture of developers operating secretively in order to protect IP; (2) the
UK’s decentralised model of innovation that prioritises competition over collaboration; and (3) a strong focus on device-level innovation funding, which removed the incentive for actors to develop common solutions to shared problems. Again, steps were taken to address these issues – for example, WES imposed a requirement on awardees to licence their IP, share lessons and formulate consortia in order to be awarded funds.
Industry–science collaboration was constrained by fundamental differences in the working cultures and timeframes adopted by the two communities, as well as a lack of joint industry–science funding that offered a jointly acceptable working arrangement. The introduction of funding for joint science projects (e.g. WES, Energy Catalyst (EC)) and the establishment of CDTs offering industrial placements to students have helped to address these issues.
International collaboration was considered to be undermined by a belief that the UK could tackle the wave energy challenge alone as a leader of wave energy, as well as a perceived bias towards domestic wave technology. However, funding schemes either demanded or encouraged the formation of international consortia (e.g. EU Horizon2020) have helped to promote international collaboration.
Cross-government co-ordination was generally considered to be weak, resulting in a poorly co-ordinated policy landscape encouraging resource duplication and lack of a clear pathway to market. Instead, numerous different RD&D schemes were being delivered simultaneously by different funding agencies at three different levels of government (devolved administrations, UK and EU), often with overlapping remits. This was in part linked to the lack of an effective central cross-government body responsible for co-ordinating wave energy or energy innovation more broadly, although new bodies have since been formed to improve levels of co-ordination (e.g. the Energy Innovation Board (EIB)).
Technology and infrastructure
The unique characteristics of wave energy technology were considered to have slowed down its innovation journey, most notably developers’ conservative approach to testing in a very hostile ocean environment and a limited number of weather windows for testing. Furthermore, whilst levels of cross-fertilisation increased following a concerted effort to harness lessons from other sectors (e.g. automotive, materials science, commercial shipping and defence) via programmes such as WES, overall, wave energy was considered to represent a fundamentally new technological challenge that shared relatively few overlaps with established technologies.
Turning to infrastructure, the UK’s wave energy test facilities were considered to be the best in the world. However, concerns were raised about the cost of accessing these facilities and the in-built bias of some facilities towards particular device designs. The biggest barrier raised was the lack of test facilities filling the gap between testing of very small-scale and full-scale devices. However, the introduction of state-of-the-art new generation wave tanks (e.g.
[image:12.595.275.558.527.740.2]FloWaveTT) and open-ocean part-scale ‘nursery’ test sites (e.g. the EMEC’s Scapa Flow) were considered to have filled this gap, with UK facilities now offering excellent coverage across the entire innovation chain (Figure 3).
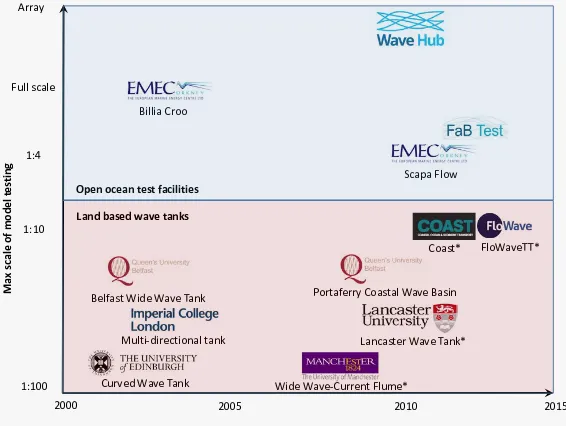
Figure 3: Evolution of land-based wave tanks and open-ocean test facilities since 2000 (source: author)
NOTE: Selection of facilities is for illustrative purposes and does not include all test tanks constructed during this period.
* Facilities that also have tidal current generation capability 2000
M
ax
sc
al
e o
f m
ode
l t
es
ting
1:100 Full scale
2005 2010 2015
Curved Wave Tank Billia Croo
Scapa Flow
Multi-directional tank
Wide Wave-Current Flume* Portaferry Coastal Wave Basin
FloWaveTT* 1:10
Open ocean test facilities
Land based wave tanks
Coast*
Belfast Wide Wave Tank
Lancaster Wave Tank* Array
< BACK TO CONTENTS > XII
The introduction of state-of-the-art wave
tanks (e.g. FloWaveTT) and open-ocean
part-scale nursery test sites (e.g. EMEC’s
Scapa Flow) were considered to have
addressed the need for mid-TRL test
facilities, with these now offering
excellent coverage across the entire
innovation chain.
EXECUTIVE SUMMARY Key findings
Policy recommendations
In light of the research’s key findings, we present ten policy recommendations to help improve the effectiveness of the UK’s future support for wave energy innovation and help accelerate the technology’s journey towards commercialisation.
4. Improve co-ordination of UK energy innovation policy landscape – There are still significant
opportunities to improve the degree of co-ordination of wave energy RD&D support both within and across different levels of government. It remains to be seen how effective the UK’s newly formed EIB and UKRI will be in co-ordinating energy RD&D investment at UK level. It is recommended that, to ensure co-ordination with bodies operating at different levels of government, these new networks engage closely with both the devolved administrations (e.g. the Scottish Government) and the EU. Furthermore, a top-down body responsible for wave energy at UK level, similar to Scotland’s WES model, could also improve co-ordination of wave energy RD&D.
5. Share and synthesise lessons from past and present wave energy innovation programmes – Outputs
from publicly funded later stage wave energy RD&D projects have not traditionally been made available for public consumption because of issues around IP protection and private sector match funding. In contrast, the Scottish Government’s WES programme and the EU’s FPs require awardees to share their key findings via project reports, enabling the wider sector to learn lessons from past projects and avoid making the same mistakes. It is critical that this approach is applied across all future publicly funded wave energy RD&D programmes in the UK and efforts should also be made to capture knowledge generated from past public RD&D projects, expanding upon WES’s current knowledge capture exercise.
2 Through Mission Innovation, 22 countries and the EU are taking action to double their public clean energy R&D investment over five years. In addition, Mission Innovation members encourage collaboration among partner countries, share information and co-ordinate with businesses and investors.
1. Retain access to EU innovation funding post-Brexit
– Brexit poses a major risk to EU wave energy funding, accounting for 27% (£53m) of all wave energy-related RD&D committed since 2000, and in 2016 EU funding (£6.3m) was greater than that from the UK Government (£6m). It is essential that the UK retains access to EU innovation funds following Brexit negotiations, especially EU Framework Programmes (FPs) (i.e. Horizon2020). Exiting from the EU will also remove the UK’s primary platform for international RD&D collaboration, making it necessary to identify alternative ways to collaborate internationally to achieve the critical mass of resources and expertise necessary to commercialise wave energy, possibly via new international platforms such as Mission Innovation.2
2. Allow time for new UK wave energy innovation policy landscape to take effect – The UK wave
energy innovation system has undergone a major reconfiguration over the past few years and the effects of this have not yet been fully felt. This new configuration must be given time to take effect before its efficacy is critiqued and decisions made to engage in any additional wide-scale restructuring.
3. Develop a long-term Scottish wave energy strategy in a new political order – With the UK Government
< BACK TO CONTENTS > XIV
6. Acknowledge that support for wave energy has been historically low and intermittent – Since 1974,
ocean energy has been allocated approximately $1.8bn3 of IEA members’ public energy RD&D
budget versus $25bn for solar PV and $7.5bn for wind energy. Furthermore, funding for wave energy has been much more intermittent than most other energy technologies, split across two phases during the 1970s and 1980s and the 2000s and 2010s, increasing the likelihood of significant knowledge depreciation between these periods of concentrated investment. In this context, key policy decisions should be made against the backdrop that wave energy has not enjoyed the same level or consistency of RD&D support in comparison to more mature renewables such as wind and solar energy.
7. Avoid competition for subsidies with established low-carbon energy technologies – Emerging
technologies, such as wave energy, can be out-competed for subsidies on a cost basis when in direct competition with significantly more mature technologies. Specific examples include separating wave energy from the same EMR CfD allocation as significantly cheaper technologies such as offshore wind energy and avoiding wave energy becoming bundled into wider marine energy RD&D programmes where it must compete with more mature
technologies such as tidal range and tidal stream.
8. Avoid need for private sector match funding to support wave energy RD&D – The need to secure
private sector investment to be awarded public grants has placed intense pressure on wave energy developers to ‘fast track’ their innovation timeline and avoid knowledge exchange in a bid to protect their IP. Furthermore, the financial crisis and wave energy’s slow progress saw private sector funds become more difficult to secure, in turn making access to public funds difficult. State aid compliant procurement frameworks such as WES can avoid the need for private sector match funding, offering a 100% intervention rate. Opportunities should be explored to apply this procurement model more widely, not just for wave but for other energy technologies.
9. Support wave energy niche market formation – A
shift towards demonstrating wave energy devices in niche markets (e.g. off-grid islands, aquaculture) enables developers to learn valuable lessons through ‘learning by doing’ in both real-world ocean and market environments, as well as providing both government and investors with greater confidence in the technology’s prospects. When wave energy is ready for full-scale demonstration, funds for wave energy RD&D should facilitate deployment in ‘real-world’ niche markets. However, funds should be awarded to developers that present an evidence-based roadmap that outlines how their technology can progress beyond small-scale niche application and towards wide-scale deployment.
10. Enable easy access to wave energy test facilities
– Access to the UK’s world-class test facilities has required developers to secure public sector funds via open competitions, and the corresponding levels of private sector match funding. This process involves significant time and effort, channelling developers’ resources away from RD&D. To ensure developers can quickly and easily access these facilities, a state aid compliant UK-wide ‘innovation voucher’ scheme should be established to enable ‘free at the point of use’ access to those that have passed through preliminary stage-gated phases of development with independently verified positive results, building upon lessons learnt from the Europe-wide est infrastructure access schemes such as FORESEA and MARINET.
3 Includes all forms of ocean energy, not just wave energy.
Wider lessons to support
energy technology innovation
We draw a number of broader lessons from the case of UK wave energy innovation in order to improve our understanding of how energy technology innovation unfolds and how it can best be supported. This will help to inform both the design of energy innovation policy and development of innovation theory.
1. Innovation systems can become destabilised and reconfigured – Traditionally, TIS evolution has been
considered to follow a broadly linear and positive development trajectory, incorporating two main phases: formation and growth (Bergek, Jacobsson, et al. 2008a). The case of wave energy highlights how a TIS may indeed follow a non-linear and more challenging development path involving distinct phases such as: (1) disintegration, in the face of destabilising forces such as the failure of market leaders and the withdrawal of government funds; (2) reconfiguration of structural elements potentially in a concerted effort to improve the efficacy of the TIS in reaction to system failures; and/or (3) stagnation, where a prolonged period of little investment results in low levels of activity, possibly inducing knowledge depreciation, but where investment is sufficiently high to preserve some key aspects of the TIS (e.g. research institutes, test facilities).
2. Test infrastructure innovation co-evolves with energy technology innovation – To date, the role of
infrastructure in the technology innovation process has normally been characterised as one enabling technology deployment – for example, via integration with existing electricity networks (Gallagher et al. 2006). However, this research identifies the key role test facilities play in enabling technology innovation. Furthermore, the research finds that test infrastructure is subject to a process of innovation similar to that of the technologies of which it enables testing (e.g. wave energy). Crucially, test infrastructure also co-evolves with the technologies it is designed to test. Devices are designed with test facility capabilities in mind, whilst test facilities are designed around the key characteristics of emergent device designs.
3. Technology innovation relies on policy innovation –
The research finds that government reflected upon and learned lessons from the successes and failures of past wave energy policy, using these to inform the design of its current policy framework. Paramount to successful energy innovation policy making is the iterative process of policy design, experimentation, ‘learning by doing’ and subsequent refinement based on lessons learnt, which represents its own discrete form of innovation (Petmesidou & Gonz 2015; Mintrom 1997). This process of policy innovation is reliant upon the presence of personnel with the capacity and appetite to develop innovative policies (i.e. policy entrepreneurs) (Petmesidou & Gonz 2015), as well as intra- and inter-organisational networks that enable knowledge exchange and a culture that rewards policy innovation rather than discouraging it. 4. Devolution creates a complex but diverse innovation
system – Whilst research has considered how
< BACK TO CONTENTS > XVI
5. Innovation relies on the capture and codification of tacit knowledge – The case of wave energy
identifies that, too often, tacit knowledge (i.e. ‘know-how’) was lost when companies ceased trading, personnel moved on or knowledge was stockpiled due to confidentiality issues. Successful technology innovation relies on tacit knowledge being codified and, wherever possible, shared. However, it should be acknowledged that some tacit knowledge cannot easily be codified, making it difficult to transfer or ‘sticky’ (Hippel 1994; Brodbeck & Polanyi 1960). Finally, codification can help protect against knowledge depreciation during periods of relatively low RD&D funding (Wilson & Grübler 2014), as was the case for UK wave energy during the 1980s and 1990s.
6. Competition and collaboration must be balanced according to stage of innovation – The case of wave
energy supports the need for a balance between competition and collaboration or closed and open innovation (Chesbrough 2003). It points to the need for a stronger emphasis on collaboration during the earlier TRLs to ensure technology developers do not operate in isolation but instead benefit from knowledge sharing and the pooling of human and financial resources. As the technology moves closer to market, the emphasis may gradually shift towards competition in a bid to encourage convergence around a single optimal device design. Even so, it is important that areas for collaboration are clearly demarcated and built on sectoral consensus, with suitable platforms put in place to facilitate collaboration (e.g. JIPs).
7. Regional innovation clusters offer a locus for market formation – A growing body of literature points
to the importance of ‘regional innovation clusters’, which constitute a geographical concentration of key structural elements underpinning innovation (e.g. actors, institutions, networks, infrastructure), facilitating key innovation functions such as knowledge exchange and market formation (Muro
& Katz 2010). The wave energy case study supports this view in the examples of the EMEC and the University of Edinburgh, which have formed centres of excellence with their own entrepreneurial ecosystems. Consideration must therefore be given to where and how regional energy innovation clusters will be established and opportunities to build these around test facilities, which already see a high concentration of actors, resources and infrastructure (e.g. grid connection).
8. Protected spaces help to shield emerging technologies from competition against mature technologies – To avoid emerging technologies
becoming ‘crowded out’, it is essential that they are not in direct competition with more established technologies for the same RD&D funding. This finding supports the view outlined in the socio-technical transitions and strategic niche management literature that emerging technologies should be protected by the formation of ‘sheltered spaces’ such as niche markets (Schot & Geels 2008), enabling gradual technological maturation through ‘learning by doing’ and ‘learning by using’, as well as improving stakeholders’ confidence in the technology via successful real-world deployment.
9. Characteristics of technology influence its innovation journey – The case of wave energy
points to the unique technical challenges it has faced, such as the need to test in a very hostile ocean environment and the lack of synergies with established technologies. It is critical that, when comparing the progress of different energy technologies, their respective characteristics are acknowledged because these will shape the pace and nature of their development trajectory. This echoes research by Nemet (2014) who identified how smaller, modular energy technologies (e.g. solar PV) tended to benefit from a faster rate of learning versus large, site-assembled technologies (e.g. nuclear) because they underwent a much larger number of iterations due to their lower costs and build times.
Recommendations
for future research
Looking forward and focusing specifically on research relating to strategies for wave and marine energy innovation, the report identifies the need for:
1. a continued mixed-method assessment to monitor how
structural changes are impacting upon the UK’s wave energy innovation performance over a long-term period;
2. firm-level case studies of wave energy developers’
experiences to offer a detailed understanding of their innovation journey and interaction with the wider innovation system;
3. a similar study that focuses on tidal stream innovation
to offer insights into the challenges facing a technology closer to commercialisation; and
4. an international cross-country comparison of wave
or marine energy innovation system performance, with follow-on case study research to examine the underlying factors responsible for some countries performing better or worse than others.
Turning to energy technology innovation studies more broadly, the report identifies the need for a systematic mixed-method comparison of different energy technology case studies across different countries to identify best-practice innovation strategies. This assessment could include a cost–benefit analysis of innovation policy frameworks, comparing innovation inputs (e.g. RD&D investment) and outputs (e.g. levelised cost of electricity, unit cost and installed capacity) and/or outcomes (e.g. CO2 emission reduction, job creation). This could help to identify the countries with best-practice innovation strategies and present a focus for more detailed case study research. Any such analysis should account for both public and private RD&D investment.
< BACK TO CONTENTS > XVIII
References
Bergek, A. et al., 2008. Analyzing the functional dynamics of technological innovation systems: A scheme of analysis. Research Policy, 37(3), pp.407–429. Available at: http://www.sciencedirect.com/science/article/pii/ S004873330700248X.
Brodbeck, M. & Polanyi, M., 1960. Personal Knowledge: Towards a Post-Critical Philosophy. American Sociological Review, 25(4), p.582. Available at: http://arxiv.org/
abs/1011.1669%5Cnhttp://dx.doi.org/10.1088/1751-8113/44/8/085201%5Cn http://www.jstor.org/ stable/2092944?origin=crossref.
Chesbrough, H.W., 2003. The era of Open Innovation. MIT Sloan Management Review, 44(3), pp.35–42.
Gallagher, K.S., Holdren, J.P. & Sagar, A.D., 2006. Energy-Technology Innovation. Annual Review of Environment and Resources, 31(1), pp.193–237.
Hippel, E. von, 1994. “Sticky Information”” and the Locus of Problem Solving: Implications for Innovation, Available at: https://evhippel.files.wordpress.com/2013/08/stickyinfo. pdf.
Kuhlmann, S., 2001. Future governance of innovation policy in Europe—three scenarios. Research Policy, 30, pp.953– 976.
Mintrom, M., 1997. Policy Entrepreneurs and the Diffusion of Innovation. American Journal of Political Science, 41(3), p.738. Available at: http://www.jstor.org/ stable/2111674?origin=crossref.
Muro, M. & Katz, B., 2010. The new “cluster moment”: how regional innovation clusters can foster the next economy. In S. Hoskinson & D. Kuratko, eds. Advances in the Study of Entrepreneurship, Innovation & Economic Growth.
Nemet, G., 2014. Technological Improvements in Solar Thermal Electricity in the United States and the Role of Public Policy. In C. Wilson & A. Grübler, eds. Energy technology innovation: learning lessons from historical successes and failures. Cambridge.
Petmesidou, M. & Gonz, M.C., 2015. D4.1 – Barriers to and triggers of policy innovation and knowledge transfer – Synthesis Report.
Schot, J. & Geels, F.W., 2008. Strategic niche management and sustainable innovation journeys: theory, findings, research agenda, and policy. Technology Analysis & Strategic Management, 20(5), pp.537–554. Available at: http://www.tandfonline.com/doi/ abs/10.1080/09537320802292651.
Scottish Government, 2017. Scottish Energy Strategy: The future of energy in Scotland, Edinburgh. Available at: http:// www.gov.scot/Resource/0051/00513466.pdf.
Sotarauta, M. & Kautonen, M., 2007. Co-evolution of the Finnish national and local innovation and science arenas: Towards a dynamic understanding of multi-level governance. Regional Studies, 41(8), pp.1085–1098. Wilson, C. & Grübler, A., 2014. The Energy Technology Innovation System. In Energy Technology Innovation: Learning from Historical Successes and Failures. New York: Cambridge University Press, pp. 11–29.
List of figures
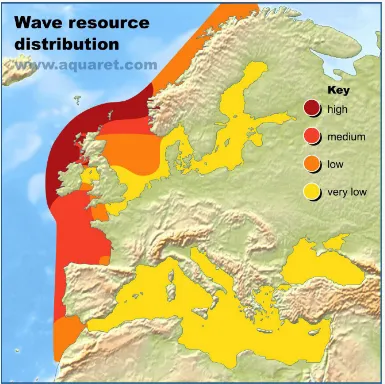
Figure 1: Offshore and nearshore practical resource distribution (Source: www.aquaret.com) ...5
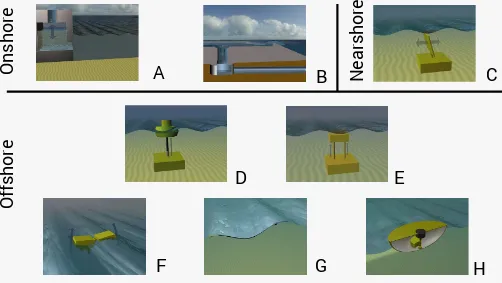
Figure 2: Schematic of typical wave energy devices (adapted from www.aquaret.com) ...7
Figure 3: Analytical framework to assess effectiveness of UK’s wave energy innovation system (source: author) ...11
Figure 4: Worked example of TIS structure–function analysis (source: author) ...16
Figure 5: UK wave energy innovation actor landscape (source: author) ...24
Figure 6: Top 10 awardees of public mid- to late-stage wave energy RD&D funding (source: author) ...26
Figure 7: Overview of wave energy innovation support policies 1999–2017 (source: author) ...31
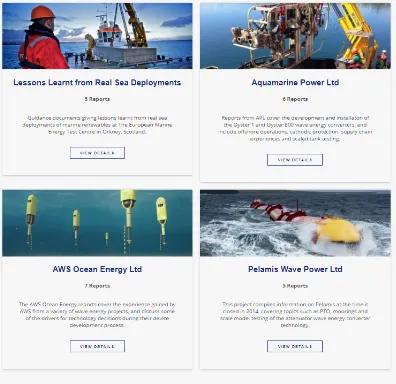
Figure 8: WES’s knowledge capture portal (source: WES) ...38
Figure 9: Timeline of wave energy innovation networks 2000–2017 (source: author) ...39
Figure 10: Evolution of land-based wave tanks and open-ocean test facilities since 2000 (source: author) ...45
Figure 11: Stephen Salter (right) testing the Salter Duck in an early wave flume (source: Edinburgh Wave Power Group) ...47
Figure 12: University of Edinburgh researchers working with the Wide Tank (source: Edinburgh Wave Power Group) ...47
Figure 13: University of Edinburgh Curved Wave Tank (source: Edinburgh Wave Power Group) ...47
Figure 14: University of Edinburgh FloWaveTT wave tank (source: Dave Morris) ...48
Figure 15: Schematic of WaveHub test facility (source: WaveHub) ...49
Figure 16: Top five countries for scientific journal publications in wave energy 2000–2016 (source: Scopus) ...56
Figure 17: Top five countries for citations of scientific publications in wave energy 2000–2016 (source: Scopus) ...56
Figure 18: Top five countries for wave energy patents 2000–2013 (source: EPO) ...57
Figure 19: Wave energy, low-carbon and all patents indexed to 2000 (source: EPO) ...57
Figure 20: Average number of partners working on wave energy-related RD&D projects (source: author) ...58
Figure 21: Number and share of UK wave energy scientific publications co-authored with non-UK partners (source: Scopus) ...58
Figure 22: Number and share of UK wave energy patents filed with non-UK partners 2000–2013 (Source: EPO) ...59
Figure 23: Number and share of non-UK partners in UK-based wave energy RD&D projects (source: author) ...59
Figure 24: Number of organisations engaged in wave energy projects from other technology sectors 2000–2017 (source: author) ...60
Figure 25: Number and share of joint industry–university wave energy-related projects (source: author) ...60
Figure 26: Share of RD&D funding committed to different wave energy device designs 2000–2017 (source: author) ...62
< BACK TO CONTENTS > XX
Figure 28: Share of RD&D funding committed to different tidal stream device designs 2000–2017 (source: author) ...64
Figure 29: Share of tidal stream energy RD&D funding by device design 2000–2017 (source: author)...64
Figure 30: Evolution of wave energy device capacity rating by developer and device type (source: author) ...65
Figure 31: Evolution of tidal stream device capacity rating by developer and device type (source: author) ...67
Figure 32: Levelised cost of electricity generated by wave energy 2009–2017 (source: Bloomberg) ...68
Figure 33: Overview of wave energy-related technology foresight reports between 1999 and 2017 (source: author) ...68
Figure 34: Wave and tidal stream 2020 deployment scenarios across Scotland, the UK and Europe (source: author) ...69
Figure 35: UK public RD&D funding for marine energy projects by research area 2000–2017 (source: author) ...70
Figure 36: Ocean energy’s share of global public renewable energy RD&D budget 2000–2014 (source: IEA) ...71
Figure 37: UK public RD&D funding for wave energy-related projects by innovation stage 2000–2017 (source: author) ... 71
Figure 38: UK public RD&D funding for wave energy-related projects by innovation funder 2000–2017 (source: author) ...72
Figure 39: Number of doctorates obtained in wave energy-related studies 2010–2016 (source: HESA) ...74
Figure 40: Number of higher degrees other than doctorates obtained in wave energy-related studies 2010–2016 (source: HESA) ...74
Figure 41: Size of UK wave energy project partners by numbers of employees (source: author) ...74
Figure 42: Number and device focus of wave energy developers operating in the UK 2000–2017 (source: author) ...75
Figure 43: Top ten countries for installed capacity of wave energy generation by host nation 2007–2016 (source: adapted from OES) ...75
Figure 44: Comparison of UK-installed capacity for wave and tidal stream energy 2007–2016 (source: adapted from OES) ...76
Figure 45: UK Government and parliamentary reports and announcements on wave energy 1999–2017 (source: author) ...78
Figure 46: Public perception of wave and tidal energy in the UK 2012–2017 (source: BEIS) ...78
Figure 47: Overview of inducement and blocking mechanisms related to actors (source: author) ...81
Figure 48: Overview of inducement and blocking mechanisms related to institutions (source: author) ...87
Figure 49: Overview of inducement and blocking mechanisms related to actor networks (source: author) ...95
Figure 50: Overview of inducement and blocking mechanisms related to infrastructure and technology (source: author) ...101
List of tables
Table 1: Typical wave energy convertors (Magagna & Uihlein 2015; EMEC 2016f) ...8
Table 2: Description of TIS functions (source: see below) ...13
Table 3: Quantitative indicator framework for measuring wave energy innovation performance against
TIS functions ...14
Table 4: UK carbon budgets and targets (Source: CCC 2017) ...33
Table 5: Summary of wave energy innovation networks and the activities they perform (source: author) ...40
Table 6: Potential cross-fertilisation benefits for wave energy from other technology sectors
(Source: SI Ocean 2012)...46
Table 7: Evolution of wave energy test tanks at the University of Edinburgh (source: see below) ...48
Table 9: Number of wave energy-related companies that emerged from universities (source: adapted from
New Company Finance) ...61
Table 10: Summary of public funds awarded for wave and tidal stream energy RD&D 2000–2017
(source: author) ...70
Table 11: Wave energy and cross-cutting marine energy innovation funding in the UK by innovation stage for
projects taking place between 2000 and 2022 (source: author) ...72
Table 12: Wave energy and cross-cutting marine energy innovation funding in the UK by government funder for
projects taking place between 2000 and 2022 ...73
< BACK TO CONTENTS > XXII
List of acronyms and abbreviations
BEIS Department of Business, Energy and
Industrial Strategy
BWEA British Wind Energy Association
CAPEX Capital expenditure
CDT Centres for doctoral training
CfD Contracts for Difference
CEO Chief Executive Officer
CFO Chief Financial Officer
CHP Combined Heat and Power
CPC Cooperative patent classification
DCLG Department for Communities and Local
Government
DEFRA Department for Environment, Farming
and Rural Affairs
DECC Department of Energy and Climate
Change
DETR Department of the Environment,
Transport and the Regions
DfID Department for International
Development
DfT Department for Transport
DG Directorates General
DTI Department of Trade and Industry
EC European Commission
EERA European Energy Research Alliance
EIB Energy Innovation Board
EMEC European Marine Energy Centre
EMF Electricity Market Reform
EngD Engineering doctorate
EPO European Patent Office
EPSRC Engineering and Physical Sciences
Research Council
ERDF European Regional Development Fund
ETI Energy Technologies Institute
ETSU Energy Technology Support Unit
EU European Union
EU ETS EU Emissions Trading System
FORESEA Funding Ocean Renewable Energy
through Strategic European Action
FP Framework programme
FREDS Forum for Renewable Energy
Development in Scotland
GDP Gross Domestic Product
GW Gigawatt
HESA Higher Education Statistics Authority
HIE Highlands and Islands Enterprise
HoCECCC House of Commons Energy and Climate
Change Committee
ICOE International Conference on Ocean
Energy
ICT Information and communications
technology
IDCORE Industrial Doctorate Centre in Offshore
Renewable Energy
IEA International Energy Agency
INORE International Network on Offshore
Renewable Energy
IP Intellectual property
IPCC Intergovernmental Panel on Climate
Change
IPPI International Public Policy Institute
ITI Intermediate Technology Institute
kW Kilowatt
JIP Joint industry programme
LCICG Low Carbon Innovation and Coordination
Group
LCIG Low Carbon Innovation Group
LCOE Levelised cost of electricity
LIMPET Land Installed Marine Power Energy
Transmitter
M&A Mergers and acquisitions
MARINET Marine Renewables Infrastructure
Network
MEA Marine Energy Accelerator
EXECUTIVE SUMMARY
MEAD Marine Energy Array Demonstrator
MEPB Marine Energy Programme Board
MESAT Marine Energy – Supporting Array
Technologies
MFA Marine Farm Accelerator
MRCF Marine Renewables Commercialisation
Fund
MRDF Marine Renewable Deployment Fund
MRes Master of Research
MRPF Marine Renewables Proving Fund
MSO Marine Supply Obligation
MW Megawatt
NDPB Non-departmental public body
NER300 New Entrants Reserve 300
NERC Natural Environment Research Council
NFFO Non-Fossil Fuel Obligation
O&M Operations and maintenance
OEE Ocean Energy Europe
OEM Original Equipment Manufacturer
OES Ocean Energy Systems
Ofgem Office for Gas and Electricity Markets
OPEX Operational expenditure
OREC Offshore Renewable Energy Catapult
ORECCA Offshore Renewable Energy Conversion
platforms – Coordination Action
ORJIP Offshore Renewables Joint Industry
Programme
OWA Offshore Wind Accelerator
OWC Oscillating water column
PATSTAT Worldwide Patent Statistical Database
PhD Doctorate of Philosophy
PRIMARE Partnership for Research in Marine
Renewable Energy
PTO Power take off
PV Photovoltaic
PWh Perwatt hour
R&D Research and development
R&I Research and Innovation
RCUK Research Councils UK
RD&D Research, development and
demonstration
REA Renewable Energy Association
REMS Centre for Doctoral Training in
Renewable Energy Marine Structures
REIF Renewable Energy Investment Fund
RO Renewables Obligation
ROC Renewable Obligations Certificate
ROS Renewable Obligation Scotland
ROV Remotely operated vehicle
SEAB Scottish Energy Advisory Board
SET Strategic Energy Technologies
SME Small- to medium-sized enterprise
SRO Scottish Renewables Obligation
TCP Technology Collaboration Programme
TGL Tidal Generation Ltd
TINA Technology Innovation Needs
Assessment
TIS Technology innovation system
TNEI The Northern Energy Initiative
TRL Technology readiness level
TWh Terawatt hour
UK United Kingdom
UKAS United Kingdom Accreditation Service
UKCMER UK Centre for Marine Energy Research
UKERC UK Energy Research Centre
UKRI UK Research and Innovation
VC Venture capitalist
W&T KTN Wave & Tidal Knowledge Network
WATERS Wave and Tidal Energy: RD&D Support
WATES Wave and Tidal Energy Scheme
WEC Wave energy converter
WEFO Welsh European Funding Office
WES Wave Energy Scotland
WMES Centre for Doctoral Training in Wind &
Marine Energy Systems
WTSET Wave and Tidal Stream Energy
1
< BACK TO CONTENTS >1
Introduction
Wave energy has long been identified as a potentially significant contributor to the UK’s electricity supply mix. It has been estimated that wave energy in UK waters could provide up to 70 TWh/annum of electricity generation4 (AMEC & Carbon Trust 2012), equivalent to
approximately 21% of the UK’s electricity supply in 2015 (BEIS 2016b).
As a low-carbon energy source, wave energy has the potential to help the UK meet its 2050 target of reducing its greenhouse gas emissions by 80% against its 1990 baseline. Furthermore, as a domestic natural resource, wave energy can help deliver on other government objectives such as improving energy security by replacing imported fossil fuels (e.g. gas, coal) and promoting economic growth through the birth of a new home-grown industry.
To capture this prize, the UK has invested heavily in wave energy RD&D, but despite this significant investment, wave energy technology has yet to become commercially viable. Whilst this may in part be attributed to the scale of the associated engineering challenge and the viability of the technology, questions remain about whether this slow progress could also be attributed to government and industry’s strategy to accelerate wave energy technology innovation in the UK. This report therefore examines how well the UK has performed in accelerating wave energy technology since 2000 and the socio-technical factors responsible for supporting or undermining wave energy innovation, not least government policy.
1.1 Rationale
The report’s findings are aimed primarily at government and industry in a bid to help improve the effectiveness of UK public wave energy innovation support and accelerate the technology’s journey towards commercialisation. Importantly, lessons are drawn from the case study to help inform the design and improve the efficacy of energy innovation policy more broadly. It is hoped these lessons will help shape the UK’s low-carbon energy innovation strategy and help it meet its Paris Agreement commitment to limit global temperature rise this century well below 2oC
above pre-industrial levels.
The report also makes an important contribution to the extant literature on the structure, performance, drivers and barriers of wave energy innovation. Whilst a wealth of research has already examined the structure, performance, drivers and barriers of wave energy innovation, both in the UK (Winskel et al. 2006; Jeffrey et al. 2013; A. Vantoch-Wood 2012) and other countries (Corsatea & Magagna 2014; Magagna et al. 2016; Andersson et al. 2017), the extant research poses a number of limitations that this report seeks to address.
First, only a handful of studies have employed a
systematic analysis of wave energy technology innovation performance that considers a broad spectrum of causal factors and how these inter-relate (Corsatea & Magagna 2014; A. Vantoch-Wood 2012; Andersson et al. 2017). Furthermore, very few of these systematic studies have focused specifically on the UK and those that have were conducted some years ago, thus failing to take into account the major changes the sector has recently undergone (see A. Vantoch-Wood 2012).
Second, studies of wave energy technology innovation tend to be bundled together as part of a broader focus on marine energy innovation. However, wave energy presents a characteristically distinct technology when compared to other marine technologies (e.g. tidal stream, tidal range), most of which are also at very different stages of development (Mofor et al. 2014), thus demanding that research focuses exclusively on wave energy technology.
3
< BACK TO CONTENTS >Third, with the exception of Vantoch-Wood (2012) and Andersson et al. (2017), most marine energy innovation studies have employed either a predominantly qualitative or quantitative approach to analysis, rather than a mixed-methods approach and the balanced assessment this provides.
Finally, whilst various excellent historical accounts of wave energy innovation exist (Ross 2002; Ross 1996; Wilson 2012), analyses of UK wave energy innovation performance and policy support tend to provide snapshots of particular moments in time rather than a longer term view of how innovation systems have evolved over time and how this evolution has shaped innovation performance.
1.2 Research questions
In this context, this report provides an up-to-date systematic mixed-method analysis of how the UK wave energy innovation system’s structure and performance have evolved and the underlying factors responsible. This report examines the period since 2000 as this corresponds with a renaissance in UK support for wave energy
technology innovation, following a cessation of intense government support dating back to the late 1970s and early 1980s. The study employs a Technology Innovation System (TIS) approach, analysing both qualitative and quantitative data to address the following questions:
1. How is the UK’s wave energy innovation system structured and how has it evolved?
2. How well has the UK’s wave energy innovation system performed and how has its performance changed over time?
3. Which factors have supported and undermined wave energy innovation in the UK?
4. What actions could be taken by the UK to accelerate wave energy innovation in the future?
5. What lessons can we learn from the case of UK wave energy innovation to help support innovation of other energy technologies?
It is important to note that the research focuses explicitly on the effectiveness of the UK’s wave energy innovation strategy, examining in particular how government policy successes and failures have influenced wave energy’s path towards commercialisation. Consideration of the technical feasibility of wave energy technology and whether it should represent a priority for future innovation funding sit outside the remit of this report.
1.3 Structure of this report
This report is structured as follows: Section 2 presents a literature review of the fundamentals and drivers of wave energy technology innovation. Section 3 presents the research’s analytical framework and research strategy, introducing some core concepts of the TIS literature. Section 4 outlines the research’s data collection. Section 5 maps the structure of the UK’s wave energy innovation system and how this has evolved since 2000. Section 6 presents an analysis of the performance of the UK’s wave energy innovation system. Section 7 examines the factors responsible for supporting or undermining wave energy technology innovation in the UK. Finally, Section 8 discusses the report’s key findings and identifies policy recommendations to accelerate wave energy innovation in the future, as well as lessons for supporting energy technology innovation more broadly.
2
Literature review:
fundamentals and
drivers of wave
5
< BACK TO CONTENTS >2.1 Fundamentals of wave energy technology
Waves are generated when the wind blows over the ocean’s surface, itself a function of temperature and pressure differentials caused by the distribution of solar energy (Barstow et al. 2008). Wave energy carries both kinetic and gravitational potential energy, the level of which is a function of both the height and period of the wave (Barstow et al. 2008). Importantly, sea waves offer the highest energy density of all renewable energy sources (Clément et al. 2002). For example, the intensity of solar energy intensity is typically between 0.1–0.3kW/m2 when incident on a horizontal
surface. In comparison wave power offers an ‘average power flow intensity of 2–3kW/m2 of a vertical plane perpendicular
to the direction of wave propagation just below the water surface (Falnes 2007)’ (Drew et al. 2009 p.887).
The Intergovernmental Panel on Climate Change (IPCC) estimates that the global theoretical wave energy potential
is 32PWh per annum, roughly twice the global electricity supply of 2008 (17PWh per annum) (Lewis et al. 2011; Mørk et al. 2010). This estimate of total theoretical wave energy potential is, however, unconstrained by economic and geographical factors or the availability of wave energy technology.
[image:29.595.107.492.402.786.2]The UK’s mid-latitude location within the Atlantic Ocean means that the country is excellently placed to capture this resource, with a total theoretical wave energy potential of 230 TWh per annum for electricity generation (AMEC & Carbon Trust 2012). However, when accounting for the capability of existing wave energy technologies, the needs of other sea users (e.g. shipping, fishing) and the need to mitigate environmental impact, this estimate falls to 70TWh per annum. Figure 1 illustrates the distribution of the UK’s wave energy resources, emphasising the high levels of wave energy incident on the North West coast of Scotland and to a lesser extent, the South West cost of England (Aquaret 2012).
Figure 1: Offshore and nearshore practical resource distribution (Source: www.aquaret.com) SECTION 2