Interactions between growth-dependent changes in cell size, nutrient supply and cellular 1
elemental stoichiometry of marine Synechococcus (pre-proofs version of the manuscript) 2
3
Nathan S. Garciaa, Juan A. Bonachelab and Adam C. Martinya,c,1 4
5 6
a
Department of Earth System Science, 3200 Croul Hall, University of California, Irvine, 7
California, USA, 92697 8
9 b
Department of Mathematics and Statistics, Livingstone Tower, University of Strathclyde, 26 10
Richmond Street, Glasgow G1 1XH, Scotland, United Kingdom 11
12 c
Department of Ecology and Evolution, 321 Steinhaus Hall, University of California, Irvine, 13
California, USA, 92697 14
15
Running title: Cellular elemental stoichiometry of Synechococcus 16
17
Keywords: Redfield, chemostat, Cyanobacteria, physiology 18
19 1
to whom correspondence should be addressed: ph: 949-824-9713 fax: 949-824-3874 20
Abstract 23
The factors that control elemental ratios within phytoplankton like carbon:nitrogen:phosphorus 24
(C:N:P), are key to biogeochemical cycles. Previous studies have identified relationships 25
between nutrient-limited growth and elemental ratios in large eukaryotes, but little is known 26
about these interactions in small marine phytoplankton like the globally important 27
Cyanobacteria. To improve our understanding of these interactions in picophytoplankton, we 28
asked how cellular elemental stoichiometry varies as a function of steady-state, N- and P-limited 29
growth in laboratory chemostat cultures of Synechococcus WH8102. By combining empirical 30
data and theoretical modeling, we identified a previously unrecognized factor (growth-dependent 31
variability in cell size) that controls the relationship between nutrient-limited growth and cellular 32
elemental stoichiometry. To predict the cellular elemental stoichiometry of phytoplankton, 33
previous theoretical models rely on the traditional Droop model, which purports that the 34
acquisition of a single limiting nutrient suffices to explain the relationship between a cellular 35
nutrient quota and growth rate. Our study, however, indicates that growth-dependent changes in 36
cell size play an important role. This key ingredient, along with nutrient-uptake-protein 37
regulation, enables our model to predict the cellular elemental stoichiometry of Synechococcus 38
across a range of nutrient-limited conditions. Our analysis also adds to the growth rate 39
hypothesis, suggesting that P-rich biomolecules other than nucleic acids are important drivers of 40
stoichiometric variability in Synechococcus. Lastly, our study indicates that abundant nutrients 41
are not stored in high excess within Synechococcus. Our data provide a framework for 42
understanding and predicting elemental ratios in ocean regions where small phytoplankton like 43
Synechococcus dominates. 44
Introduction 46
A clear understanding of biogeochemical cycles is key to predicting long-term global 47
change associated with rising atmospheric carbon dioxide (CO2). The elemental composition of 48
marine phytoplankton is central to ocean biogeochemistry as it links the global carbon (C) cycle 49
with the cycling of other elements, such as nitrogen (N) and phosphorus (P) (Sterner and Elser, 50
2002; Galbraith and Martiny, 2015). The ratio of elements within organisms is known to vary 51
with energy and nutrient flow through ecosystems (Sterner et al., 1997; Sterner and Elser, 2002; 52
Urabe et al., 2002) and is linked to growth rates and nutritional status. The elemental 53
stoichiometry of biological organisms propagates through the food web to shape community 54
structure and function (Elser et al., 2000) and in turn, marine biota provides a flexible interface, 55
linking global biogeochemical cycles together and can thereby have large effects on climate 56
systems (Finkel et al., 2010; Galbraith and Martiny, 2015). Thus, factors that influence elemental 57
stoichiometry of marine organisms are needed for refined models that forecast how the earth 58
system will change in the future. 59
Models of biogeochemical cycles traditionally use a fixed ratio of C:N:P for major 60
lineages of marine phytoplankton, even though C:N:P of phytoplankton can vary substantially. 61
Countless studies indicate that cellular elemental stoichiometry is highly variable within isolates 62
(Goldman et al., 1979; Geider et al., 1998; Geider and La Roche, 2002) and recent research 63
indicates that C:N:P is also highly variable among ocean regions (Martiny et al., 2013; DeVries 64
and Deutsch, 2014; Teng et al., 2014). Basic knowledge of the underlying physiological 65
mechanisms that control this variability can provide a framework to understand and predict how 66
Cell models and the majority of laboratory studies have examined how multiple factors, 68
such as growth rate and nutrient limitation interact to influence cellular elemental stoichiometry 69
of phytoplankton. Basic physiological mechanisms link growth rates with chemical components 70
within cells, which determine the cellular stoichiometry of elements. For example, the growth 71
rate hypothesis (Sterner and Elser, 2002) predicts that ribosomes are needed in high 72
concentrations when cells are growing fast, and the high P-content (~9%) in ribosomal RNA can 73
cause changes in C:P and N:P with growth (Elser et al., 2000). Variability in other cell 74
components, such as proteins (Rhee, 1978; Lourenço et al., 1998), pigments, phospholipids (Van 75
Mooy et al., 2006) and polyphosphates (Rao et al., 2009; Martin et al., 2014), that are rich in a 76
specific element like N or P, also contribute to variation in cellular elemental stoichiometry and 77
may also co-vary with growth (Rhee 1973). Thus, variable nutrient supplies (e.g. N:P) are known 78
to influence cellular biochemical content, which can affect growth and elemental stoichiometry 79
of organisms (Rhee, 1978; Goldman et al., 1979; Geider and La Roche, 2002; Klausmeier et al., 80
2008). 81
Related to the growth rate hypothesis, empirical data have shown that C:P and N:P of 82
phytoplankton varies when nutrients limit growth (Rhee, 1978; Goldman et al., 1979). This 83
relationship has motivated the use of the classic Droop model to predict C:N:P as a function of 84
growth in single- or multiple-nutrient theoretical models (Droop, 1968; Morel, 1987; Legović 85
and Cruzado, 1997; Klausmeier et al., 2004a; Pahlow and Oschlies, 2009). In the Droop model, 86
the growth rate of an organism increases hyperbolically as the cellular elemental quota of a 87
single, growth-limiting nutrient (e.g. P) increases. Klausmeier et al. (2004a) used empirical data 88
to build a Droop-based model in which growth rates decline due to decreasing concentrations of 89
to store a given element in excess. In other models, phytoplankton elemental stoichiometry 91
results from resource allocation strategies and regulation of nutrient-uptake-proteins (Pahlow and 92
Oschlies, 2009; Bonachela et al., 2013), which are known to comprise high portions (up to 50%) 93
of cellular N in microbial organisms (Geider and La Roche, 2002). Thus, imbalanced nutrient 94
supplies interact with growth rates to influence the cellular elemental composition through the 95
ribosomal RNA, elemental storage, and nutrient acquisition mechanisms. 96
Nearly all of the systematic approaches to studying growth-dependent changes in cellular 97
elemental stoichiometry have focused on large eukaryotic lineages, which are rare or absent from 98
the large oligotrophic gyres throughout the world’s oceans. While some studies have focused on 99
small freshwater phytoplankton including Cyanobacteria (Healey, 1985; Claquin et al., 2002; 100
Verspagen et al., 2014), less is known about these mechanistic relationships within marine 101
Cyanobacteria, which are known to dominate vast nutrient-poor gyres (Flombaum et al., 2013). 102
Recent estimates suggest that they contribute 25% of global marine net primary production and 103
are found in most ocean regions in high abundance (Flombaum et al., 2013). Despite their large 104
influence on global biogeochemical cycles, only a few studies have examined the cellular 105
elemental stoichiometry of marine Cyanobacteria (Bertilsson et al., 2003; Heldal et al., 2003; Ho 106
et al., 2003; Finkel et al., 2010) and even fewer have focused on physiological mechanisms that 107
might control cellular C:N:P of lineages within Cyanobacteria (Fu et al., 2007; Kretz et al., 108
2015; Mouginot et al., 2015). Furthermore, none of these studies have examined the well-known 109
interactive influence of growth physiology and nutrient supply on its cellular elemental 110
stoichiometry. These relationships could be different in small phytoplankton in comparison with 111
large phytoplankton, as cell size can reflect important differences in cellular physiology, such as 112
Cyanobacteria is essential to understand how this globally ubiquitous functional group of 114
primary producers influences ocean biogeochemical cycles and how this influence might change 115
in the future. 116
Here, we asked how cellular elemental stoichiometry of an isolate of one of the most 117
numerically abundant phytoplankton genera in the global ocean (Flombaum et al., 2013), 118
Synechococcus (WH8102), varies across a range of N- and P-limited steady-state growth rates in 119
laboratory chemostat cultures. We also evaluated how nucleic acids contribute to cellular 120
elemental stoichiometry by determining how cellular P is biochemically apportioned. Lastly, 121
because we documented changes in cell size as a function of growth rate in our chemostat 122
cultures, we used a theoretical model to ask how cell size contributes to relationships between 123
nutrient-limited growth, elemental quotas and cellular elemental stoichiometry. Our results 124
provide a basic understanding how one of the most abundant marine phytoplankton lineages 125
regulates its elemental composition in the oceans. 126
Methods 127
Experiments 128
Using a modified method from Mouginot and co-workers (2015), cultures of 129
Synechococcus (strain WH8102) were grown with a continuous dilution method in 8L-130
polycarbonate bottles at 24°C in an artificial seawater medium at ~195 mol quanta m-2 s-1 on a 131
14:10 light:dark cycle. Light was supplied with cool white fluorescent lamps. We prepared 132
artificial seawater modified from Waterbury and Willey (1988) (Supplementary Table S1), in 133
50L batches before autoclaving 7L volumes, to which, after cooling, we added 0.2- m-filter-134
sterilized carbonates, trace metals, nitrate (NO3-) and phosphate (PO43-) (Supplementary Table 135
flame to minimize contamination. The culturing system was enclosed with 0.2 m-filtered air 137
pumped into the chamber with a 0.2 m filter attached to an air outlet. We controlled the culture 138
dilution rate and hence the growth rate, by controlling the medium supply rate and the culture 139
volume. The liquid volume in the reservoirs ranged from 2.3 L to 5.25 L, thereby yielding a 140
range in dilution rates and steady-state growth rates with equivalent medium input rates. The 141
accumulation of cellular biomass was limited by NO3- (added as NaNO3), where measured 142
nutrient concentrations in the medium were 15.9 M NO3- and 9.2 M PO43- (added as K2HPO4) 143
yielding a N:Pinput supply ratio of 1.7, or by PO43- with measured concentrations in the medium 144
of 38 M NO3- and 0.56 M PO43-, yielding an N:Pinput supply ratio of 68. PO43- and NO3- were 145
measured with a colorimetric assay as described in the Bermuda Atlantic Time-series Methods 146
(Michaels, Dow and Elardo, 1997; Michaels, Dow and Howse, 1997) with a spectrophotometer 147
(Genesis 10vis Thermo Scientific, Madison, WI, USA) at 885 and 543 nm, respectively. 148
Samples from chemostat cultures were collected on pre-combusted 450°C GF/F filters 149
(Whatman) for the analysis of particulate organic carbon (POC) and particulate organic nitrogen 150
(PON) (200 mL), particulate organic phosphorus (POP; 50 mL) and DNA and RNA (200 mL). 151
Samples for the analysis of POC and PON were dried at 50-80°C (48+ h), pelletized and 152
analyzed on a Flash EA 1112 NC Soil Analyzer (Thermo Scientific). Samples for the analysis of 153
POP were rinsed with 0.17 M NaSO4, dried at 60-80°C with 2 mL of 0.017 M MgSO4, and 154
combusted at 450°C for 2 h before adding 5 mL 0.2 M HCl and baking at 80-90°C. The resulting 155
orthophosphate concentrations were measured as described above. 156
Nucleic acids were measured by filtering cells onto combusted GF/F filters and storing 157
samples in liquid nitrogen until analysis. Cells were lysed with a bead-beater containing 1 mL of 158
ethylenediaminetetraacetic acid; 25 mM sodium citrate; and saturated with ammonium sulfate) 160
and 4 parts 5 mM Tris buffer. Nucleic acids were measured in the supernatant with the Qubit 161
dsDNA HS Assay Kit and the Qubit HS RNA Assay Kit (Invitrogen, Eugene, OR, USA) 162
according to the method described by Zimmerman et al. (2014a; 2014b). This technique provides 163
a linear signal in response to the amount of cell material analyzed and is able to recover nearly 164
100% of material from standards (from Qubit HS Assay Kit) that were spiked into the samples. 165
Cells were counted with an Accuri C6 Flow Cytometer (Ann Arbor, MI, USA) by identifying 166
particles with forward scatter (the proxy flow-cytometry estimate for cell size, FSCH) and Chl a 167
fluorescence. Fluorescence of phycoerythrin was also determined with the flow cytometer. We 168
estimated cell diameter with a cell-carbon/cell-volume conversion factor calculated with data 169
acquired from a related Synechococcus strain (WH8103) growing in artificial seawater (Heldal et 170
al., 2003). To summarize trends in steady-state responses to N and P-limited growth rates, we 171
report the mean and standard deviations on measurements from samples collected on the final 172
three time-points of the experimental trials. We fit the Droop model to the growth rate and 173
elemental quota data in Figure 1 using a simple nonlinear least squares method with R statistical 174
software (www.r-project.org) with the form Q = a / (b - ), where a = ∞ · Q’min, b = ∞, Q is
175
elemental quota, and is growth rate. 176
Model 177
We used the empirical data from the chemostat cultures to expand on an existing model 178
where cellular elemental stoichiometry emerges as a function of the nutrient-limited growth rate 179
(See also Supplementary Information). This model uses physiological foundations similar to 180
other models of cell stoichiometry (Lehman et al., 1975; Bonachela et al., 2013)and includes 181
(Bonachela et al., 2013). These dynamics depend on the quota of the nutrient that is taken up 183
through the so-called expression function, F, and the P quota (as a proxy for the availability of 184
protein-synthesizing ribosomes) through the repression function, G. The former encodes protein 185
regulation strategies based on nutrient availability (upregulation for low nutrient, downregulation 186
for high nutrient) (Dyhrman and Palenik, 2001). The latter, the feasibility of those strategies 187
based on ribosome availability (e.g. low levels of RNA prevent synthesis from happening). For 188
the number of proteins that take up N in the population, nN, for example, these dynamics are
189
given by the equation: 190
1 ( )
( ) ( ) ( ) ( ),min max min min max max t wn t B Q Q Q t Q G Q Q t Q Q F t A H dt dn N P P P P N N N N rel N N 191
where B represents population size, w is the dilution rate of the chemostat, νN is the maximum 192
protein synthesis rate per cell and unit time, and H is a Heaviside function that depends on the 193
ratio absorbing-to-total area (Arel; i.e. a switch that stops protein synthesis when the absorbing
194
area reaches the total area). As explained in the SI, nN is positively correlated with the maximum
195
uptake rate for nitrogen; in turn, nP is positively correlated with the maximum uptake rate for
196
phosphorus. 197
Unlike previous models, however, the maximum and minimum value for the quotas in 198
our model (i.e. physiological ranges) are positively correlated with cell size (see SI, Eqs.(18)-199
(21)). These expressions are deduced from our laboratory data. Differently from previous 200
models, we also de-couple the dynamics of population carbon and population number. While the 201
dynamics of population carbon are somewhat controlled by the regulation of photosynthetic 202
proteins [see SI Eq.(15)] and other metabolic expenses, the equation for the population number 203
f Q ,Q ,Q w
B(t),dt dB
P N
C
205
where f is a multiplicative function that depends on the three cellular elements. Thus, our 206
expanded model implements variable cellular C quotas. Using different forms for the functional 207
dependence between the C, N, and P quotas and the population dynamics of the chemostat 208
cultures, f, allowed us to study how the emergent growth rates depend on the shape of this 209
functional dependence (e.g. linear, Droop-like hyperbola). 210
All these components act as a feedback loop. From our chemostat cultures, we were able 211
to deduce that the cellular growth rate influences the maximum C quota and that the cellular C 212
quota influences the maximum and minimum N and P quotas. These extreme quotas are key to 213
the regulation of the nutrient-uptake and photosynthetic proteins which, in turn, strongly 214
influence nutrients and growth. As the cellular C quota is tightly correlated with cell size, the 215
model ultimately links cell size and growth rate, which influence quota dynamics and elemental 216
stoichiometry. See SI for further details. 217
Results 218
To understand the interaction between nutrient-limitation, growth physiology, and 219
cellular elemental stoichiometry, we analyzed steady-state chemostat cultures of Synechococcus 220
WH8102 across four growth rates and two different nutrient supply regimes (N:Pinput = 1.7 and
221
N:Pinput = 68). First, we monitored the culture cell density, cell size and particulate organic
222
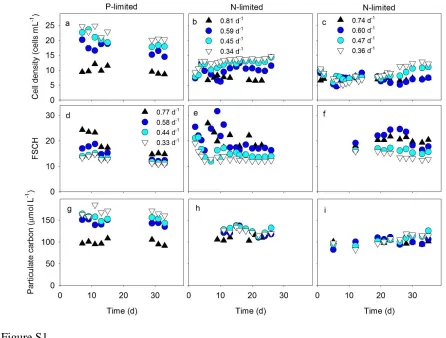
matter in cultures to ensure they were growing at steady-state (Supplementary Figure S1). Both 223
residual dissolved PO43- in P-limited cultures and residual dissolved NO3- in N-limited cultures 224
were below the detection limit of the spectrophotometric methods used. This indicated that the 225
biomass in cultures, and hence the physiology of cells, were strongly P- or N-limited, 226
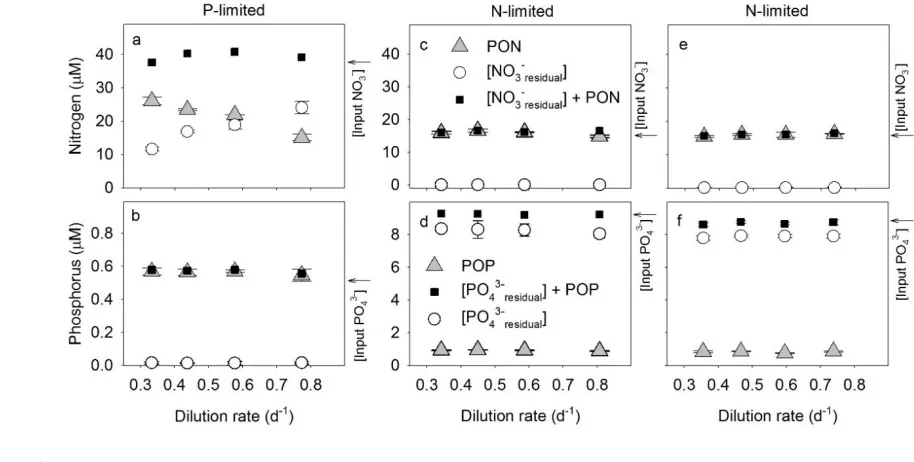
NO3- with POP and PON concentrations, respectively, were close to measured input 228
concentrations of PO43- and NO3-. This indicated that cells were able to drawdown nearly all of 229
the PO43- or NO3- supplied to P- or N-limited chemostat cultures, respectively (Supplementary 230
Figure S2). Hence, estimates of culture cell densities, cellular elemental stoichiometry (C:Pcell
231
and N:Pcell) and residual nutrient concentrations suggested that cells had reached a steady-state
232
by the end of each chemostat trial (Supplementary Figure S1-S3). 233
Growth rate and culture cell density varied in a negative relationship, with a stronger 234
relationship in P-limited vs. N-limited cultures (Supplementary Figure S1A-C). In contrast, the 235
proxy flow-cytometry estimate for cell size (FSCH) was positively related to growth rate in 236
steady-state chemostats under both N- and P-limitation (Supplementary Figure S1D-F). 237
Throughout each trial, POC decreased as a function of P-limited growth rate but was relatively 238
invariable under N-limited growth (Supplementary Figure S1G-I). 239
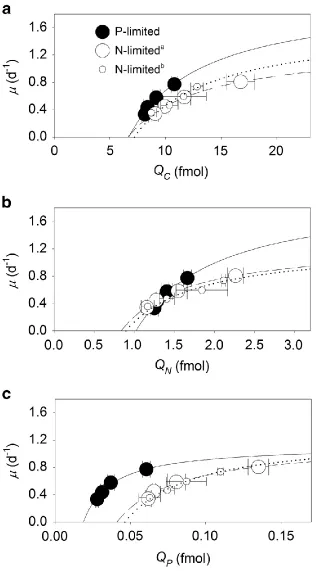
The steady-state cellular elemental quotas of C, N, and P (QC, QN, and QP) all increased
240
as a function of growth following a hyperbolic curve resembling the Droop model equation (r2 ≥ 241
0.94, Figure 1 and Table 1). To quantify physiological limits on growth rates and elemental 242
quotas, we defined ∞ and Q’min as the conditional maximum growth rate and the conditional
243
minimum elemental quota, respectively, given the ambient light and temperature levels in our 244
experiments. Although the conditional minimum C and N quotas (Q’C,min, Q’N,min) did not vary
245
between P-limited and N-limited cells (student’s t-test, P > 0.05, Figure 1a, Table 1), the 246
conditional minimum P quota (Q’P,min), significantly increased by 118-146% under N-limited
247
conditions in comparison with P-limited conditions (Figure 1c, Table 1). Also, in P-limited 248
cultures, ∞ was significantly higher (student’s t-test, P < 0.05) when calculated from the QC or
249
QN data in comparison with that calculated from the QP data (Table 1). Collectively, these
differences reflect strong differences in the cell quotas as a function of growth and nutrient 251
conditions (Figure 1a-c). 252
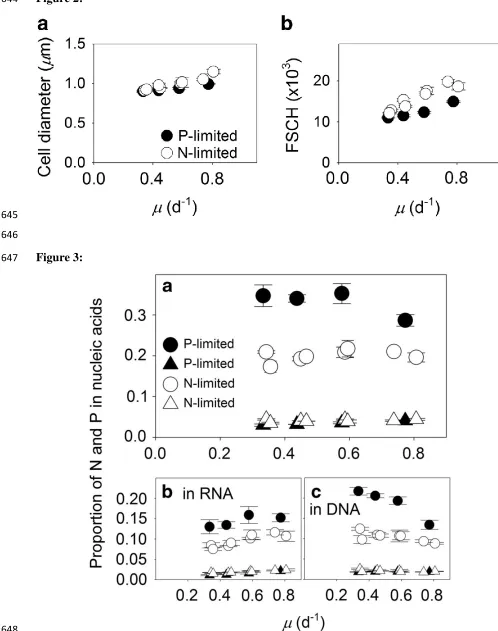
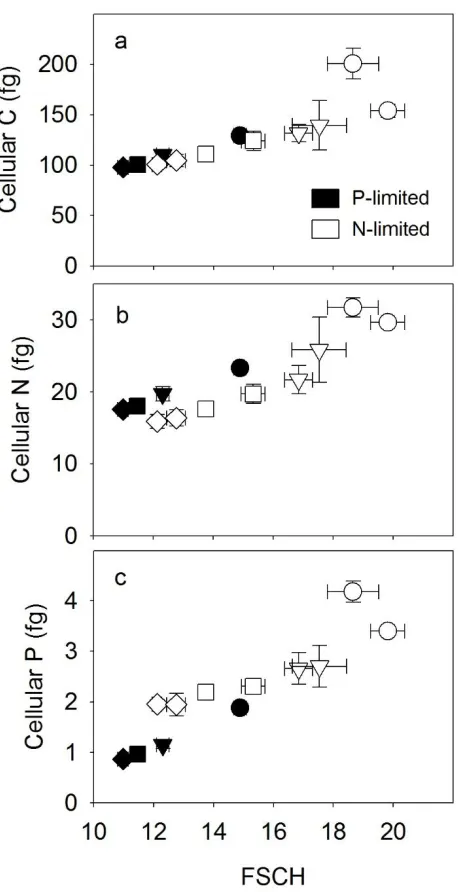
The observed increase in cell quotas with growth rate could lead to changes in overall 253
cell size (Figure 2a). To further examine this, we compared a flow-cytometric metric for cell size 254
(FSCH) with growth rates. Growth physiology had a significant effect on FSCH (analysis of 255
covariance test, F1,32 = 239, P < 0 .001; Figure 2b). In addition, growth rate and limitation type 256
(N or P) had a significant interactive effect on FSCH (analysis of covariance test, F1,32 = 13, P = 257
0.001). This interactive effect indicated that N-limited cells were larger than P-limited cells when 258
the growth rate was high (analysis of covariance test, F1,32 = 122, P < 0.001), but the effect of 259
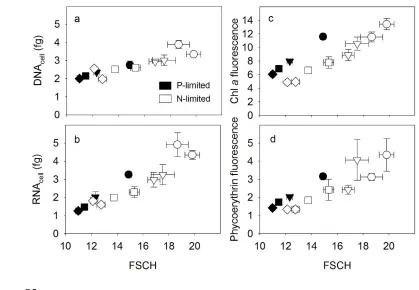
limitation type on FSCH was reduced in slower-growing cells (Figure 2b). We also compared 260
FSCH with other cellular measurements. Cellular nucleic acids (DNAcell and RNAcell,
261
Supplementary Figure S5A and B), pigment fluorescence (fluorescence of Chl a and 262
phycoerythrin; Supplementary Figure S4C and D), and cell quotas (Supplementary Figure S4) all 263
varied in a positive linear relationship with FSCH (t-test, P < 0.05) regardless of limitation type 264
(Supplementary Figure S1). Thus, the effect of growth on cell size was linked to a general 265
increase in cellular mass. Furthermore, the fluorescence of cellular pigments (Chl. a and 266
phycoerythrin) was elevated under P-limitation in comparison with N-limitation (analysis of 267
covariance, F1,32 > 9; P < 0.05; Supplementary Figure S4C and D), suggesting an additional 268
effect of limitation type. 269
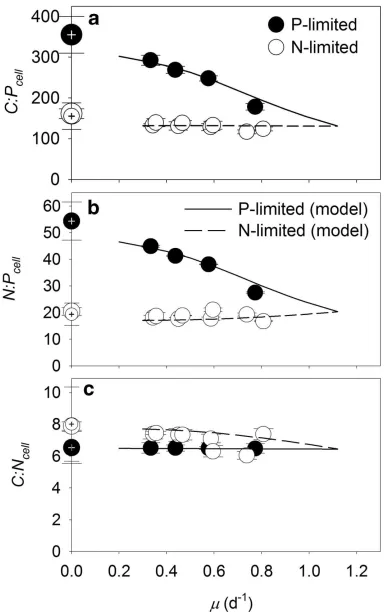
We next identified the role of nucleic acids in setting QP, as P in RNA has previously
270
been shown to be an important driver of elemental stoichiometry (Sterner and Elser, 2002). First, 271
we observed that the proportion of QN in nucleic acids increased as a function of growth under
272
nucleic acid concentrations (Figure 3a, triangles). Despite this positive relationship, the 274
proportion of QP devoted to nucleic acids (Figure 3b and c) declined as a function of increasing
275
growth in P-limited cultures (P < 0.05; Figure 3a, closed circles). This declining contribution 276
suggested that P-containing cellular resources other than nucleic acids also varied in a positive 277
relationship with P-limited growth. This effect was not observed under N-limitation, however, 278
suggesting a tradeoff between non-nucleic acid, P-containing cellular resources or function under 279
N-limited growth (e.g. between storage and physiologically active P-containing resources; Figure 280
3a). 281
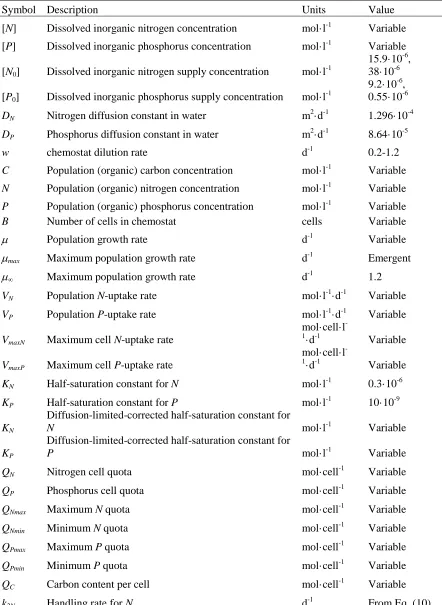
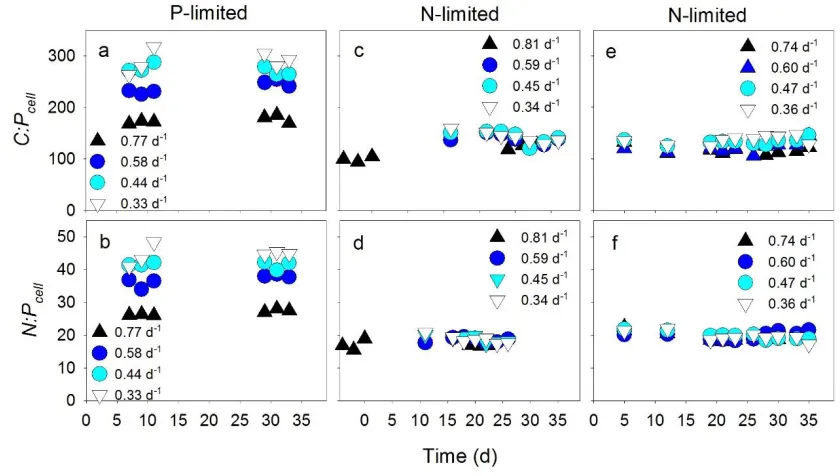
We then identified trends in cellular elemental stoichiometry of Synechococcus. C:Pcell
282
and N:Pcell of Synechococcus declined as a linear function with increasing growth (t-test, P <
283
0.05; Figure 4a and b) under P limitation. In contrast to the negative linear relationship between 284
N:Pcell and P-limited growth, N:Pcell was stable under N-limited growth (t-test, P > 0.05). C:Pcell
285
only decreased marginally with N-limited growth (t-test, P < 0.05, Figure 4b). C:Ncell was
286
generally elevated in slow-growing N-limited cultures in comparison with slow-growing P-287
limited cultures, but was more variable at higher growth rates (Figure 4c). Because of the strong 288
contrast between our observations, some previous findings, and models of phytoplankton 289
stoichiometry under N-limitation, we repeated our N-limited trials with Synechococcus and 290
ensured our results could be replicated (Figure 4). 291
While the observed behavior of QP and QN initially mimicked Droop model curves, we
292
were not able to replicate empirical trends in cellular elemental ratios by using existing Droop-293
based variable quota models nor by using more mechanistic quota-based models with fixed 294
minimum and maximum elemental quota values (Klausmeier et al., 2004a; Legović and 295
all three elemental quotas and cell size (common to all existing models) is the reason for this 297
failure to replicate our data. Thus, we modified an existing physiological model (Bonachela et 298
al., 2013) to include growth-dependent changes in cell size that influence cellular elemental 299
quotas as well as their maximum and minimum values, which in turn are key in the regulation of 300
nutrient-uptake proteins (see Supplementary Information). Our expanded model captures the 301
observed relationship between cellular elemental stoichiometry and growth (Figure 4) including 302
the “Droop-like” behavior for all cellular elemental quotas. Only the inclusion of growth-303
dependent cell size and quota-dependent protein regulation enabled the replication of the 304
observed behavior. Importantly, these two key underlying mechanisms are fundamentally 305
different than those in the Droop model, and confirm the strong influence of cell size on the 306
resulting cellular elemental quotas and ratios. 307
Discussion 308
Using controlled chemostat cultures of an isolate representing one of the most abundant 309
marine phytoplankton lineages, we observed strong inconsistencies between our data and some 310
fundamental conceptual mechanisms that have commonly been invoked to understand the 311
elemental composition of phytoplankton. First, although RNAcell and DNAcell increased with
312
increasing growth rate, thereby supporting a key aspect of the growth rate hypothesis (Sterner 313
and Elser, 2002). However, the proportion of QP devoted to nucleic acids did not increase with
314
increasing growth, suggesting that P in nucleic acids is not the central driver of the cellular 315
elemental stoichiometry of Synechococcus within this growth rate range. Our estimates of this 316
proportion agree with previous estimates indicating that RNAcell is low in Synechococcus
317
(Mouginot et al., 2015) and imply that P-rich biomolecules other than nucleic acids also co-vary 318
are very close to max, however, and in absence of max data for WH8102, our high growth rate 320
cultures represent ~67-73% of max of a related isolate of Synechococcus (Moore et al., 1995). 321
Nucleic acids might also have a stronger influence on stoichiometric differences across lineages 322
where maximum growth rates are vastly different (Elser et al., 2000), rather than within a single 323
isolate. 324
A second departure from the accepted conceptual models of cellular elemental 325
stoichiometry is the observed role of cell size and associated quotas as a function of growth. 326
Although none of the previous theoretical models include growth-dependent variability in cell 327
size, our data indicate that cell size and all of the cell components that we measured (QC,QN, QP,
328
DNAcell, RNAcell, and cellular pigment fluorescence) were positively related to the cellular growth
329
rate (Figure 2, Supplementary Figures S4 and S5). Thus, cell size is a critical ingredient in our 330
expanded model of cellular elemental stoichiometry because it allows QC,QN, and QP to change
331
as a function of growth, however disproportionately. In support of this, some previous data 332
acknowledge growth-dependent changes in cell size of phytoplankton (Cook, 1963). However, 333
QC or cell size has typically been held constant under variable growth rates in previous
334
theoretical models (e.g., Shuter, 1979; Klausmeier et al., 2008; Bonachela et al., 2013). Instead, 335
theoretical models typically rely on the Droop model equation to describe growth-dependent 336
relationships in the ratios of cellular elements. The positive relationship between cell size and 337
growth rate is a common observation within specific isolates of microbes and has been termed 338
the growth rate law (Schaechter et al., 1958; Vadia and Levin, 2015). 339
Although the Droop model equation fits our QN and QP data well, the model’s underlying
340
mechanism is fundamentally different than the cell-size/growth-rate relationship. The traditional 341
(such as QN or QP), whereas our data demonstrate that the cell-size/growth relationship
343
contributes to growth-dependent changes in all three of the cellular elemental quotas that we 344
measured. For example, the Droop model fits our QC data very well, but this fit did not result
345
from carbon limitation, as the Droop model would predict. Instead, changes in QC were directly
346
related to growth-dependent changes in cell size, and the Droop model coincidentally fit these 347
changes in cell size, which did not result from differences in the carbon supply. This is also 348
evident from our QN data, which follow the Droop model relationship in contrasting P-limited
349
chemostats. Under P-limited growth, nitrate was in high abundance but QN fit the Droop model
350
in nearly the same way as N-limited cells (Fig. 1b). Therefore, the Droop model fit to QN and QP
351
do not result directly from N or P acquisition, but instead, as our model confirms, results from 352
the cell-size/growth-rate relationship. Thus, by decoupling the equations for the population 353
carbon and number of cells, we achieved a dynamic regulation of QC (and hence a
cell-354
size/growth-rate link), which together with the dynamics of QN and QP and their effect on protein
355
regulation, was necessary to predict our observed trends in cellular elemental stoichiometry of 356
Synechococcus. 357
In contrast with Droop-based models of phytoplankton stoichiometry, where C:Pcell and
358
N:Pcell change sharply as a function of P-limited growth (Klausmeier et al., 2004a; Bonachela et
359
al., 2013), our model and data indicate that C:Pcell and N:Pcell of Synechococcus decrease almost
360
linearly as a function of P-limited growth (Figure 4a and b). We also obtained marginal changes 361
in C:Pcell and no change in N:Pcell as a function of N-limited growth, and collectively, these
362
trends have been observed in other phytoplankton (Goldman et al., 1979). The invariable N:Pcell
363
under N-limited growth is remarkable for the globally abundant Synechococcus because N:Pcell is
364
among field populations (Moore et al., 2013). Understanding environmental controls on cellular 366
elemental stoichiometry in the small but dominant prokaryotic phytoplankton lineages under N-367
limitation might be key to understanding the primary drivers of Redfield stoichiometry in the 368
oceans. But the mechanisms that contribute to variability in cellular elemental stoichiometry may 369
be different for different lineages because this invariable trend does not appear to be consistent 370
across lineages of phytoplankton (Goldman et al., 1979). 371
We also observed moderate decreases in C:Ncell under severely P-limited growth in
372
comparison with severely N-limited growth, which seem to be related to cell size and pigment 373
fluorescence (Fig. 4). N-limited cells were larger than P-limited cells, evident from differences in 374
FSCH (Figure 2) and QC (Figure 1a) between these two treatments. Despite differences in cell
375
size, QN was relatively invariable between N and P-limited cells (Figure 1b). This generally
376
resulted in elevated C:Ncell in slow-growing N-limited cells in comparison with other treatments
377
(Figure 4c), which, based on our pigment fluorescence data, seems to be caused by higher 378
cellular concentrations of N-rich pigments in P-limited cells (Supplementary Figure S5C and D). 379
Since phycoerythrin, a dominant pigment in Synechococcus (Scanlan et al., 2009), is composed 380
of protein, and proteins comprise a large portion of QN (Rhee, 1978; Lourenço et al., 1998), the
381
rigidity in QN between P- and N-limited cells may be caused by differences in phycoerythrin,
382
which is known to play a dual role in photosynthesis and N-storage (Wyman et al., 1985; Yeh et 383
al., 1986). Thus, the decline in C:Ncell in severely P-limited cells seems to result from the
384
combined effect of smaller cells and higher pigment fluorescence in comparison with severely 385
N-limited cells. 386
In general, small phytoplankton are thought to lack major nutrient storage reservoirs. 387
or P storage in Synechococcus. Some theoretical models rely on cellular storage components to 389
predict cellular stoichiometry (Daines et al., 2014), but our observed changes in QN with growth
390
were mainly dependent on changes in cell size, regardless of limitation type. This observation is 391
consistent with the general lack of the major N-storage compound – cyanophycin - in 392
Synechococcus isolates (Wingard et al., 2002). In models, QN or QP increase as a function of
393
decreasing growth in environments, where N or P is abundant, respectively (i.e. where P or N is 394
limiting growth, respectively) (Klausmeier et al., 2004a; Klausmeier et al., 2008). Although 395
pigments probably contributed to minor N storage under slow P-limited growth, the large 396
increases in N:Pcell (Figure 4b) in our experiments did not result from abundant increases in
397
cellular N storage, as QN was roughly linked to cell volume (Supplementary Figure S6A, closed
398
symbols). Instead, the strong variation in N:Pcell as a function of P-limited growth (Figure 4b)
399
resulted from stronger changes in QP (Figure 1c) relative to moderate changes in cell size (i.e.
400
QC) (Figure 1a) and relative to small changes in QN under limitation. Even under slow
N-401
limited growth, cells did not store P in high excess either; changes in QP in P-replete
402
environments were also tightly linked to changes in cell volume (Supplementary Figure S6B, 403
open symbols). Thus, the major variation in C:Pcell and N:Pcell within Synechococcus (Figure 4a
404
and b) seems to be driven by a larger change in QP relative to changes in cell size (QC) and QN
405
under P-limited growth, in comparison with small changes in QN relative to changes in cell size
406
(QC) and QP under N-limited growth. But we did not observe drastic increase in QP or QN under
407
different N- or P-limited environments as modeled previously (Klausmeier et al., 2004a), 408
indicating that N and P were not stored in high abundance in N- or P-replete environments, 409
In consideration of how C:Pcell and N:Pcell varies relative to cell size (QC) and QN in P-
411
and N-limited environments, we postulate that variable cell concentrations of P-rich 412
biomolecules must be major drivers of stoichiometric variation in Synechococcus. Cellular 413
phospholipid concentrations are known to decline under P-limitation (Van Mooy et al., 2006) but 414
in general do not represent a large proportion of cellular P (Mouginot et al., 2015). Although 415
much less is known about polyphosphates in Cyanobacteria, they may also co-vary with growth 416
in Synechococcus, as documented in another species of phytoplankton (Rhee, 1973). While some 417
data suggest that the adenylate pool increased with increasing growth rate in heterotrophic 418
Bacteria (Marriot et al., 1981), adenosine triphosphate in Synechococcus WH8102 was highly 419
correlated with FSCH regardless of the chemostat dilution rate and represented less than 1% of 420
QP in another experiment (unpublished data). The general lack of major storage reservoirs in
421
small Cyanobacteria may be key to distinguishing trends in cellular elemental stoichiometry 422
from those in larger phytoplankton, as previous data with diatoms suggest that QC increases with
423
decreasing P-limited growth (Laws and Bannister, 1980), contrasting the diminishing QC with
424
decreasing growth of Synechococcus (Figure 1a). 425
Ecological implications 426
Our results may be applied to broadly understand the physiological status of unicellular 427
Cyanobacteria in the ocean. If we compare our results with stoichiometric data compiled by 428
Martiny et al. (2013) and inversely estimated by Teng et al. (2014), the high C:P ratios observed 429
in the P-limited North Atlantic Subtropical Gyre (Lomas et al., 2010; Moore et al., 2009) are 430
congruent with C:Pcell of Synechococcus when growth rates are strongly P-limited. In contrast,
431
the moderate C:P ratios (but above Redfield proportions) observed in the presumed N-limited 432
observed in slower growing N-limited cultures. The low C:P estimates in the eastern equatorial 434
Atlantic upwelling region (where nutrients are abundant) are consistent with a high frequency of 435
fast-growing Synechococcus cells. Thus, our data and model seem to corroborate the 436
physiological status of biota in major ocean basins and our observations suggest that cell size and 437
lack of elemental storage capacity influence cellular elemental stoichiometry of small marine 438
phytoplankton within field populations. In comparison with data collected from other species of 439
phytoplankton, our findings further suggest that fundamentally different biochemical 440
mechanisms might control the cellular elemental stoichiometry of small vs. large phytoplankton, 441
such as Cyanobacteria vs. eukaryotes. Such biochemical mechanisms can contribute to 442
understanding broad scale patterns in ocean biogeochemistry and regional differences in C:N:P. 443
As studies of environmental controls on cellular elemental stoichiometry emerge among broader 444
lineages of phytoplankton, we might begin to forecast how ocean biogeochemical cycles will 445
respond to global change. 446
Acknowledgments 447
Support for this research was provided by the UCI Chancellor’s ADVANCE Postdoctoral 448
Program and the National Science Foundation Dimensions of Biodiversity (OCE-1046297) and 449
Major Research Instrumentation programs (OCE-1126749). JAB acknowledges support of the 450
MASTS pooling initiative (The Marine Alliance for Science and Technology for Scotland). 451
MASTS is funded by the Scottish Funding Council (grant reference HR09011) and contributing 452
institutions. 453
Conflict of Interest 454
The authors declare no conflict of interest. 455
References 458
Bertilsson S, Berglund O, Karl DM, Chisholm SW. (2003). Elemental composition of marine 459
Prochlorococcus and Synechococcus: Implications for the ecological stoichiometry of the sea. 460
Limnol Oceanogr 48: 1721–1731. 461
Bonachela JA, Allison SD, Martiny AC, Levin SA. (2013). A model for variable phytoplankton 462
stoichiometry based on cell protein regulation. Biogeosciences 10: 4341–4356. 463
Claquin P, Martin-jézéquel V, Kromkamp JC, Veldhuis MJW, Kraay GW. (2002). Uncoupling 464
of silicon compared with carbon and nitrogen metabolisms and the rol of the cell cycle in 465
continuous cultures of Thalassiosira pseudonana (Bacillariophyceae) under light, nitrogen, and 466
phosphorus control. J Phycol 38: 922–930. 467
Cook JR. (1963). Adaptations in growth and division in euglena effected by energy supply. J 468
Protozool 10: 436–444. 469
Daines SJ, Clark JR, Lenton TM. (2014). Multiple environmental controls on phytoplankton 470
growth strategies determine adaptive responses of the N : P ratio. Ecol Lett 17: 414–425. 471
DeVries T, Deutsch C. (2014). Large-scale variations in the stoichiometry of marine organic 472
matter respiration. Nat Geosci 7: 890–894. 473
Droop MR. (1968). Vitamin B12 and marine ecology. IV. The kinetics of uptake, growth and 474
inhibtition in Monochrysis lutheri. J Mar Biol Ass UK 48: 689–733. 475
Dyhrman ST, Palenik B. (2001). A single-cell immunoassay for phosphate stress in the 476
dinoflagellate Prorocentrum minimum (Dinophyceae). J Phycol 37: 400–410. 477
Elser JJ, O’Brien WJ, Dobberfuhl DR, Dowling TE. (2000). The evolution of ecosystem 478
processes: growth rate and elemental stoichiometry of a key herbivore in temperate and arctic 479
habitats. J Evol Biol 13: 845–853. 480
Elser JJ, Sterner RW, Gorokhova E, Fagan WF, Markow TA, Cotner JB, et al. (2000). Biological 481
stoichiometry from genes to ecosystems. Ecol Lett 3: 540–550. 482
Finkel Z V, Beardall J, Flynn KJ, Quigg A, Rees TA V, Raven JA. (2010). Phytoplankton in a 483
changing world: cell size and elemental stoichiometry. J Plankton Res 32: 119–137. 484
Flombaum P, Gallegos JL, Gordillo RA, Rincón J, Zabala LL, Jiao N, et al. (2013). Present and 485
future global distributions of the marine Cyanobacteria Prochlorococcus and Synechococcus. 486
Proc Natl Acad Sci U S A 110: 9824–9. 487
Fu FX, Warner ME, Zhang Y, Feng Y, Hutchins DA. (2007). Effects of increased temperature 488
and CO2 on photosynthesis, growth, and elemental ratios in marine Synechococcus and 489
Prochlorococcus (Cyanobacteria). J Phycol 43: 485–496. 490
Galbraith ED, Martiny AC. (2015). A simple nutrient-dependence mechanism for predicting the 491
stoichiometry of marine ecosystems. Proc Natl Acad Sci 112: 201423917. 492
Geider R, La Roche J. (2002). Redfield revisited: variability of C:N:P in marine microalgae and 493
its biochemical basis. Eur J Phycol 37: 1–17. 494
Geider RJ, MacIntyre HL, Kana TM. (1998). A dynamic regulatory model of phytoplanktonic 495
acclimation to light, nutrients, and temperature. Limnol Oceanogr 43: 679–694. 496
composition of phytoplankton in oceanic waters. Nature 279: 210–215. 498
Healey F. (1985). Interacting effects of light and nutrient limitation on the growth rate of 499
Synechococcus linearis (Cyanophyceae). J Phycol 21: 134–146. 500
Heldal M, Scanlan DJ, Norland S, Thingstad F, Mann NH. (2003). Elemental composition of 501
single cells of various strains of marine Prochlorococcus and Synechococcus using X-ray 502
microanalysis. Limnol Oceanogr 48: 1732–1743. 503
Ho T-Y, Quigg A, Finkel ZV, Milligan AJ, Wyman K, Falkowski PG, et al. (2003). The 504
elemental composition of some marine phytoplankton. J Phycol 39: 1145–1159. 505
Klausmeier CA, Litchman E, Daufresne T, Levin SA. (2004). Optimal nitrogen-to-phosphorus 506
stoichiometry of phytoplankton. Nature 429: 171–174. 507
Klausmeier CA, Litchman E, Daufresne T, Levin SA. (2008). Phytoplankton stoichiometry. Ecol 508
Res 23: 479–485. 509
Klausmeier CA, Litchman E, Levin SA. (2004). Phytoplankton growth and stoichiometry under 510
multiple nutrient limitation. Limnol Oceanogr 49: 1463–1470. 511
Kretz CB, Bell DW, Lomas DA, Lomas MW, Martiny AC. (2015). Influence of growth rate on 512
the physiological response of marine Synechococcus to phosphate limitation. Front Microbiol 6: 513
6–11. 514
Laws EA, Bannister TT. (1980). Nutrient- and light-limited growth of Thalassiosira fluviatilis in 515
continuous culture, with implications for phytoplankton growth in the ocean. Limnol Oceanogr 516
25: 457–473. 517
Legović T, Cruzado A. (1997). A model of phytoplankton growth on multiple nutrients based on 518
the Michaelis-Menten-Monod uptake, Droop’s growth and Liebig's law. Ecol Modell 99: 19–31. 519
Lehman JT, Botkin DB, Likens GE. (1975). The assumptions and rationales of a computer model 520
of phytoplankton dynamics. Limnol Oceanogr 20: 343–364. 521
Lomas MW, Burke AL, Lomas DA, Bell DW, Shen C, Dyhrman ST, et al. (2010). Sargasso Sea 522
phosphorus biogeochemistry: an important role for dissolved organic phosphorus (DOP). 523
Biogeosciences 7: 695–710. 524
Lourenço SO, Barbarino E, Marquez UML, Aidar E. (1998). Distribution of intracellular 525
nitrogen in marine microalgae: Basis for the calculation of specific nitrogen-to-protein 526
conversion factors. J Phycol 34: 798–811. 527
Marriot ID, Edwin AD, Rowley BI. (1981). Effect of growth rate and nutrient limitation on the 528
adenine nucleotide content , energy charge and enzymes of adenylate metabolism in Azotobacter 529
beijerinckii. J Gen Microbiol 125: 375–382. 530
Martin P, Dyhrman ST, Lomas MW, Poulton NJ, Van Mooy BAS. (2014). Accumulation and 531
enhanced cycling of polyphosphate by Sargasso Sea plankton in response to low phosphorus. 532
Proc Natl Acad Sci U S A 111: 8089–94. 533
Martiny AC, Pham CTA, Primeau FW, Vrugt JA, Moore JK, Levin SA, et al. (2013). Strong 534
latitudinal patterns in the elemental ratios of marine plankton and organic matter. Nat Geosci 6: 535
279–283. 536
Michaels A, Dow R, Elardo K. (1997). The determination of phosphorus in seawater. In: 537
Michaels A, Dow R, Howse F. (1997). The determination of nitrate in seawater. In: Bermuda 539
Atlantic Time-series Study Methods, pp 61–66. 540
Moore CM, Mills MM, Achterberg EP, Geider RJ, LaRoche J, Lucas MI, et al. (2009). Large-541
scale distribution of Atlantic nitrogen fixation controlled by iron availability. Nat Geosci 2: 867– 542
871. 543
Moore CM, Mills MM, Arrigo KR, Berman-Frank I, Bopp L, Boyd PW, et al. (2013). Processes 544
and patterns of oceanic nutrient limitation. Nat Geosci 6: 701-710. doi:10.1038/ngeo1765. 545
Moore LR, Goericke R, Chisholm S. (1995). Comparative physiology of Synechococcus and 546
Prochlorococcus: influence of light and temperature on the growth, pigments, fluorescence and 547
absorptive properties. Mar Ecol Prog Ser 116: 259–275. 548
Van Mooy BAS, Rocap G, Fredricks HF, Evans CT, Devol AH. (2006). Sulfolipids dramatically 549
decrease phosphorus demand by picocyanobacteria in oligotrophic marine environments. Proc 550
Natl Acad Sci U S A 103: 8607–8612. 551
Morel FMM. (1987). Kinetics of nutrient uptake and growth in phytoplankton. J Phycol 23: 137– 552
150. 553
Mouginot C, Zimmerman AE, Bonachela JA, Fredricks H, Allison SD, Van Mooy BAS, et al. 554
(2015). Resource allocation by the marine cyanobacterium Synechococcus WH8102 in response 555
to different nutrient supply ratios. Limnol Oceanogr 60: 1634-1641. doi:10.100/lno10123. 556
Pahlow M, Oschlies A. (2009). Chain model of phytoplankton P, N and light colimitation. Mar 557
Ecol Prog Ser 376: 69–83. 558
Rao NN, Gómez-García MR, Kornberg A. (2009). Inorganic polyphosphate: essential for growth 559
and survival. Annu Rev Biochem 78: 605–647. 560
Rhee GY. (1978). Effects of N:P atomic ratios nitrate limitation on algal growth, cell 561
composition, nitrate uptake. Limnol Oceanogr 23: 10–25. 562
Rhee G-Y. (1973). A continuous culture study of phosphate uptake, growth rate, and 563
polyphosphate in Scenedesmus sp. J Phycol 9: 495–506. 564
Scanlan DJ, Ostrowski M, Mazard S, Dufresne A, Garczarek L, Hess WR, et al. (2009). 565
Ecological genomics of marine picocyanobacteria. Microbiol Mol Biol Rev 73: 249–299. 566
Schaechter M, MaalOe O, Kjeldgaard NO. (1958). Dependency on medium and temperature of 567
cell size and chemical composition during balanced growth of Salmonella typhimurium. J Gen 568
Microbiol 19: 592–606. 569
Shuter B. (1979). A model of physiological adaptation in unicellular algae. J Theor Biol 78: 519– 570
552. 571
Sterner RW, Elser JJ. (2002). Ecological stoichiometry: The biology of elements from molecules 572
to the biosphere. Princeton University Press. 573
Sterner RW, Elser JJ, Fee EJ, Guildford SJ, Chrzanowski TH. (1997). The light: nutrient ratio in 574
lakes: the balance of energy and materials affects ecosystem structure and process. Am Nat 150: 575
663–684. 576
Teng Y-C, Primeau FW, Moore JK, Lomas MW, Martiny AC. (2014). Global-scale variations of 577
Urabe J, Kyle M, Makino W, Yoshida T, Andersen T, Elser JJ. (2002). Reduced light increases 579
herbivore production due to stoichiometric effects of light/nutrient balance. Ecology 83: 619– 580
627. 581
Vadia S, Levin PA. (2015). Growth rate and cell size: a re-examination of the growth law. Curr 582
Opin Microbiol 24: 96–103. 583
Verspagen JMH, Van de Waal DB, Finke JF, Visser PM, Huisman J. (2014). Contrasting effects 584
of rising CO2 on primary production and ecological stoichiometry at different nutrient levels. 585
Ecol Lett 17: 951–960. 586
Waterbury J, Willey JM. (1988). Isolation and growth of marine planktonic Cyanobacteria. 587
Methods Enzymol 167: 100–105. 588
Wingard LL, Miller SR, Sellker JML, Stenn E, Allen MM, Wood a. M. (2002). Cyanophycin 589
production in a phycoerythrin-containing marine Synechococcus strain of unusual phylogenetic 590
affinity. Appl Environ Microbiol 68: 1772–1777. 591
Wyman M, Gregory RP, Carr NG. (1985). Novel role for phycoerythrin in a marine 592
cyanobacterium, Synechococcus strain DC2. Science 230: 818–820. 593
Yeh SW, Ong LJ, Glazer AN. (1986). Role of phycoerythrin in marine picoplankton 594
Synechococcus spp. 234: 1422–1423. 595
Zimmerman AE, Allison SD, Martiny AC. (2014). Phylogenetic constraints on elemental 596
stoichiometry and resource allocation in heterotrophic marine bacteria. Environ Microbiol 16: 597
1398-1410. doi:10.1111/1462-2920.12329. 598
Zimmerman AE, Martiny AC, Lomas MW, Allison SD. (2014). Phosphate supply explains 599
variation in nucleic acid allocation but not C:P stoichiometry in the western North Atlantic. 600
Biogeosciences 11: 1599–1611. 601
Figure legends 602
603
Figure 1 Interactive influence of growth rate and nutrient supply on cellular quotas of 604
Synechococcus. Cellular carbon (QC, a), nitrogen (QN, b), and phosphorus (QP, c) quotas of
605
Synechococcus as a function of steady-state growth () in chemostat cultures limited by nitrate 606
(open symbols) or phosphate (closed symbols). Data were fitted to the Droop model ( = ∞ · [1
607
- Q’min/Q]) for P-limited (solid lines), and N-limited (dasheda and dottedb lines) cells, where is
608
the growth rate, ∞ is the conditional maximum growth rate, Q’min is the conditional minimum
609
elemental quota and Q is the elemental quota. Largea and smallb open symbols represent data 610
from independent, N-limited culture trials. Standard deviations are plotted on means of triplicate 611
613
Figure 2 Growth-dependent changes in cell size of Synechococcus. Cell size (estimated with a 614
cell carbon to cell volume relationship) (a) and forward scatter (FSCH, a proxy for cell diameter; 615
b) of Synechococcus cells as a function of steady-state growth () in chemostatic cultures limited 616
by nitrate (open symbols) or phosphate (closed symbols). Open circles represent data from two 617
independent, N-limited culture trials. Standard deviations are plotted on means of triplicate 618
measurements from the last 3 sampling time points during a trial. 619
620
Figure 3 Proportion of cellular nitrogen and phosphorus quotas devoted to nucleic acids. 621
Cellular nitrogen (N, triangles) and phosphorus (P, circles) in total cellular nucleic acids (a), 622
cellular RNA (b) and cellular DNA (c) as a proportion of total cellular N and P, respectively, as a 623
function of steady-state growth () in chemostatic cultures of Synechococcus limited by nitrate 624
(open symbols) or phosphate (closed symbols). Open symbols represent data from two 625
independent, N-limited culture trials. Standard deviations are plotted on means of triplicate 626
measurements from the last 3 sampling time points during a trial. 627
628
Figure 4 Interactive influence of growth rate and nutrient limitation on cellular stoichiometry of 629
Synechococcus. Cellular elemental ratios of carbon:phosphorus (C:Pcell, a), nitrogen:phosphorus
630
(N:Pcell, b) and carbon:nitrogen (C:Ncell, c) as a function of steady-state growth () in
631
chemostatic cultures of Synechococcus limited by nitrate (open circles, C:Pcell: r2 = 0.65, slope =
632
-35.7; y-intercept = 150) or phosphate (closed circles; C:Pcell: r2 = 0.97; slope = -255 y-intercept
633
= 381; N:Pcell: p < 0.05, r2 = ; slope = -38.9; y-intercept = 58.6). Open circles represent data from
634
ratios from conditional minimum elemental quotas (Q’min) from Droop models in Figure 1.
636
Standard deviations are plotted on means of triplicate measurements from the last 3 sampling 637
time points during a trial. Model output data are also included (see further details in 638
Supplementary Information). 639
Figure 1: 641
[image:28.612.149.465.91.662.2]Figure 2: 644
645 646
Figure 3: 647
[image:29.612.36.534.81.712.2]Figure 4: 649
[image:30.612.114.499.90.702.2]Supplementary Information 651
652
Elemental ratios under N-limitation 653
A previous study of elemental stoichiometry suggested that N:Pcell was near 10 in
slow-654
growing N-limited cultures (Mouginot et al., 2015), whereas our data indicate the N:Pcell was
655
near 18 at a similar growth rate (Figure 4, main text). Although we do not know the reason for 656
this difference, there were several differences between the data and methods that were 657
implemented in these two studies. First, we note that QC varied by nearly an order of magnitude
658
in the previous study but was relatively stable in our trials (Supplementary Figure S1). Second, 659
we used an artificial seawater medium, whereas natural seawater was used in the previous study. 660
Third, the methods used for analyzing particulate organic phosphorus were different between 661
these two studies. For example, in the previous study, the method excluded a rinsing technique 662
with a sodium sulfate solution to remove extracellular phosphorus from the analysis of 663
particulate organic phosphorus. Lastly, the total biomass, iron and phosphorus concentrations in 664
chemostat cultures were considerably higher during the previous study, while the light intensity 665
was nearly an order of magnitude lower in comparison with our study. 666
Model Description 667
We built on an existing model in order to reproduce the phenomenology presented in the 668
main text. The modifications enabled replicating the observed behavior, which allowed us to 669
identify key biological mechanisms responsible for such behavior. 670
Starting point 671
The model, introduced in Bonachela et al. (2013), keeps track of the dynamics of carbon, 672
C, nitrogen, N, and phosphorus, P, of a generic phytoplankton population. In the present paper, 673
our laboratory experiments (see main text and Supplementary Table S2). In addition, we 675
considered chemostat conditions with a dilution rate set by w; thus, the equations for the 676
inorganic N and P concentrations, [N] and [P] respectively, are given by: 677
N N
VNw dt
N
d
] [ ] [ ] [ 0 (1)
P P
VPw dt
P
d
] [ ] [ ] [ 0 (2)
where [N0] and [P0] represent the input concentrations, and VN and VPrepresent the population-679
level uptake, of N and P, respectively. 680
Similarly to the original model, the population-level equations for N and P are simple 681
balance equations given by: 682 wN V dt dN N (3) wP V dt dP P (4)
Therefore, the population N and P increase through uptake and decrease due to dilution (washout 684
of individuals). For the sake of simplicity, we consider that any source of exudation or 685
consumption of N and P is negligible when compared with uptake or dilution rates. The 686
population-level uptake rates are given by the equations: 687 ) ( ~ ] [ ] [ )
( max B t
K N N V t V N N N (5) ) ( ~ ] [ ] [ )
( max B t
where B(t) is the number of cells in the population, VmaxX represents the cell-level maximum
689
uptake rate for nutrient X, and ǨX a generalized expression for the half-saturation constant linked
690
to nutrient X given by: 691 N c N N N K r D V K K N 4 1 ~ max (7) P c P P P K r D V K K P 4 1 ~ max (8)
where KX is the standard half-saturation constants associated with the uptake of nutrient X, DX is 693
the diffusivity of the element in the medium, and rc is the cell radius. Note that this generalized 694
expression for the half-saturation constant is affected by changes in VmaxX (for instance, when
695
resource availability changes), which allows the uptake rate expressions above (Eqs.5 and 6) to 696
show well-known extreme cases (diffusion- versus handling-limitation uptake rates) (Bonachela 697
et al., 2011). 698
Also similarly to the original model, we consider here the possibility for the phytoplankton 699
cell to alter the number of proteins used to take up the different nutrients. This number of 700
proteins is linked to the maximum uptake rate; if nX is the number of uptake proteins for nutrient 701
X in the population (Bonachela et al., 2011): 702
A
X
t
B
t
N
n
k
V
X
X 2
(
)
/
(
)
max
(9)where NA is Avogadro’s number, and k2X is the nutrient ion handling rate: 703
A X c
X
r
K
N
D
k
X
4
2
(10)To establish the dynamics of this number of proteins, we define the expressionfunction, F, 704
and the repression function, G. The expression function represents the synthesis strategy of the 705
such nutrient, QX (nutrient quota; Droop, 1968). Specifically, if the quota is low (close to the
707
minimum required to grow, Qmin), the cell upregulates the synthesis of proteins to compensate for
708
the lack of the limiting nutrient by increasing its maximum uptake rate and, therefore, the 709
probability of acquiring a nutrient when the cell encounters that nutrient; on the other hand, if the 710
quota is close to the maximum that the cell can store, Qmax, synthesis is downregulated to save
711
maintenance and synthesis energy that can be thus allocated to growth. This behavior, which has 712
been theoretically justified and experimentally shown in the past (Dyhrman and Palenik, 2001; 713
Morel, 1987) can be encoded using the following functional form (Bonachela et al., 2011): 714 , 1 1 2 min max max min max max Q Q Q Q kF e Q Q Q Q F (11)
where kFis a shape factor. Similarly, the repression function sets a constraint for this strategy 715
according to the availability of ribosomes, responsible for protein synthesis. Ribosomes are 716
phosphorus-rich; therefore, the lower the P quota, the smaller the repression function is, thus 717
limiting protein synthesis (Bonachela et al., 2013): 718 , 1 1 2 , min max min 1 , min max min G P P P P G k Q Q Q Q k P P P P e Q Q Q Q G (12)
where kG,1 and kG,2 are factors that shape the exponential function. 719
With the elements above, the dynamics for the number of N-uptake proteins, nN, and the 720
dynamics for the number of P-uptake proteins, nP, is given by: 721
1 ( )
( ) ( ) ( ) ( ),min max min min max max t wn t B Q Q Q t Q G Q Q t Q Q F t A H dt dn N P P P P N N N N rel N N
1 ( )
( ) ( ) ( ) ( ), min max min min max max t wn t B Q Q Q t Q G Q Q t Q Q F t A H dt dn P P P P P P P P P rel P P
(14)where νX is the maximum synthesis rate per cell and unit time, and H is a Heaviside function that 723
represents the physical impossibility for cells to store more uptake proteins beyond their total 724
surface area (Arel is the ratio absorbing to total area, assuming circular transporter and cell 725
surfaces). 726
Note that the equations above transform Vmax into a dynamic variable that responds to the 727
whole nutritional history of the cell. Importantly, through this dependence on the past and 728
present values of the cell quota, the cell develops a link between Vmax and the external nutrient 729
concentration that allows the generalized expressions for the uptake rates above, Eqs.5 and 6, to 730
show the two well-known extreme cases mentioned above, i.e. diffusion limitation (when Vmax is 731
large, which occurs when the focal nutrient concentration is low), and handling-limitation (when 732
Vmax is small, which occurs when the focal nutrient concentration is large). See (Bonachela et al., 733
2011, 2013) and references therein for more detailed information about the deduction of all these 734
expressions and functions. 735
Different from the original model, the variability observed in the per-cell C content (or C 736
quota, QC) makes it necessary for the model to separately keep track of the dynamics of C and the
737
number of cells in the population, B (Bonachela et al., 2013). With such a dynamic approach, the 738
stationary value for QC shown by the cell emerges from the mechanisms considered in the model,
739
as opposed to imposing a Droop-like dependence for QC on the dilution rate, w.
740
The equation for the population-level C is also a balance equation that considers photosynthesis 741
as the only source of organic carbon, and respiration and dilution as the only negative terms 742