AN APPROACH TO MICROSTRUCTURE MODELLING IN NICKEL BASED SUPERALLOYS
Aleksey Reshetov1, Olga Bylya1, Nicola Stefani2, Malgorzata Rosochowska1, Paul Blackwell11
Advanced Forming Research Centre, University of Strathclyde, 85 Inchinnan Drive, Inchinnan, Renfrewshire, PA4 9LJ, UK 2
Department of Design, Manufacture and Engineering Management, University of Strathclyde, 75 Montrose Street, Glasgow, G1 1XJ, UK
Keywords: ATI 718Plus®, Microstructure evolution, FEM, Recrystallisation, Grain Growth, Plastic work, Aerofoil Manufacturing Process
Abstract
Mechanical properties of components made from nickel based superalloys rely on the microstructure that forms during their thermomechanical processing. The ability for predicting and controlling microstructure during the processing is of the utmost importance for this class of alloys. In this work, the applicability of JMAK-type (Johnson-Mehl-Avrami-Kolmogorov) models is studied in the context of industrial manufacturing processes. The results of FEA (finite element analysis) based predictions of microstructure evolution in ATI 718Plus® alloy during the hot deformation process are presented. The limitations of the JMAK-type approach are discussed in the paper and concepts for an alternative modelling approach for microstructure prediction in nickel based superalloys are presented.
Introduction
Nickel alloys are usually used in the aerospace sector in components that have to withstand severe in service conditions, i.e. high stresses and high temperatures. The mechanical properties rely on the microstructure that forms during the multiple hot deformation operations which are used for manufacturing these parts. Thus, the ability to predict and control the microstructure during thermomechanical processing is important. Many attempts have been made to achieve an acceptable level of microstructural prediction and nowadays many of the main metal forming software packages have built-in models for this purpose [1, 2, 3].
Among these models, the most popular ones are based on the JMAK (Johnson-Mehl-Avrami-Kolmogorov) model, which represent a classical approach to simulating the kinetics of recrystallisation [4]. The model was initially derived by A. Kolmogorov in 1937 [5] and described the crystallisation of melts. Afterwards, this equation was independently obtained by W.A. Johnson & R.F. Mehl in 1939 [6] and M. Avrami [7] used it to describe the kinetics of phase transformation.
One of the main challenges in the application of such an approach and, therefore, the prediction of microstructure evolution, lies in the fact that the model was developed, calibrated and validated using mainly laboratory tests with stabilized process parameters i.e. the process variables (e.g. temperature, strain rate) were held close to constant. An example of this is the equation for static grain growth [8], employed in commercial software and used further in this paper. The material constants used in the equation were obtained experimentally for stable conditions and used for prediction of grain growth at constant temperature. Nevertheless, such models are applied to industrial processes such as hot forging, which is characterised by variable loading conditions, temperature and strain rates. This calls into the question the reliability of the predictions obtained. Indeed, it is often seen from
the results of FE simulations that certain areas of the deformed part have a complicated temperature-strain rate history which reflects the complexity of the part’s geometry. In addition, these types of models do not consider the morphology of grains, secondary phases and the history of loading, i.e. the history of the recrystallisation; the history of temperature changes or the loading history.
The present paper explores the applicability of JMAK models in the context of real world manufacturing process. The results of finite element analysis (FEA) based predictions for the microstructure evolution in ATI 718Plus® alloy during a hot deformation process is presented. An extrusion operation was chosen as a metal forming operation which has a relatively simple history of loading. This facilitated a more accurate use of the model given the recognised limitations.
ATI 718Plus® alloy was chosen as a representative of the nickel based class of alloys for FE microstructure modelling. This material is a superalloy developed by ATI Allvac in 2004 [9]. It has enhanced high temperature capability and thermal stability compared with Inconel 718. At the same time ATI 718Plus® alloy retains good formability and weldability. The alloy is mainly used in gas turbine engine and power turbine applications and potentially can be used as a lower cost replacement for Waspalloy and U720, when those alloys are used in the temperature range of 593 ºC – 700 ºC [10].
The microstructure evolution prediction is based on recrystallisation as well as static grain growth models. The simulated average grain size is compared with those experimentally measured after forging trials. This study uses one of the modified JMAK type models for simulating recrystallisation during the hot extrusion process [11]. An initial attempt to take into account the influence of the -phase [12] on recrystallisation was made by Sommitsch and Huber [11,13]. The model allows the estimation of the volume fraction as well as average grain size of the recrystallised material during the deformation process. Some further development of the basic models is also reported. In particular, the equations for average grain size were rewritten in incremental form required for FEA modelling.
The limitations of such classical models are discussed in the paper. The causes of such limitations are investigated and the requirements for model output are formulated. A concept for a possible alternative modelling approach for microstructure prediction in nickel based superalloys is presented.
Experimental Procedure and Simulation
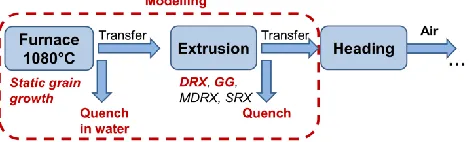
microstructure evolution models (see Fig. 1). The first operation involved heating ATI 718Plus® billets in the furnace at a super-solvus temperature (for 15 minutes). It was used to verify the model for static grain growth (GG). To obtain a reference microstructure after this operation, the billet was quenched in water immediately after heating.
Figure 1. Manufacturing sequence for obtaining aerofoil preforms from ATI 718Plus® alloy.
The hot extrusion of preforms is the second technological operation in the aerofoil manufacturing process. This operation was used to validate the recrystallisation (RX) model for ATI 718Plus® alloy. The extrusion operation was carried out with high strain rate (the order of 102 s-1) on Schuler Multiforge – 3500 kN press. It is a direct drive horizontal split die upsetting press with separate servo drive motors providing up to 5000kN grip load and 3500 kN upsetting force respectively. High-performance servomotors enable programming of diverse ram speed profiles and stroke sequences.
During the extrusion operation dynamic recrystallisation (DRX) takes place. Once the deformation is completed, metadynamic (MDRX) and static (SRX) recrystallisation, as well as GG, are also possible. From previous experience, DRX is known to be a prevailing mechanism of recrystallisation, so efforts were focused on DRX modelling. It should also be noted that neither the experimental nor the modelling part of the study allows the accurate separation of the MDRX and DRX mechanisms of recrystallisation. Therefore, the RX model presented in this work describes “effective recrystallisation” (combining both these phenomena with a focus on DRX), which makes this model easier for industrial applications.
Simulations were performed using DEFORM 3DTM Multiple Operation Ver.11.0.1 FE package. The process operations were modelled as follows (see Fig. 1):
1) Heating the billet in the furnace;
2) Transfer of billet from the furnace to the extrusion dies; contact effects from billet handling were factored into the simulation;
3) Chilling effects as a result of billet residence time on die prior to extrusion;
4) Extrusion operation;
5) Chilling / time effects due to part / die contact following extrusion.
The work material was modelled as a rigid-plastic, isotropic, Huber-Mises material with flow stress depending on temperature, strain and strain rate. The flow stress data were taken from the ATI 718Plus® Alloy Data Sourcebook [10] and extrapolated to the higher strain rates of 102 s-1. It was also assumed that after a true strain of 1 the alloy behaves like an ideal plastic material. The friction was described using the Zibel friction law. Thermal
properties of ATI 718 Plus® were taken from [10]. Convection coefficients were set as a function of temperature based on thermocouple readings obtained during the actual forging trials. Contact heat transfer coefficients were defined experimentally and set as a function of applied pressure.
To obtain a reference microstructure for validation assessment, several extruded billets were quenched immediately after the extrusion operation. Thus, the microstructure immediately following heating and extrusion was fixed for further SEM study.
Microstructure Evolution Modelling
Static Grain Growth (GG) Model
GG occurs in the initial material during preheating in the furnace. This grain size evolution mechanism can also take place after extrusion, providing that the current temperature is still higher than some threshold value which allows the GG mechanism to be activated. The driving force for this process is the reduction of grain boundary energy through reduction of boundary area. Possible GG during the extrusion operation can be neglected due to the short time of the deformation process (less than 0.2 seconds).
According to [11], there is no GG in ATI 718Plus® alloy below a critical temperature of 975 ºC. This temperature is close to the solvus temperature of the -phase [10] that decorates grain boundaries and impedes grain growth. Thus, this temperature value was set as a temperature threshold for GG activation.
The following widely-known equation [8] is usually used to describe GG at constant temperature in quasi single-phase materials, as, for example, for Inconel 718 alloy in the DEFORMTM FE package [3], and the description of GG in ATI 718Plus® alloy in [10, 11]:
gg gg
n gg n
gg
RT Q t
A D D
1
0 exp
(1)
where Dgg- the average grain size after GG, [µm]; D0 – initial
grain size, [µm]; T – temperature of heat treatment, [K]; t – time at the temperature T, [sec]; ngg– the GG exponent; Qgg– denotes
the activation energy for grain growth [J/mol]; A – material constant; R– the universal gas constant [J/(K·mol].
The following criteria for static GG activation are used:
- The temperature is higher than the some critical temperature [11, 3];
- Grain growth takes place before recrystallisation starts or after the recrystallisation process stops [3].
gg i gg i n i gg eq n gg RT Q t A D D 1 0 exp
(2)
where
i
gg
D – the average grain size after GG at i-step of
simulation, [µm]; Ti – temperature at current step of simulation,
[K];
i
eq
t – equivalent time for calculating
i
gg
D with the
temperature Ti, [sec].
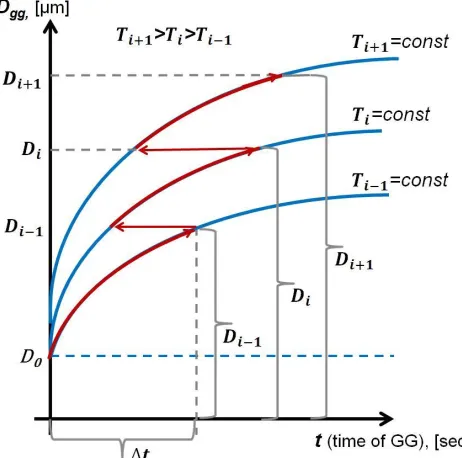
Eq. 2 was incrementally calculated at each time step in the FE simulation. Fig. 2 explains the method of defining the average grain size and the equivalent time teqi for each step of simulation.
The curves Ti-1, Tiand Ti+1 in Fig. 2 schematically represent the
[image:3.612.57.288.255.484.2]scheme of grain growth for different heating temperatures.
Figure 2. Computational scheme to calculate average grain size
Dgg after static grain growth according to Eq. 2.
The equivalent time
i
eq
t was calculated for each step according
to: t t t i i D
eq 1
,
i gg n n gg D RT Q A D D t g g g g i i exp 0 1
1
(3)
where t – the time increment of the FE simulation, [sec];
1 i
D
t –
time needed to get grain size Dggi1 from the previous step (i-1)
with the temperature Ti at the current step.
The parameters ngg and A were taken according to the work of
Sommitsch et al [11]. The activation energy, Qgg, for static GG
was taken from the ATI 718Plus® Data Sourcebook [10].
Recrystallisation (RX) Model
A modified JMAK– type model taken from the work of Sommitsch et al [11, 13] was employed to simulate the volume fraction of recrystallised (RX) grains in the billet during the hot extrusion operation. The recrystallised fraction was calculated according to equations Eq. 4:
1 5 . 0 ) 5 . 0 ln( exp 1 m cr cr RX X
, (4)
4 3 0 m m p pk D Z
,
p cr cr k
, 2
1 5 . 0 m Z k , RT Q
Z exp
where: XRX – recrystallised volume fraction; – accumulated
strain at the current step; p– peak strain (corresponds to flow
stress maximum); 0.5 – strain needed for 50% recrystallisation;
cr– critical strain needed for start of RX; – effective strain rate,
[s-1]; Z – Zener-Hollomon parameter; Q – activation energy for RX, [J/mol]; m1, m2, m3, m4, kcr, kp, k1 – material data.
It should be noted that the parameters k1, m1 and m2 in Eq. 4 are
put as semi-temperature dependent - with two different values specified for two temperature ranges: sub-solvus and super-solvus temperatures for the -phase. By this means, the authors [11, 13] tried to take into account the influence of the -phase on the kinetics of recrystallisation. The parameters for Eq. 4 were defined from the mechanical tests by Sommitsch et al, please refer to the papers [11, 13] for the details.
As can be seen from Eq. 4, there are 7 parameters which should be defined experimentally. This is one of the significant problems which limit the application of the model, because it makes experimental calibration of the model problematic. In addition, it is known that the activation energy for RX, Q, may change significantly for various temperatures of deformation [14]. This may complicate the application of Eq. 4.
Due to the complexities in determining the parameters needed for Eq. 4, no attempt was made in this study to distinguish between meta-dynamic or dynamic recrystallisation. Instead of this, it was assumed that the parameter set in Eq. 4 encompasses all possible mechanisms of recrystallisation occurring during/after the deformation process.
The average grain size of new RX grains DRX was calculated with
relationship used in [11, 13]:
) exp( 3
2 T k
k
DRX (5)
where k2 and k3 are material constants which were defined
experimentally in [13].
To attempt to rectify these deficiencies, the equation for DRX can
be written as in the form of [15]:
D D C dt
DRX 1 2 exp (6)
where: D1, D2 and C are material constants; – is current flow
stress value; and – current strain rate .
As can be seen from Eq. 6, the RX grain size calculation is based on the accumulated plastic work of deformation, which is a usable parameter for FEA simulations due to its stable, integral nature. The main benefit of such an approach is that it takes into account loading history at least in some form. Here temperature is accounted indirectly through the flow stress function. A more detailed description of the approach is given in [15].
The models for GG and RX described above were embedded into the DEFORM 3DTM FE package as FORTRAN user subroutines.
Results
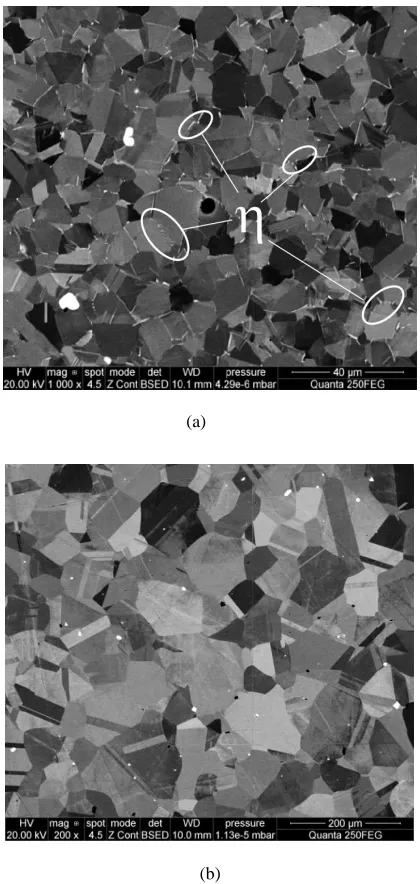
Fig. 3 shows the results of SEM microstructure studies of ATI 718Plus® billet in the as-received condition, as well as after GG in the furnace. As can be seen from Fig. 3a, the initial billet contained -phase (fine white coloured particles at the grain boundaries). Thus, static grain growth was prevented by Zener pinning until the -phase solvus temperature was reached. According to the results of experimental grain size measurement, the initial average grain size of about 10 µm has increased to an average grain size of about 70 µm during the heating operation.
The average grain size after 15 minutes of heating in a furnace at super-solvus temperature was calculated using Eq. 2. According to the simulation results, the average grain size increased from the initial value of 10 µm to 62 µm, which is about 15% lower than that experimentally observed (see Fig. 3b).
According to the RX simulation results, following extrusion all material in the extruded part was recrystallised (see Fig. 4a). The average RX grain size on the surface of the extrude was calculated to be in the range of 7 – 10 µm (see Fig. 4b). The deep blue colour in Fig. 4b represents a extruded and, as a result, non-recrystallised region with the predicted average grain size of 62 µm after static grain growth in the furnace.
To find out the difference between the grain size in the central and surface region of the extruded cross-section, two reference points were selected. As can be seen, the grain size in the central part (P1) is 14 µm which is in reasonably good agreement with the experimental results of the microstructure study in this area (10 – 12 µm, see Fig. 5). The grain size on the surface layer is slightly smaller (about 10 µm for reference point P2 in Fig. 4b) than in the central part; this may be linked to cooling during the transfer of the part from the furnace to the forge and the dwell prior to tool closure.
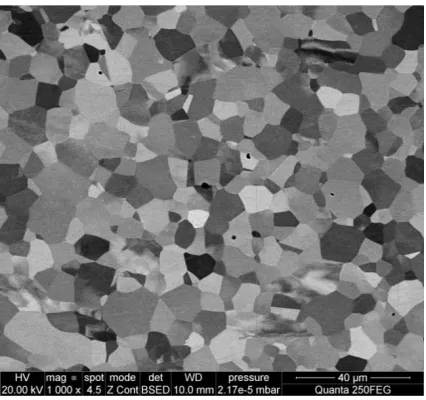
The results of the SEM study in the central part of the reference cross-section are shown in Fig. 5. It can be seen that material here looks to be completely recrystallised after extrusion in this area. The average grain size decreased from about 70 µm (see Fig. 3b) to 10 – 12 µm (see Fig. 5).
(a)
[image:4.612.333.543.69.511.2](b)
Figure 3. SEM microstructure study of ATI 718Plus® billet: (a) - initial material, 10 µm; (b) – microstructure after static grain growth in the furnace, 70 µm.
The approximate measurements of recrystallised grain size at the surface indicate that the size may be rather smaller – approximately 2 µm. It is difficult to get the precise evaluation of microstructure close to the stem surface due to intensive shear deformation caused by friction. But it is clear that it is significantly smaller than that predicted by simulation.
Figure 4. Results of the base FE simulation with parameters from the forging trials: (a) – volume fraction of recrystallised grains; (b) – average grain size of new recrystallised grains.
Figure 5. SEM study of microstructure in the central part of the stem’s cross-section after the extrusion operation (grain size: 10 – 12 m).
Discussion
As can be seen from the data above, the JMAK model gave acceptable results for the central part of the billet cross-section, where stabilized metal flow had taken place. Extrusion is a relatively simple metal forming process wherein material points flow with simple kinematics, i.e. without large changes of velocity and flow direction. However, even though the process was simple, an unsatisfactory prediction was obtained for the near-surface layers of the material. The reason for this is the more complicated and non-steady state metal flow caused by a higher temperature gradient and friction effects in the near-surface layers. In these non-stationary conditions, the applied model becomes insufficient to describe microstructure evolution during the deformation. Furthermore, the majority of industrial close-die forging processes have much a more complicated geometry and, consequently, rheology that cannot be characterized by JMAK-like models with adequate accuracy.
Moreover, in the case of modelling a full sequence of technological operations the problem becomes much more complicated. The initial heat treatment (HT), cooling during transferring and HT between the metal forming operations should be modelled as well. In such cases thermal history becomes more complicated and a much broader range of possible microstructure states should be predicted for the accurate description of the microstructure evolution.
Even quasi single-phase material with the same average grain size can have a wide range of possible microstructures [16]. Fig. 6 shows some of the most typical classes of grains for nickel based superalloys. On top of this, given that the evolution of microstructure in the primary () phase is significantly controlled by precipitates, their status is also important. The changes of volume fraction and morphology of secondary phases have to be considered as well, e.g. -phase for IN718, -phase for ATI 718Plus® [12, 17]. Fig. 7 illustrates some common classes of precipitate morphology in these alloys. It becomes clear that simulating microstructure evolution of more complicated geometries and processes moves to the forefront other parameters such as the morphology of grains and secondary phases.
As can be seen from the pictures, describing the microstructural state of the material becomes challenging. The problem is that any single parameter, such as average grain size, is evidently insufficient, while using many parameters, e.g. linked to the varieties of geometrical morphology, is not viable due to the additional complications it adds to the model. Consequently, the design of a new approach which employs a minimum number of variables for numerical characterisation of microstructure is required.
According to the proposal of Rabotnov [18], the state of a system may be described through internal variables that are not obliged to have a direct geometrical or physical sense, but only reflect the structural state. This suggests that some effective parameters can be introduced and associated not with the size or aspect ratio of grains, but directly to the morphological state.
[image:5.612.68.281.467.667.2](a) (b)
(c) (d)
Figure 6. Classes of grains morphologies: (a) homogeneous;
(b) duplex homogeneous; (c) duplex banding; (d) duplex necklace.
(a) (b)
(c) (d)
Figure 7. Classes of precipitate morphologies: (a) no secondary phase (quasi-single phase material); (b) secondary phase precipitated inside the γ-grains; (c) secondary phase precipitated inside on grain boundaries; (d) intra-granular.
which is already widely utilized in industry. These industrial standards can be used as a primary guideline for defining the class
of a microstructure as well as specific microstructural characteristics within those classes. Internal variables associated with these classes can be included into a macroscopic model to take into account the effect of microstructure on the rheological behaviour of a material. At the same time, the evolution of the microstructure from class to class can be described with relatively simple phenomenological equations, because it has to reflect only the main trends without going deep into the details of micromechanics. Such an approach, first proposed by Bylya et al
[19], provides a first order description of microstructure and satisfies the requirement of a minimum number of parameters.
A similar approach can be suggested for modelling microstructure evolution during thermomechanical processing in nickel-based superalloys. In this case, a variety of possible microstructures can be characterised by 4 parameters:
Parameter#1 defines the main phase class (e.g. Fig.6
a,b,c,d);
Parameter#2 defines a scale factor of the main phase class (similar to the scaling templates included in the standard [16]);
Parameter#3 characterising the class of precipitate morphology (e.g. Fig.7 a,b,c,d);
Parameter#4 for volume fraction of precipitates.
However, it’s clear that the role played in the constitutive model by these parameters is very different, e.g. the morphology of the basic phase directly affects the mechanical behaviour of the material, while the secondary phase mainly controls microstructural transformations. Fig. 8 schematically represents the proposed approach to the modelled microstructure evolution. These four parameters represent the input and output of the model, and describe the state of the material. Parameters #3 and #4 are responsible for the precipitates, and are mainly temperature dependent. They influence the final grain size and recrystallisation kinetics. Thus, these parameters play the role of a “filter” in the model (see Fig. 8). On the other hand, the main phase parameters; #1 and #2, depend on both plastic work and temperature and, as was mentioned earlier, contribute to the material rheology.
Therefore, the “process parameter input”, which reflect the state of deformation loading, will be represented by strain energy, strain rate and temperature (and maybe, additionally, strain energy rate). During the hot forging process both microstructure and precipitation evolution phenomena will take place resulting in a different microstructure state of the material.
[image:6.612.54.297.71.315.2] [image:6.612.54.294.364.605.2]Figure 8. Microstructure evolution model.
Conclusion
The applicability of a modified JMAK-type model for predicting grain size was assessed for a hot extrusion process on ATI 718Plus® alloy. The model has proved to be valid for describing microstructure evolution in the main body of the forging. However, results predicted for the surface were not accurate. The reason for this is the more complicated and non-steady state metal flow caused by the high temperature gradient and friction effects influencing the near-surface layers. In these non-stationary conditions, the applied model becomes insufficient to describe microstructure evolution during the deformation.
It was also observed that classical as well as modified JMAK models are limited inasmuch as they disregard information such as the class of grain structure, the precipitate morphology, as well as the history of loading.
The concept of an alternative model for microstructure prediction in nickel based superalloys is presented. It is proposed to use a limited number of effective parameters for description of the class, type, morphology and scale of microstructure.
The proposed approach to microstructure modelling should allow some of the limitations of JMAK-type models to be overcome and should also provide more comprehensive information about microstructure, as well as satisfying the requirement for a minimum number of parameters in the constitutive equations used. Further work will be carried out to develop and validate this model.
Acknowledgements
The authors would like to acknowledge support of the Advanced Forming Research Centre Tier 1 members – in particular; Rolls-Royce and Aubert & Duval who were lead partners for this work. Some of the material in the paper also originates from internally funded AFRC project work.
References
1. C.M. Sellars and L.A. Whiteman, “Principles of Hot Deformation - Controlled Processing of HSLA Steels,” Proc. BSC
Product Technology Conference, 1976.
2. QFORM v8 FE package documentation, Description of
Microstructure evolution model:
http://www.qform3d.co.uk/db_files/17/123.pdf (Micas Simulation
Ltd., Accessed: 10/02/2016)
3. DEFORMTM V11.0.1 System Documentation, (Reed Road Columbus, Ohio: Scientific Forming Technologies Corporation, 2014), 175-180.
4. F. Humphreys and M. Hatherly, Recrystallization and related
annealing phenomena (Amsterdam: Elsevier, 2004), 574.
5. A.N. Kolmogorov, “On the Statistical Theory of the Crystallization of Metals,” Bulletin of the Academy of Sciences of
6. W. Johnson and R. Mehl, “Reaction kinetics in processes of nucleation and growth,” Transactions of the American Institute of
Mining and Metallurgical Engineers, 135 (1939), 416–458.
7. M. Avrami, “Kinetics of phase change, I. General theory,” The
Journal of Chemical Physics, 7 (1939), 1103–1112.
8. P.A. Beck, M.L. Holdsworth, P.R. Sperry, “Effect of a dispersed phase on grain growth in Al-Mn Alloys,” Transactions of the Metallurgical Society of AIME (American Institute of
Mining, Metallurgical, and Petroleum Engineers), 180 (1949)
163.
9. W.D. Cao, R.L. Kennedy, “Role of chemistry in 718-type alloys – Allvac 718PlusTM alloy development,” Proc.
Superalloys 2004, TMS, 2004, 91-99.
10. ATI 718 Plus® Alloy Data Sourcebook, ed. Erin McDevitt (Monroe, NC: ATI Allvac, 2011), 98.
11. C. Sommitsch et al., “Recrystallization and grain growth in the nickel-based superalloyAllvac 718Plus,” International Journal of
Materials Research (formerly Z. Metallkd.),100 (8) (2009), 1088 –
1098.
12. E.J. Pickering et al., “Grain-boundary precipitation in Allvac 718Plus,” Acta Materialia, 60 (2012), 2757–2769.
13. D. Huber et al., “Microstructure modeling of the dynamic recrystallization kinetics during turbine disc forging of the nickel based superalloy Allvac718PlusTM,” Proc. Superalloys 2008, TMS, 2008, 855– 861.
14. O.I. Bylya et al., “Modelling of active transformation of microstructure of two-phase Ti alloys during hot working,”
Letters on Materials, 4 (2) (2014), 124-129.
15. O.I. Bylya et al., “FEM simulation of microstructure refinement during severe deformation,” IOP Conference Series:
Materials Science and Engineering, 63 (2014)
doi:10.1088/1757-899X/63/1/012033.
16. AMTS E1181 – 02(2015) Active Standard, Standard Test
Methods for Characterizing Duplex Grain Sizes (West
Conshohocken, PA: ASTM International, 2015), 15.
17. S. Azadian, L. Wei, and R. Warren, “Delta phase precipitation in Inconel 718,” Materials Characterization, 53 (1) (2004), 7-16.
18. Yu.N. Rabotnov, “Creep Problems in Structural Members,”
North Holland Series in Applied Mathematics and Mechanics,
vol. 7 (Amsterdam/London: North-Holland Publishing Company, 1969), 120.